
Abstract
Background:
The maximum standardized uptake value (SUVmax), as determined on combined single-photon emission computed tomography and conventional computed tomography (SPECT/CT), can be an indicator of biomechanical changes due to the load redistribution effect after medial open-wedge high tibial osteotomy (MOW-HTO).
Purpose/Hypothesis:
The purposes of this study were to (1) analyze serial changes in the SUVmax in the medial, lateral, and patellofemoral compartments after MOW-HTO and (2) identify the contributing factors that affect changes in the SUVmax. The hypotheses were that (1) an elevated SUVmax in the medial compartment would be transferred to the lateral compartment because of the load redistribution effect and (2) there would be contributing factors that cause SUVmax changes.
Study Design:
Case series; Level of evidence, 4.
Methods:
Included were 67 knees that were treated with biplanar MOW-HTO between March 2019 and December 2020. SPECT/CT was performed immediately after surgery and at 3 months and 1 year postoperatively to determine the serial load redistribution effect of MOW-HTO. The Pearson correlation coefficient was used to evaluate the relationship between SUVmax and radiological parameters, and subgroup analyses were conducted to compare the SUVmax according to associated cartilage procedures and the weightbearing line ratio (WBLR).
Results:
The SUVmax in the medial and lateral compartments increased at 3 months but decreased at 1 year postoperatively. The load redistribution effect was most prominent in the anterior zones of the femur (medial: P = .041; lateral: P = .012). In the patella, the SUVmax decreased in both the medial and the lateral zones at all follow-up times (P < .001 for all). The SUVmax in the anterolateral and posterolateral articular zones of the femur increased with a greater preoperative WBLR (r = 0.256, P = .039; and r = 0.261, P = .036, respectively). Patients who underwent an associated cartilage procedure had a significantly higher SUVmax in the anteromedial and posteromedial articular zones of both the femur and the tibia at 1 year postoperatively (P ≤ .002 for all).
Conclusion:
After MOW-HTO, the unloading effect in the anteromedial articular zone of the femur was the most significant. A greater SUVmax in the lateral zones of the femur was observed in cases of overcorrection. The SUVmax in the medial zones was higher postoperatively in patients with associated cartilage procedures.
Medial open-wedge high tibial osteotomy (MOW-HTO) is a common approach to treat medial compartment osteoarthritis (OA) of the knee joint. MOW-HTO consists of realignment of the lower limb to shift the weightbearing load from the affected medial compartment (ie, the unloading effect). 1,2,9,21 After MOW-HTO, load redistribution can affect other compartments, including the lateral or patellofemoral compartment. 2,26
Assessing the unloading effect after MOW-HTO is important when evaluating whether adequate correction is achieved. In addition, it is important to determine whether overloading is distributed to other compartments. However, load redistribution after MOW-HTO cannot be evaluated on routine radiography, computed tomography (CT), or magnetic resonance imaging. 6
Recently, combined single-photon emission CT and conventional CT (SPECT/CT) has been applied to visualize the mechanical load distribution. 15,19 The maximum standardized uptake value (SUVmax) has been used for the quantitative evaluation of bone metabolism, 4 and it is assumed that a serial assessment of the SUVmax can indicate mechanical changes that occur from the medial unloading effect after MOW-HTO. The SUVmax has also been correlated with OA severity. 13,28
The purposes of this study were to (1) analyze serial changes in the SUVmax in the medial, lateral, and patellofemoral compartments after MOW-HTO and (2) identify the contributing factors that affect changes in the SUVmax. The hypotheses of this study were that (1) an elevated SUVmax in the medial compartment would be transferred to the lateral compartment because of the load redistribution effect and (2) there would be contributing factors that cause SUVmax changes.
Methods
Patients
The protocol for this study received institutional review board approval. A total of 77 consecutive knees treated with biplanar MOW-HTO between March 2019 and December 2020 were enrolled in this retrospective analysis. The inclusion criteria were (1) OA in the medial compartment, (2) a concurrent varus deformity of the lower limb, (3) the failure of nonoperative treatment, and (4) a serial postoperative assessment with SPECT/CT immediately after surgery (baseline) and at 3 months and 1 year. The exclusion criteria were (1) traumatic OA, (2) a lateral hinge fracture after MOW-HTO, (3) revision MOW-HTO, and (4) double osteotomy including distal femoral osteotomy. After 10 knees were excluded, 67 knees were ultimately included (Figure 1).

Flowchart for participant selection. LHF, lateral hinge fracture; MOW-HTO, medial open-wedge high tibial osteotomy; OWHTO, open-wedge high tibial osteotomy.
Surgical Technique and Rehabilitation
All MOW-HTO procedures were performed by a single senior surgeon (Y.S.L.). The target weightbearing line (WBL) was assessed preoperatively on true-standing whole-leg radiography. The most common target WBL ratio (WBLR) ranged from 55% to 65%. An incision was made longitudinally at 1 cm anterior to the posteromedial border of the tibia. The superior border of the pes anserinus was incised, and the superficial medial collateral ligament was mobilized from the tibia and released using a periosteal elevator. With C-arm imaging, a protective cutting system (Tradimedics and Corentec) was used on the lateral cortical hinge located just below the tip of the fibular head, and sawing was performed until 5 to 10 mm of the lateral cortex was reached. 17 Next, the osteotomy site was distracted, and fixation was performed. While paying attention to avoid an excessive increase in the posterior slope, the degree of distraction was adjusted to the most posterior gap. 16
Rehabilitation consisted of isometric quadriceps exercises and continuous passive motion exercises initiated on the first postoperative day. Partial weightbearing with crutches was permitted during the first 2 weeks postoperatively, and full weightbearing was permitted from postoperative week 2 if the patient could tolerate it. Crutches were used until 6 weeks postoperatively. Stair climbing and sudden standing from the sitting position were prohibited during the first 3 months postoperatively if possible. 25
SPECT/CT Evaluation
Quantitative Bone SPECT/CT
As part of standard clinical care, SPECT/CT was performed on all patients who underwent MOW-HTO. Images were acquired with either an NM/CT 670 or NM/CT 670 Pro camera (GE Healthcare) at 2 to 3 hours after an injection of 20 mCi of Tc-99m hydroxydiphosphonate. Anterior and posterior planar images of the knee region were obtained, followed by SPECT/CT images. SPECT images were acquired using a low-energy high-resolution collimator, with a peak energy window at 140 keV with a 20% window (126-154 keV) and a scatter window at 120 keV with a 10% window (115-125 keV). Scanning was performed in the step-and-shoot mode, with 10 seconds per step, a 3° angle, and 60 steps per detector. CT images were acquired with a tube voltage of 120 kVp, tube current of 60 to 210 mA with auto mA function, table feed per rotation of 18.75 mm/rot, table speed of 37 mm/s, helical thickness of 2.5 mm, tube rotation time of 0.5 seconds, and pitch of 0.938:1. The patient’s weight, height, and injected dose of Tc-99m hydroxydiphosphonate were recorded.
Image Reconstruction and SUVmax Measurement
SPECT image reconstruction was performed with Xeleris 4DR software (GE Healthcare). Images were reconstructed using an iterative ordered-subset expectation maximization method, with 2 iterations and 10 subsets, using a Butterworth filter (frequency: 0.48/order: 10), CT attenuation correction, scatter correction, and resolution recovery options. The zoom factor was 1.15, the matrix size was 128 × 128, and the slice thickness was 2.95 mm. An algorithm using Q.Metrix software (GE Healthcare) 18 was applied for the measurement of the SUVmax, with radioactivity of 151.8 counts per minute for the NM/CT 670 camera and 149.3 counts per minute for the NM/CT 670 Pro camera.
The knee compartments were categorized into a total of 10 zones: 4 femoral articular, 4 tibial articular, and 2 patellar zones (Figure 2A). The tibia and femur were each divided into anteromedial articular (AM-A), posteromedial articular (PM-A), anterolateral articular (AL-A), and posterolateral articular (PL-A) zones. The patella was divided into medial articular (M-A) and lateral articular (L-A) zones. The mediolateral compartments and anteroposterior compartments were divided at the midline. The femoral and tibial compartments were defined by a thickness of 60 mm.
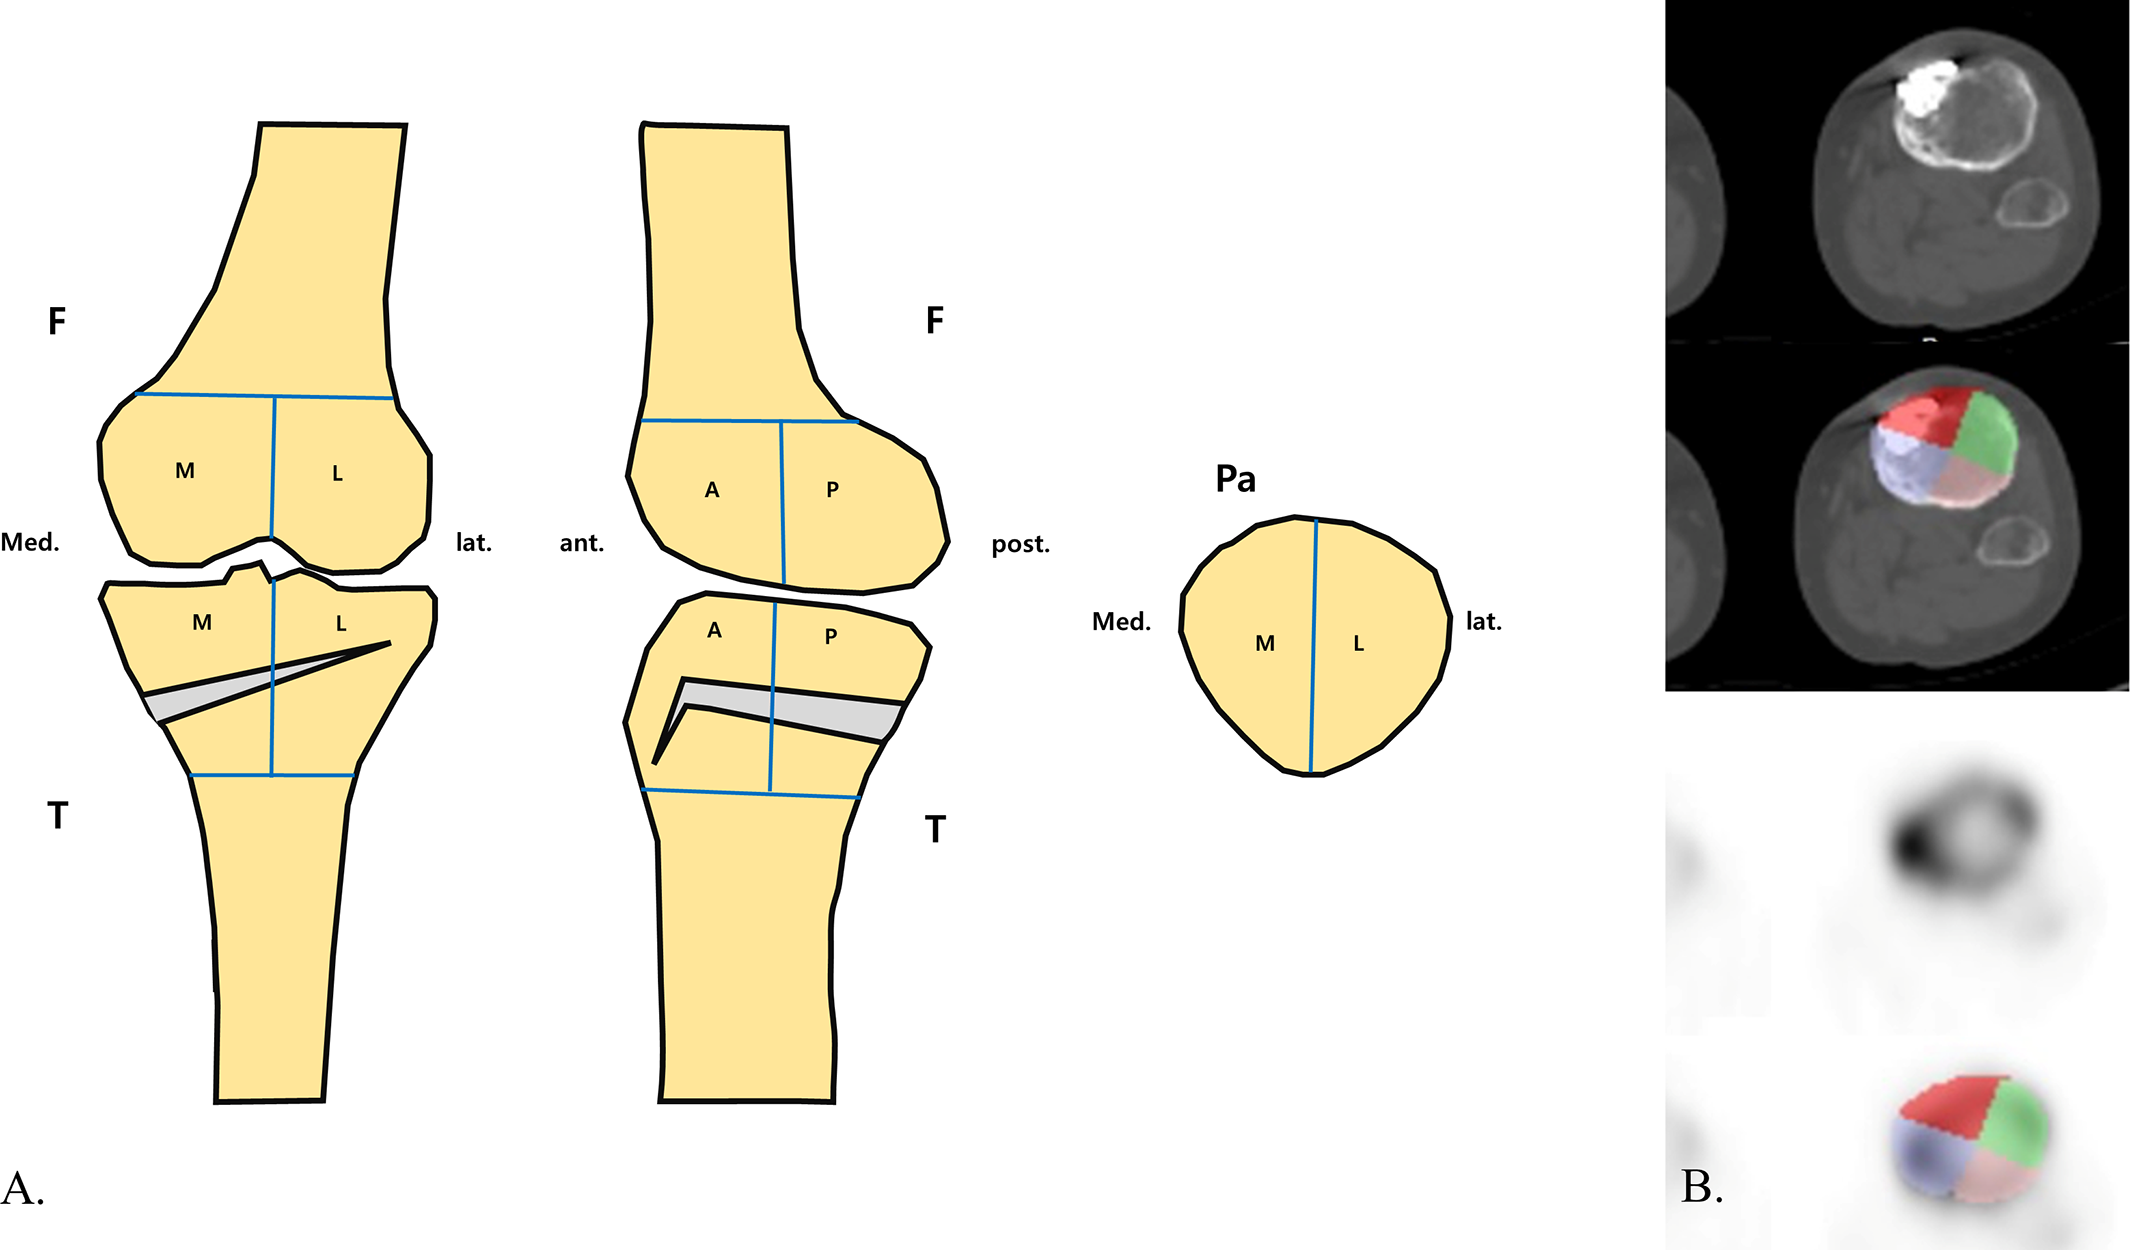
(A) Knee compartments were categorized into a total of 10 zones: 4 femoral, 4 tibial, and 2 patellar. A, anterior; F, femur; L, lateral; M, medial; Pa, patella; P, posterior; T, tibia. (B) Regions of interest (ROIs) in the tibial compartment drawn on a single slice of coregistered single-photon emission computed tomography and conventional computed tomography images. Respective ROIs for each zone were integrated to generate volumes of interest of the 10 zones.
Next, volumes of interest of the 10 zones were generated using the following method. Regions of interest (ROIs) were manually drawn on every slice of the coregistered transaxial CT images for each respective zone. The thickness and boundaries of the ROIs were defined in relation to the slice thickness of the CT image. The ROIs were superimposed on the SPECT images for the visual inspection of any possible misregistration (Figure 2B). Respective volumes of interest were generated by integrating every drawn ROI using a Q.Metrix algorithm.
Quantitative load redistribution was serially assessed with SPECT/CT performed on postoperative day 1 for baseline status, at 3 months postoperatively to examine early changes, and at 1-year intervals thereafter to determine the serial load redistribution effect of MOW-HTO (Figure 3).
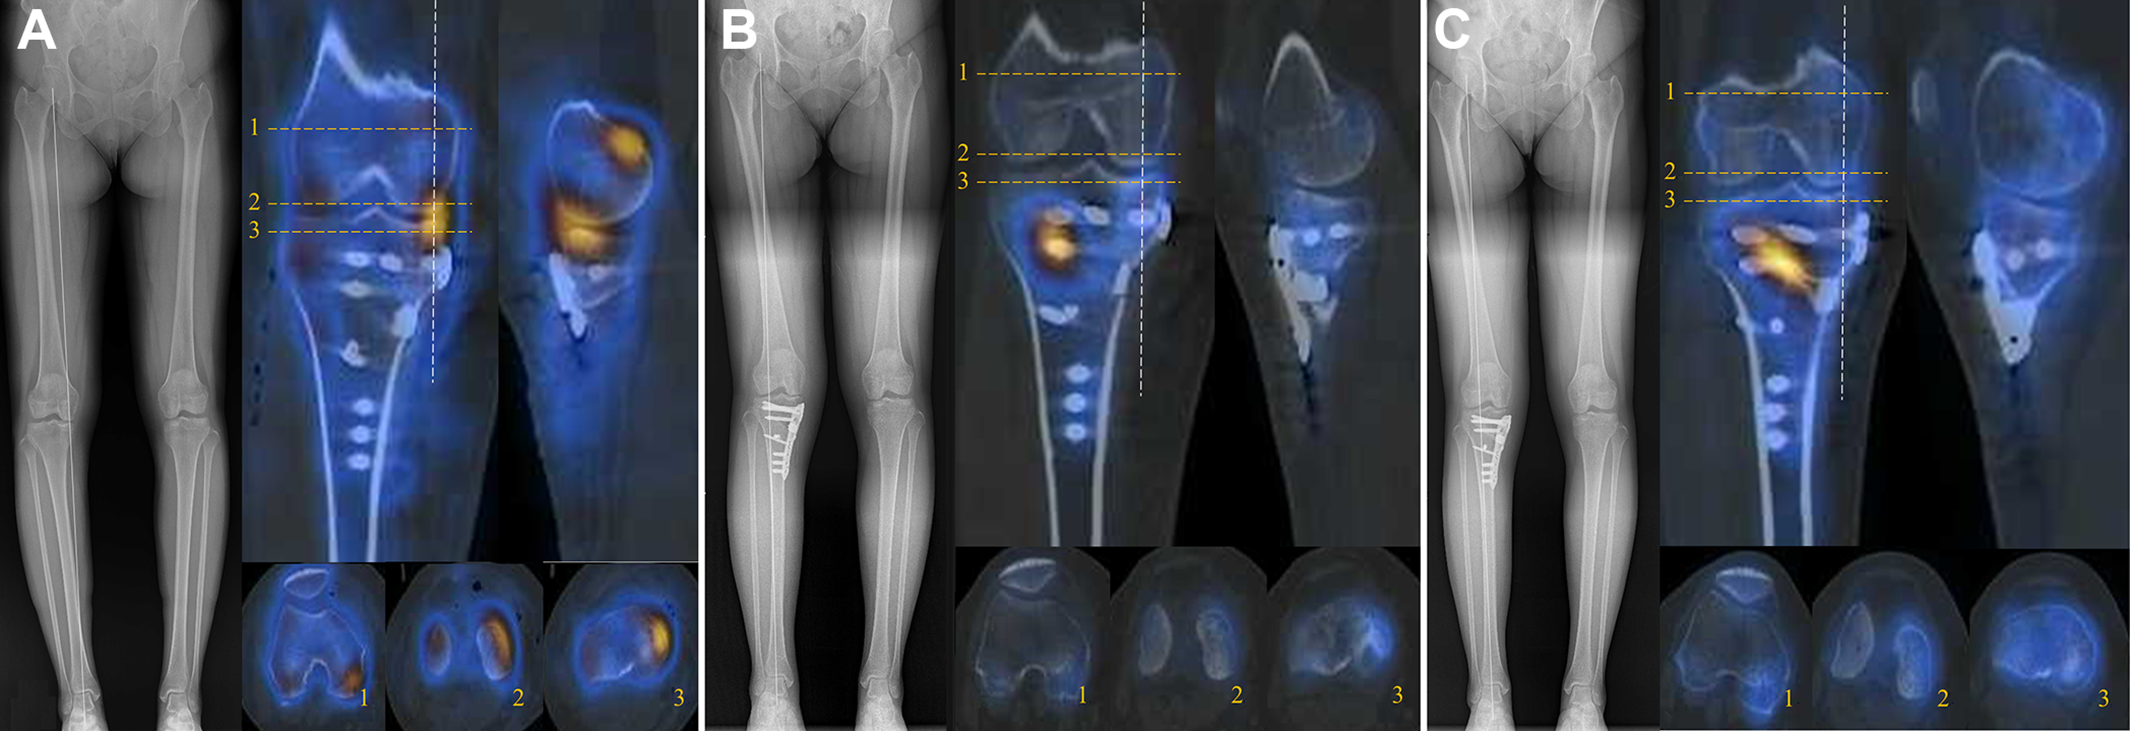
Quantitative load redistribution was serially assessed with single-photon emission computed tomography and conventional computed tomography performed (A) on postoperative day 1, showing that the baseline signal in the medial articular zone was elevated; (B) at 3 months postoperatively, to determine whether the early postoperative change in the signal on the hinge side was increased; and (C) at 1 year postoperatively, showing that the signal on the medial opening gap side was increased. 1 = patellofemoral joint; 2 = articular side of femur; 3 = articular side of tibia. The dashed white line indicates the sagittal cut of the medial side.
Contributing Factor Analysis
For contributing factor analysis, radiological parameters, intraoperative cartilage status, and associated procedures were compared with the SUVmax.
Radiological Factors
Radiographic indicators were analyzed to evaluate whether mechanical changes due to surgery were related to the SUVmax. Conventional radiographs, including standing-knee anteroposterior, lateral, and whole-leg weightbearing views, were serially obtained preoperatively, at 3 months postoperatively, and at 1-year intervals thereafter, and the following parameters were checked: WBLR, medial proximal tibial angle, mechanical lateral distal femoral angle, joint line orientation angle, posterior tibial slope (PTS), patellar height, patellar tilt angle, and Kellgren-Lawrence grade. The WBL was drawn from the center of the femoral head to the center of the superior articular surface of the talus, and the WBLR was defined as the horizontal distance from the WBL to the medial edge of the tibial plateau divided by the width of the tibial plateau (with the medial tibial edge at 0% and the lateral tibial edge at 100%). The medial proximal tibial angle was defined as the medial angle formed between the mechanical tibial axis and the articular surface of the proximal tibia, and the mechanical lateral distal femoral angle was defined as the lateral angle formed between the mechanical femoral axis and the articular surface of the distal femur. The joint line orientation angle refers to the angle formed between a line parallel to the ground and the tangent line of the tibial plateau on a whole-leg weightbearing radiograph. The PTS was defined as the angle between a line perpendicular to the diaphysis of the posterior tibia and the posterior inclination of the mean of the medial and lateral tibial plateaus on a lateral radiograph. The patellar height was measured using the Caton-Deschamps index, and the patellar tilt angle was defined as the angle subtended by a line joining the medial and lateral edges of the patella with the anterior surface of the femoral condyles in the skyline view (Figure 4). 20

Radiographs showing measurements of the (A) weightbearing line (WBL), (B) mechanical lateral distal femoral angle (m-LDFA), (C) medial proximal tibial angle (MPTA), (D) joint line orientation angle (JLOA), (E) posterior tibial slope (PTS), (F) patellar height (PH; measured using the Caton-Deschamps index; A/B), and (G) patellar tilt angle (PTA).
Overall, 2 orthopaedic surgeons (H.W.J. and H.S.N.) assessed the radiological results with an interval of 6 weeks for interobserver and intraobserver reliability. To analyze the SUVmax of each zone according to the degree of correction, patients were classified into 2 groups based on valgus overcorrection and undercorrection as measured by the WBLR: upper quartile (>75%) and lower quartile (≤25%).
Intraoperative Factors and Associated Procedures
The condition of the cartilage was assessed using the International Cartilage Regeneration & Joint Preservation Society (ICRS) grading system. 5 Multiple drilling of the femoral side and abrasion chondroplasty of the tibial side were performed if necessary. The SUVmax at each postoperative time point was compared between patients who underwent associated cartilage procedures of the medial femoral condyle and medial tibial plateau (group 1) and patients who did not undergo cartilage procedures (group 2).
Statistical Analysis
The interobserver and intraobserver reliability of the radiological measurements were analyzed using the intraclass correlation coefficient in which <0.40 indicated poor agreement, 0.40-0.75 indicated fair to good (moderate) agreement, and 0.76-1.00 indicated excellent agreement. All continuous variables were presented as the mean ± SD, and categorical variables were presented as percentages. Mixed repeated-measures analysis of variance was performed with multiple drilling and abrasion chondroplasty as control variables, considering that these intraoperative procedures may affect time-point analysis. The Student t test was used for analysis between cartilage procedure groups (group 1 vs 2) and between WBLR quartile groups (upper vs lower quartile). Finally, the Pearson correlation coefficient (r) was used to evaluate the association between radiological factors and the SUVmax. To correct for differences in the absolute SUVmax due to the different bone metabolism for each patient, we also evaluated the correlation between the change (Δ) in the SUVmax and the change in radiological factors. All statistical analyses were performed using SPSS (Version 26.0; IBM). The significance level was set at P < .05.
Results
The intraobserver and interobserver intraclass correlation coefficients for the radiological measurements ranged from 0.823 to 0.871, indicating excellent agreement.
Serial Analysis of SUVmax for Each Zone
The postoperative serial SUVmax values for each of the 10 zones are summarized in Table 1. In the tibia, there was no significant difference in the SUVmax in any of the zones from baseline to 1 year postoperatively. However, the SUVmax increased significantly in all 4 tibial zones from baseline to 3 months postoperatively (P ≤ .005 for all) and decreased to values that were even lower than baseline at 1 year postoperatively (P ≤ .003 for all). In the femur, the SUVmax was significantly lower at 1 year postoperatively compared with baseline (AM-A: P = .041; PM-A: P = .048) and 3 months postoperatively (AM-A: P < .001; PM-A: P < .001), and it was significantly lower in the PM-A zone between 3 months and 1 year postoperatively (P < .001). In the femur, the AL-A zone significantly decreased at 1 year compared with baseline (P = .012). In the patella, the SUVmax for the M-A and L-A zones was significantly lower at 1 year compared with baseline (P < .001 for both).
Serial SUVmax Values for Each Zone a

a The Bonferroni correction was applied for all multiple comparisons. Boldface P values indicate statistical significance (P < .05). AL-A, anterolateral articular; AM-A, anteromedial articular; L-A, lateral articular; M-A, medial articular; PL-A, posterolateral articular; PM-A, posteromedial articular; SUVmax, maximum standardized uptake value.
Relationship Between Radiological Factors and SUVmax
On Pearson correlation analysis between the SUVmax and preoperative radiographic parameters, the WBLR was significantly correlated with both the AL-A and the PL-A zones of the femur (r = 0.256, P = .039; and r = 0.261, P = .036, respectively). The PTS was significantly correlated with the PM-A zone of the femur (r = 0.252; P = .043) (Table 2). However, we found that at 1 year postoperatively, only the WBLR and PL-A zones of the femur were significantly correlated (P = .042).
Correlation Between SUVmax and Preoperative Radiological Parameters a

a Boldface P values indicate statistical significance (P < .05). AL-A, anterolateral articular; AM-A, anteromedial articular; JLOA, joint line orientation angle; L-A, lateral articular; M-A, medial articular; m-LDFA, mechanical lateral distal femoral angle; MPTA, medial proximal tibial angle; PL-A, posterolateral articular; PM-A, posteromedial articular; PTS, posterior tibial slope; SUVmax, maximum standardized uptake value; WBLR, weightbearing line ratio.
The ΔWBLR was significantly correlated with the ΔSUVmax for the AL-A and PL-A zones of the femur (r = 0.298, P = .017; and r = 0.369, P = .003, respectively). In addition, the ΔSUVmax for the PL-A zone of the tibia was significantly correlated with the ΔPTS (r = 0.263; P = .036) (Table 3).
Correlation Between Changes in SUVmax (ΔSUVmax) and Changes in Radiological Parameters a

a Boldface P values indicate statistical significance (P < .05). AL-A, anterolateral articular; AM-A, anteromedial articular; JLOA, joint line orientation angle; L-A, lateral articular; M-A, medial articular; MPTA, medial proximal tibial angle; PL-A, posterolateral articular; PM-A, posteromedial articular; PTS, posterior tibial slope; SUVmax, maximum standardized uptake value; WBLR, weightbearing line ratio.
Subgroup Analysis According to Associated Cartilage Procedures
The results of subgroup analysis according to cartilage procedures are listed in Table 4. Among the 39 patients who underwent multiple drilling at the medial femoral condyle, the majority (n = 28) were classified as having ICRS grade 4 cartilage. Among the 28 patients who did not undergo multiple drilling, ICRS grade 1 was the most common (n = 12), and ICRS grade 4 was the least common (n = 4). At both 3-month and 1-year follow-up, the SUVmax was significantly higher in group 1 versus group 2 in the femoral AM-A and PM-A zones. Among the 24 patients who underwent abrasion chondroplasty of the medial tibial plateau, ICRS grade 4 was the most common (n = 16), and among the 43 patients who did not undergo this procedure, ICRS grade 1 was the most common (n = 24). At 1 year postoperatively, the SUVmax was significantly higher in group 1 versus group 2 in the tibial AM-A and PM-A zones (P = .002 and P = .001, respectively).
Subgroup Analysis of SUVmax According to Associated Cartilage Procedures a

a Boldface P values indicate statistically significant differences between groups (P < .05). Group 1 = patients who underwent the associated procedure; group 2 = patients who did not undergo the associated procedure. AM-A, anteromedial articular; MFC, medial femoral condyle; MTP, medial tibial plateau; PM-A, posteromedial articular; SUVmax, maximum standardized uptake value.
Subgroup Analysis According to WBLR
The results of subgroup analysis according to the WBLR are summarized in Table 5. The SUVmax was significantly higher in the upper quartile group versus lower quartile group in the tibial AL-A zone (P = .048) and the femoral AL-A and PL-A zones (P = .008 and P = .017, respectively) (Table 4). Figure 5 illustrates an increase in the signal in the femoral AL-A and PL-A zones at 1-year follow-up in a patient with overcorrection.
Subgroup Analysis of SUVmax According to WBLR a

a Boldface P values indicate statistically significant differences between groups (P < .05). AL-A, anterolateral articular; AM-A, anteromedial articular; PL-A, posterolateral articular; PM-A, posteromedial articular; SUVmax, maximum standardized uptake value; WBLR, weightbearing line ratio.

Serial assessment of single-photon emission computed tomography and conventional computed tomography images of a patient with slight overcorrection. (A) The baseline signal on the medial articular side was increased. (B) Analysis at 3 months postoperatively showed that the change in the signal on the hinge side was increased. (C) Analysis at 1 year postoperatively showed that the signal on the medial opening gap side was increased and that the signal on the femoral lateral articular side was particularly increased. The dashed white line indicates the cutting line of the femoral articular side.
Discussion
The principal findings of this study were as follows: the SUVmax in both the medial and the lateral compartments increased at 3 months and decreased at 1 year compared with the baseline value. In particular, the femoral medial zones (AM-A and PM-A) showed a reduced SUVmax compared with the baseline value at 1 year postoperatively (P < .041 and P < .048, respectively). In the patella, the SUVmax in both the medial and the lateral zones (M-A and L-A) decreased at 1 year postoperatively compared with baseline values (P < .001 for both). In the correlation with radiological factors, the SUVmax in the femoral lateral zones (AL-A and PL-A) was greater with a higher preoperative WBLR. In the delta comparison, the ΔSUVmax in the femoral lateral zones (AL-A and PL-A) increased as the ΔWBLR increased. On subgroup analysis, a relatively high SUVmax was observed at 1 year when associated cartilage procedures were conducted in the medial zones (femoral AM-A and PM-A zones and tibial AM-A and PM-A zones). When the WBLR was overcorrected, the SUVmax in the femoral lateral zones (AL-A and PL-A) showed a high value up to 1 year postoperatively.
It is generally reported that the load applied to the medial compartment is increased in OA of the medial compartment. 2,27 MOW-HTO has been known to reduce loads on the medial zone by inducing a lateral shift of the WBL. 27 In this study, the SUVmax of the femoral medial zones decreased significantly compared with the initial state after MOW-HTO. However, in the case of tibial medial zones, the SUVmax returned to a value similar to the initial state, with no significant difference. This may need to be confirmed by extending the follow-up period to determine whether this decreasing tendency is maintained after 1 year. It has been reported that an increase in loading on the lateral zone occurs after HTO. 11,27 However, according to the results of the present study, the SUVmax of the femoral AL-A zone at 1 year decreased compared with the initial state, and the other lateral zones also showed a similar value of SUVmax to the initial state. Several studies have reported that MOW-HTO may induce patella infera and cause arthritis in the patellofemoral joint. 10,14 However, Kim et al 12 reported that there was no adverse effect on the patellofemoral joint, despite the possibility of patella infera. In this study, the patella showed a reduced SUVmax in both the medial and lateral zones compared with the initial state, indicating that MOW-HTO did not increase the load on the patellofemoral joint.
In a meta-analysis of changes in the PTS after MOW-HTO, it was reported that the PTS increased postoperatively. 23 In general, when the PTS was increased, loading on the tibial posterior articular surface increased. 7,24 In this study, we confirmed that the ΔSUVmax of the tibial PL-A zone increased as the ΔPTS increased, which was thought to be a result of the increased slope and lateral shift of the WBL. MOW-HTO, which requires a large amount of correction, often results in nonanatomic joint line obliquity. This may induce several problems, such as increased shear force. 8,22 Babis et al 3 reported that anatomic or mechanical axis overcorrection after HTO could increase joint pressure. In this study, a significantly higher SUVmax in the femoral AL-A and PL-A zones was observed at 1 year postoperatively in the upper quartile group.
Limitations
This study has several limitations. First, bone marrow lesions could not be identified in the preoperative state. Preoperative and immediately postoperative magnetic resonance imaging could not be examined together because of cost concerns. Second, we could not accurately reflect the interval of each change, as we did not perform a continuous evaluation postoperatively. However, this may be meaningful on serial analysis. Third, some questions remain, as stated in the Discussion section, and bias may occur in the process of analyzing together patients with and without cartilage procedures. Therefore, further serial follow-up is required to confirm the remaining questions. Finally, while SPECT/CT reflects bone metabolism, it could be sensitive to the effects of other artifacts.
Conclusion
After MOW-HTO, the unloading effect in the AM-A zone of the femur was the most significant. A greater SUVmax in the femoral lateral zones was observed in cases of overcorrection. The SUVmax in the medial zones was increased postoperatively in patients with an associated cartilage procedure.
Footnotes
Final revision submitted October 31, 2022; accepted December 13, 2022.
One or more of the authors has declared the following potential conflict of interest or source of funding: This work was supported by the National Research Foundation of Korea (grant 2021R1A2C1092657). AOSSM checks author disclosures against the Open Payments Database (OPD). AOSSM has not conducted an independent investigation on the OPD and disclaims any liability or responsibility relating thereto.
Ethical approval for this study was obtained from Seoul National University Bundang Hospital (B-2112-725-104).