
Abstract
Background:
Recovery from shoulder arthroscopy may vary between professional pitchers and position players in Major League Baseball (MLB). The time that it takes to return to play (RTP) and the level of skills to be regained after surgery are important factors for an athlete to consider when making career decisions.
Purpose:
To identify MLB players who had arthroscopic shoulder surgery and observe their rates of RTP to MLB and the minor league, as well as to compare pre- and postinjury performance statistics and career metrics.
Study Design:
Descriptive epidemiology study.
Methods:
Public records (press releases, http://www.prosportstransactions.com, http://www.baseball-reference.com) were searched and analyzed to determine the number of days from shoulder arthroscopy to RTP and pre- and postinjury statistics for pitchers and position players in the MLB and minor league from 1998 to 2018. To meet inclusion criteria, a player must have undergone shoulder arthroscopy after having played at least 1 game in the MLB and had no identifiable concomitant injuries.
Results:
Of 134 players, 89 (66.4%) returned to MLB. Fifty-four of 89 pitchers (60.7%) and 35 of 45 position players (77.8%) returned to MLB (P = .048). Forty-nine of 54 pitchers (90.7%) and 23 of 35 position players (65.7%) who returned to MLB returned to the minor league first. The mean time to RTP was 469.6 days (range, 100-1079 days) for pitchers and 301.6 days (range, 94-1488) for position players (P = .002). The WAR statistic (wins above replacement) for the pitchers decreased significantly (P = .004) after shoulder arthroscopy.
Conclusion:
MLB position players returned to play at higher rates and more quickly than did pitchers. The WAR statistic declined in pitchers during the first season of RTP. Players undergoing arthroscopic shoulder surgery should be aware of these possible outcomes in time to RTP and postoperative performance.
Major League Baseball (MLB) players are at high risk for sustaining upper extremity injuries, but pitchers are at higher risk than position players. 4 The mechanics and frequency of throwing between pitchers and position players could account for the difference in rates of injury. The complex series of movements that compose the overhead pitching motion subject the pitcher’s shoulder to extreme forces. 12 While the glenohumeral joint provides the greatest range of motion of any joint in the human body, its integrity is reliant on static and dynamic stabilizers. 12 Repetitive overhead throwing can cause adaptive and/or pathologic changes to structures within the glenohumeral joint, which may require surgical intervention, particularly for elite throwers. 12 Many mechanical factors can also affect the rate of injury for pitchers, such as increased elbow flexion at ball release, high pitch velocity, and pitcher fatigue. 2 Fares et al 5 explored patterns and trends of upper extremity injuries in MLB players. The authors found that the shoulder was the most likely location for injury and that pitchers had a significantly higher mean incidence rate of injury than fielders and catchers for shoulder injuries. 5 In 2014, Wilk et al 14 also observed a higher injury incidence in pitchers when compared with fielders and a longer placement on the disabled list.
Several studies have observed differences among pitchers and position players regarding time to return to play (RTP) and postprocedure performance after a single type of shoulder procedure was performed. Park et al 13 found a higher rate of RTP after Bankart repair for positions other than pitchers across multiple levels of player expertise (high school, college, and professional). Chalmers et al 1 evaluated the RTP rates of professional baseball players after biceps tenodesis and reported 80% among position players and 17% among pitchers, with no significant change in performance for pitchers who returned. Gilliam et al 7 identified patients from 2 centers who were high school, college, or professional baseball players who had undergone SLAP repair (superior labrum anterior to posterior), but they did not find statistically significant differences in RTP rates between pitchers and position players. Douglas et al 3 observed no significant differences of RTP between pitchers and position players but did show lower return to prior performance with each position after isolated SLAP repair. At the professional level, Fedoriw et al 6 noted higher rates of RTP and return to prior performance after SLAP repair for position players than for pitchers.
RTP after shoulder arthroscopy and performance after RTP were assessed across multiple professional athletic associations in a study by Higgins et al, 9 with MLB players showing a significantly lower return rate and longer recovery time than athletes in other sports. However, Higgins et al acknowledged that their MLB cohort comprised more pitchers than position players and that the RTP of MLB players could differ if broken down into pitchers and position players. The purpose of this study was to determine the rate of RTP for pitchers and position players in MLB and Minor League Baseball (MiLB) who had undergone shoulder arthroscopy. Additionally, we sought to compare pre- and postinjury performance statistics and career metrics. We hypothesized that pitchers would have a longer time to RTP and a larger performance decline after shoulder arthroscopy when compared with position players.
Methods
Data Collection
MLB players who underwent shoulder arthroscopy between January 1, 1998, and December 31, 2018, were identified by filtering for movement to and from the disabled list on the prosportstransactions.com database. Each shoulder injury was searched independently and confirmed with another source, most often a team or individual press release, to verify surgery type and date. A previous study 9 used and validated this method. This study did not require institutional review board approval because data were collected from publicly accessible sources (http://www.prosportstransactions.com, http://www.baseball-reference.com).
To meet inclusion criteria, a player must have undergone arthroscopic shoulder surgery after playing at least 1 game in MLB and have no identifiable concomitant injuries. Confirmation of shoulder surgery and date of procedure by 2 independent sources were also required for inclusion. Players were excluded if they had shoulder arthroscopy before playing in MLB, had a procedure described as “open shoulder surgery” or revision surgery, had concomitant injuries that required surgery (including but not limited to elbow and knee surgery), or had a profile that showed unclear information (including unclear procedure or injury and contradictory information to other sources).
The following data were collected from baseball-reference.com: the demographics of each player, the position played, the number of seasons in MLB before and after surgery, the age at the time of injury, and the player’s height and weight. Body mass index was calculated from weight and height. The dates of surgery and RTP to MLB were recorded, and the days to RTP from surgery were calculated. The date of RTP to MLB was defined as the date of the first game played in MLB after undergoing shoulder arthroscopy. MLB performance metrics 1 season before surgery and 2 seasons after surgery were recorded to provide a comparison for before and after surgery.
Statistics collected for all players included the number of games played and WAR score (wins above replacement). The WAR score evaluates a player’s value in all aspects of the game by determining how many more wins he is worth than the number of wins that a replacement-level player at his same position would be worth (eg, a minor league replacement or a fill-in free agent). WAR scores factor in a positional adjustment, which makes it well suited to compare players who specialize in different defensive positions. 11 For pitchers only, WHIP scores were collected: WHIP is the sum of a pitcher’s walks plus hits, divided by total innings pitched. This is one of the most used statistics for evaluating a pitcher’s performance, namely how well the pitcher keeps runners off the bases. 11 For position players only, on-base plus slugging (OPS) was collected. OPS scores demonstrate how well a hitter can reach a base by combining his on-base percentage and slugging percentage into 1 number. 11 Study methodology and statistical analysis were based on a study by Higgins et al 9 that evaluated RTP after shoulder arthroscopy across multiple professional sports.
Return to MiLB was assessed by checking the baseball-reference.com website. When a player’s return to MiLB and return to MLB were within the same season, it was necessary to confirm if the player began the season in MiLB or MLB. To determine this, a search of the player on prosportstransactions.com or other press releases revealed dates of transition into MiLB teams and dates of recall to MLB. The number of seasons playing in MiLB before returning to MLB or until career end was recorded. Statistics were recorded for the first season of play in MiLB after surgery for players who returned to the MiLB before MLB. The statistics recorded for the MiLB were the same as for MLB and were sourced from the same website.
Data Analysis
Baseline performance was defined as the season immediately preceding injury. The first postoperative season was defined as the first season played in MLB after surgery, and the second postoperative season was defined as the second season played in MLB after surgery. For players who returned to the minor league first, the first postoperative season was defined as the first season played in MiLB after surgery. Performance was analyzed only for players who returned to MLB or MiLB after surgery.
Statistical Analysis
Rates of return to MLB and MiLB, as well as the rate that injuries were on the same side that a player bats or throws, were summarized with counts and percentages, and significant differences for these variables were assessed using chi-square tests. All other quantitative measures are reported as sample sizes, means, and standard errors. Comparisons between pitchers and position players for mean days to return to MLB, seasons played postprocedure, and seasons played in the minor league postprocedure were made using 2-sample t tests for independent samples. Performance differences after surgery are presented as mean change in number of games played, WAR, WHIP, and OPS from pre- to postsurgery and assessed for statistical significance separately for pitchers and position players using paired t tests. P values are reported for all tests and assessed for significance at the 5% level. All analyses were performed using SAS Version 9.4 (SAS Institute).
Results
A total of 134 MLB players met inclusion criteria: 89 pitchers (66.4%) and 45 position players (33.6%). Pitchers’ injuries were most often on the dominant throwing arm (P < .0001). Of 54 pitchers who throw with the right arm, 52 (96.3%) were injured on the right, while only 2 (3.7%) were injured on the left. Of 29 pitchers who throw with the left arm, 27 (93.1%) were injured on the left, while just 2 (6.9%) were injured on the right. No significant relationship was found between the side that a position player bats and the side that was injured.
RTP and Career Length in MLB
Of 89 pitchers, 54 (60.7%) returned to MLB, while 35 of 45 position players returned (77.8%; P = .0477). Of these players, 49 pitchers (90.7%) and 23 position players (65.7%) returned to MiLB before returning to MLB. The mean number of days to RTP was 469.6 for pitchers (range, 100-1079) and 301.6 for position players (range, 94-1488; P = .0024). There was no significant difference in the number of seasons played in MLB after RTP between pitchers (3.6 seasons) and position players (4.0 seasons; P = .44).
Performance of Players Who Returned to MLB
During the first season of play after shoulder arthroscopy, as compared with the last season played before surgery, the following was observed: pitchers played on average 9.85 fewer games (P = .009), while position players played 22.9 fewer games (P = .0088) (Table 1). WAR scores decreased by 0.718 for pitchers (P = .0038) and did not significantly change for position players. Neither WHIP scores to evaluate pitchers nor OPS scores to evaluate position players showed a significant performance change. No significant differences were found in any of these measures between the second season of MLB play after shoulder arthroscopy and the last season played before surgery.
Games Played and WAR, WHIP, and OPS Scores Before Injury and After Return to Play a

a Data are reported as mean (SE) unless otherwise indicated. OPS, on-base plus slugging; S0, season before injury; S1, season after surgery; WAR, wins above replacement; WHIP, walks and hits per inning pitched.
b Bold P values indicate statistically significant difference between seasons (P < .05, paired t test).
RTP and Career Length in MiLB
Of the 54 pitchers who returned to MLB, 49 first returned to MiLB (90.7% of pitchers who returned to MLB and 55.1% of all included pitchers). Of the 35 position players who returned to MLB, 23 first returned to MiLB (65.7% of returned position players and 51.1% of all included position players). Only 17 players returned directly to MLB: 5 pitchers (9.25% of pitchers who returned to MLB and 5.62% of all included pitchers) and 12 position players (34.3% of returned position players and 26.7% of all included position players).
Twenty-three pitchers (25.8%) and 7 position players (15.6%) did not return to MLB but did return to MiLB. Twelve pitchers (13.5%) and 3 position players (6.7%) did not return to MLB or MiLB (Table 2). While pitchers played a mean 1.35 seasons (range, 1-4) and position players 1.23 seasons (range, 1-4) after return from surgery, the difference was not significant (P = .42).
Pitchers and Position Players Who Returned to MiLB and MLB Play a

a Data are reported as No. (%). MiLB, Minor League Baseball; MLB, Major League Baseball.
Performance of Players Who Returned to MiLB
Pitchers who returned to MiLB played on average 17.9 fewer games (range, 25 more games in MiLB to 82 fewer games) than they played in the season preceding injury in MLB (P < .0001), while position players played on average 52.4 fewer games (range, 101 more games in MiLB to 150 fewer games; P = .0005). There was no significant change in pitchers’ WHIP scores or position players’ OPS scores in the first MiLB season as compared with the injury-preceding season in MLB (Table 3).
Performance Scores in MLB Preoperatively vs First MiLB Season Returned After Surgery a
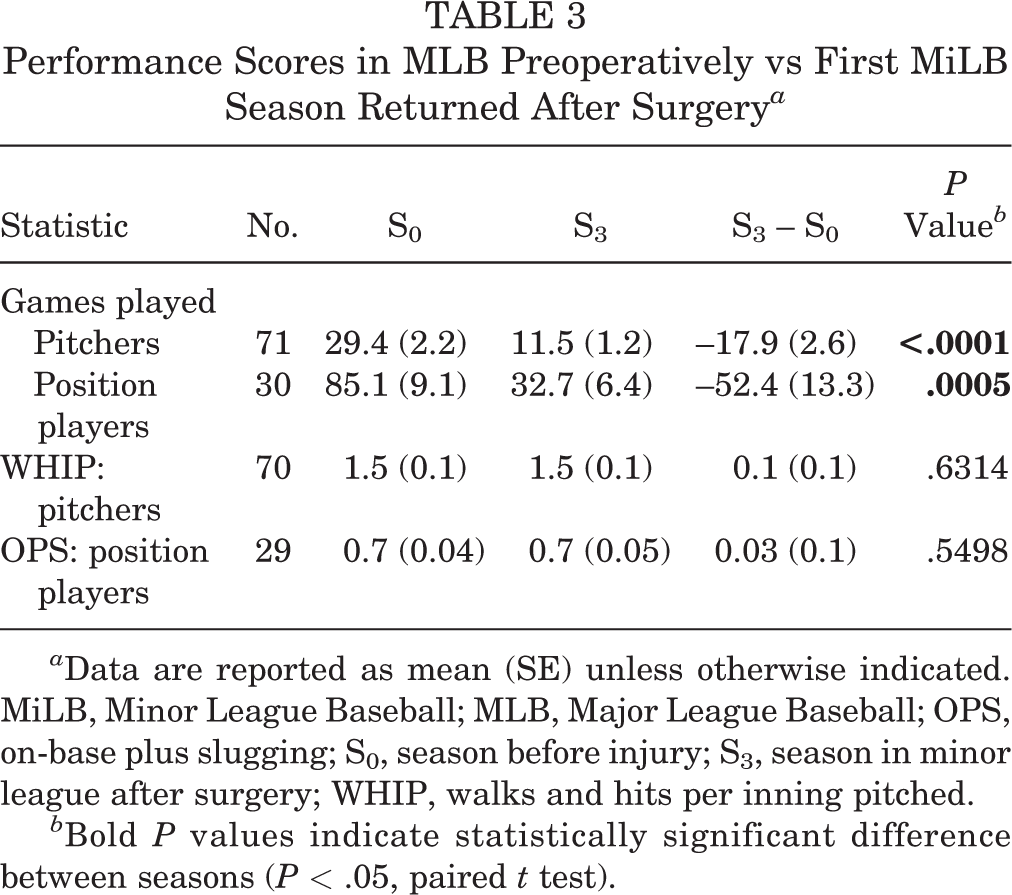
a Data are reported as mean (SE) unless otherwise indicated. MiLB, Minor League Baseball; MLB, Major League Baseball; OPS, on-base plus slugging; S0, season before injury; S3, season in minor league after surgery; WHIP, walks and hits per inning pitched.
b Bold P values indicate statistically significant difference between seasons (P < .05, paired t test).
Performance of Players Who Returned to MiLB Before Returning to MLB
For players who returned to MiLB before returning to MLB, the following was observed: Pitchers played on average 7.69 fewer games in MiLB (range, 25 more games in MiLB to 55 fewer games) than when they returned to MLB (P = .016). Position players played on average 31.2 fewer games in MiLB (range, 88 more games in MiLB to 141 fewer games) than when they returned to MLB (P = .0279). Pitchers’ WHIP scores were on average 0.212 points lower in MiLB than when they returned to MLB, indicating better performance in the minor league than major league (P = .0184). No significant difference was found in position players’ OPS scores in the minor league and first season back in the major league (Table 4).
Performance Scores in the First MiLB Season After Surgery and Subsequent MLB Season a
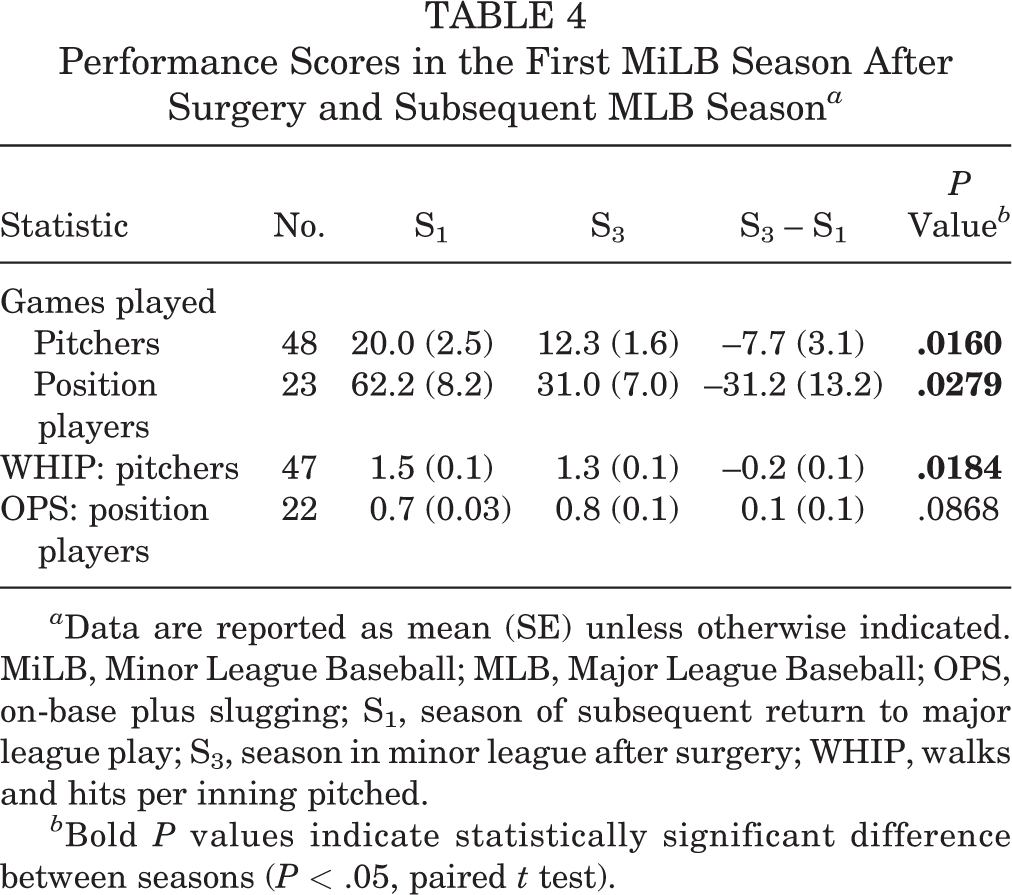
a Data are reported as mean (SE) unless otherwise indicated. MiLB, Minor League Baseball; MLB, Major League Baseball; OPS, on-base plus slugging; S1, season of subsequent return to major league play; S3, season in minor league after surgery; WHIP, walks and hits per inning pitched.
b Bold P values indicate statistically significant difference between seasons (P < .05, paired t test).
Discussion
This study revealed that MLB position players returned to play in MLB more often and with fewer days to RTP than MLB pitchers after shoulder arthroscopy. Performance as measured by WAR score decreased during the first season returned to MLB for pitchers only. As compared with the position player cohort, a larger percentage of the pitcher cohort returned to MiLB before MLB, returned to minor league only, or did not return to professional play. Performance metrics did not significantly change for players in the minor league after surgery, but pitchers’ performance as measured by WHIP score was better during their time in MiLB as compared with when they returned to MLB.
Position players have been shown to RTP at higher rates than pitchers when compared in other studies. One such study evaluated RTP after biceps tenodesis by Chalmers et al, 1 with RTP among professional baseball players being 80% for position players and 17% for pitchers. Park et al 13 observed a longer time to RTP for pitchers than catchers and in-fielders after arthroscopic Bankart repair. Our results showed that many players of all positions returned to MiLB before returning to MLB, and a higher percentage of pitchers who eventually returned to MLB returned to the MiLB first as compared with position players. This trend could be attributed to a rehabilitation period for pitchers to regain skills. Pitchers’ longer time to RTP vs position players could also be partly due to this return to minor league before major league play.
There were no significant changes in performance from the season preceding injury and the first season played in MLB after shoulder arthroscopy when using position-specific metrics such as WHIP and OPS for pitchers and position players, respectively. WAR scores, which are calculated for all MLB players, were significantly lower for pitchers during the first season after undergoing shoulder arthroscopy. A WAR score demonstrates a player’s value by comparing how many more wins he would be worth than a replacement-level player at his same position. Both performance findings are in line with prior research. Higgins et al 9 found no significant performance declines for MLB players after surgery, while Fedoriw et al 6 reported that rates of return to prior performance after SLAP repair were higher for position players than pitchers according to earned run average and WHIP scores. In a systematic review, Harris et al 8 concluded that performance of elite pitchers decreased before surgery and gradually improved postoperatively without reaching preinjury levels. In a retrospective review, Kercher et al 10 included athletes from high school to the professional level and observed a lower return to previous level of play for pitchers than position players. A possible explanation for why our study did not observe a significant change in performance by the position-specific metrics of OPS/WHIP could be that performance had also generally declined in the season preceding surgery attributed to injury. The type of injury sustained by the athlete and subsequent surgery performed both contribute to the likelihood of returning to prior performance levels. The most common indications for surgery, when found, included grade 3 latissimus dorsi strains, acromioclavicular joint separation, impingement, and subluxation. However, more players in our study had an unknown indication for surgery than any of the aforementioned injuries, which prevented meaningful correlation between injury or surgery and outcomes.
During the first season after shoulder arthroscopy, pitchers and position players had a decrease in the number of games played, whether in MLB or MiLB. Pitchers played on average 9.85 fewer games (P = .0009) and position players 22.9 fewer games (P = .0088). This is similar to what Park et al 13 reported in their evaluation of RTP in players who played in at least 1 game but <10 games (RTP) or >10 games (solidly returned to play) upon returning after surgery. In their study, pitchers were the only players who had a difference in these percentages (60% RTP and 57% solidly returned to play). The finding in this study that pitchers and position players played fewer games upon RTP could be influenced by the point in the season during which a player returned, allowing for fewer possible games the later in the season that they returned.
Additionally, there were no significant performance changes identified in this study among all players who returned to MiLB as compared with their performance in MLB before surgery. Of players who returned to MLB after an initial return to MiLB, pitchers had lower WHIP scores (ie, better) in the minor league than they did upon returning to major league play, while no performance differences were seen in position players. Both findings might be explained by the lower level of skill held by the other athletes in MiLB vs those in MLB, as performance statistics can be influenced by the performance of opposing athletes as well as the skills of the athlete in question.
Limitations
This study has several limitations. Given the lack of an official MLB or MiLB database, it is possible that not all players who might have met inclusion criteria were included in the study. The method of confirming injury/surgery with a secondary source could present a selection bias for more popular or high-performing players. The degree of shoulder injury and prior injuries that might not have been identified could have affected RTP and subsequent performance. The type of surgery required to treat various player/pitcher injuries also likely influenced RTP. For example, a debridement would yield a much quicker recovery than a SLAP repair. Surgery performed could vary by position. However, reliable data on the specific injury and subsequent surgery performed were not available for each player using the methods described here. Differences in surgeon, surgical technique, and skill, as well as differences in postoperative rehabilitation, could additionally affect recovery and RTP. The nature of MLB trades and roster changes could also affect differences in the number of games played and therefore the average of performance statistics. The evaluation of return to preinjury performance levels could be overestimated because just 1 preoperative season was used as a baseline for the athlete’s healthy performance. Additionally, RTP date was calculated as the first game played after surgery; however, medical clearance could have happened during the off-season, which would exaggerate the days to RTP for some players.
Conclusion
MLB position players returned to play at higher rates and more quickly than pitchers. WAR score evaluation showed a decline in pitcher performance during the first season in MLB after shoulder arthroscopy. Players undergoing arthroscopic shoulder surgery should be aware of these possible outcomes in time to RTP and postoperative performance.
Footnotes
Final revision submitted September 15, 2022; accepted October 26, 2022.
One or more of the authors has declared the following potential conflict of interest or source of funding: M.K.M. has received education payments from Alon Medical Technology, Arthrex, and Quest Medical and nonconsulting fees from Arthrex. AOSSM checks author disclosures against the Open Payments Database (OPD). AOSSM has not conducted an independent investigation on the OPD and disclaims any liability or responsibility relating thereto.
Ethical approval was not sought for the present study.