
Abstract
Background:
Ulnar collateral ligament (UCL) reconstruction has received a unique level of attention in the press and social media. There has also been an increasing use of the internet by patients to seek medical information. Concern exists regarding the quality and comprehensibility of online information when used for patient education.
Purpose:
To evaluate the quality and comprehensibility of the most-viewed YouTube videos related to the diagnosis and management of UCL injuries. Based on our new evidence-based scoring rubrics, we hypothesized that the quality and comprehensibility of these videos would be poor.
Study Design:
Cross-sectional study.
Methods:
The YouTube platform was searched on September 7, 2021, with the terms “UCL injury,” “ulnar collateral ligament injury,” “UCL surgery,” “ulnar collateral ligament surgery,” and “Tommy John surgery,” and the 50 most-viewed videos from each search were compiled, yielding 250 videos. After removal of duplicates and application of exclusion criteria, the 100 most-viewed videos remained. Basic attributes, including duration of video and number of views, were recorded. Each video was then analyzed by 2 independent reviewers and evaluated for 4 key parameters (quality of diagnostic content [QAR-D], quality of treatment content [QAR-T], presence of inaccurate information, and comprehensibility) and graded on a novel scale from 1 to 4 (4 being the most appropriate for patient education).
Results:
The mean QAR-D was 4.83 ± 3.41 (fair quality), and the mean QAR-T was 2.76 ± 3.26 (poor quality). Physician-led educational videos had both the highest mean QAR-D (6.37) and the highest mean QAR-T (4.34). No correlation was observed between video quality and views/likes. A total of 12 videos included ≥1 inaccuracy. The mean comprehensibility score was 2.66 ± 1.12, with 39 videos falling below the acceptable comprehensibility threshold (score <3).
Conclusion:
The overall quality of UCL injury–related YouTube content was low. In addition, the absence of correlation between video quality and views/likes suggests that patients are not preferentially utilizing the limited high-quality content that does exist on the YouTube platform. In addition, inaccurate videos were prevalent (12%), and almost half of all videos were deemed inappropriate for patient education in terms of comprehensibility, as defined by our comprehensibility parameter.
The ulnar collateral ligament (UCL) is a 3-part ligamentous complex in the medial elbow that serves as the primary restraint to valgus stress of the elbow. 25,32 Consequently, the integrity of this ligament is of particular importance to overhead athletes whose motion relies on a stable complex to throw a baseball, javelin, or discus, for example. Injury to the UCL can occur acutely as a traumatic rupture from an excessive valgus load or gradually over time from repetitive valgus stress resulting in attenuation of the ligamentous complex, as is seen in proportionally larger numbers in overhead athletes. 43 Once considered a relatively uncommon injury, UCL tears have become increasingly prevalent over the past few decades. 16,23,27 This phenomenon is likely the result of numerous factors including an overall rise in the popularity of throwing sports, early sports specialization, increased participation on club teams, and year-round play, as well as greater throwing velocity and higher pitch counts observed among young (age, 6-18 years) baseball players between youth and high school levels. 5,19,24,38,39,43 A recent epidemiological study conducted in New York state, for instance, found that UCL reconstruction (UCLR) volume increased 193% between 2002 and 2011. 23 Among professional baseball pitchers, the prevalence of UCLR has been shown to be as high as 20%, further exemplifying the significant burden of UCL injury. 11,27
As the prevalence of UCL injuries has increased, UCLR has received a unique level of attention in the press and social media, often referred to as “Tommy John surgery” in reference to the first baseball player to undergo the procedure. 1,12 Between August 2016 and August 2019, 3118 posts related to UCL injury and UCLR were made on the Instagram social media platform. 54 The posts came from a wide variety of sources including patients, physicians, news outlets, professional organizations, and sports fans, and the number of posts per year increased by 39% over the 3-year study period. Unfortunately, the increased social awareness of UCL injuries has been accompanied by widespread misconceptions regarding UCLR, with up to 25% of media professionals believing performance enhancement was the primary indication for UCLR. 12
The utilization of social media platforms to discuss medical conditions is representative of a larger phenomenon in which patients are increasingly utilizing medical information available on the internet to learn about and make decisions regarding their health. An analysis from 2012 found that 59% of all US adults had searched the internet for medical information in the previous year alone. 37 Furthermore, 35% of all US adults attempted to make a medical diagnosis or treatment decision using information obtained on the internet. While there are certainly many potential benefits that accompany the widespread availability and accessibility of medical information on the internet, including patient empowerment and increased shared decision making, the overall utility of medical information on the internet is largely contingent upon the quality of information. 21,46 Interestingly, a survey of 1050 US physicians revealed widespread concern over the prospect of patients accessing and utilizing inaccurate medical information on the internet. 33
In addition to the accuracy of patient-oriented medical information on the internet, another important attribute to consider is comprehensibility. 53 With regard to orthopaedic conditions, several studies have shown that, even when online information is deemed accurate, the readability often exceeds the recommended sixth-grade level. 14,31,41,42,53 This observation may explain, at least in part, the increasing availability and utilization of online videos as a source of medical information for patients. 29 However, the potential for increased comprehensibility offered by videos does not preclude inaccuracy. A recent systematic review 30 assessing the accuracy of medical information on YouTube, the largest online video repository platform in the world, found that upward of 20% to 30% of videos analyzed in their included studies contained misleading information and also demonstrated relatively low variation between the mean view counts of accurate and inaccurate videos. 44
Given the widespread use of YouTube and other online video platforms by patients to obtain medical information, it is critical for providers to be aware of the overall quality of information currently available on such platforms. This is especially true for a condition such as UCL injury, which is increasing in prevalence, has received significant attention in the media, and is associated with several widely held misconceptions. Accordingly, the purpose of this review was to evaluate the quality and comprehensibility of the most-viewed YouTube videos related to the diagnosis and management of UCL injuries. We hypothesized that, based on our new evidence-based scoring rubrics, the quality and comprehensibility of the most-viewed YouTube videos related to UCL injuries would be poor.
Methods
Search Methodology
The YouTube platform was searched on September 7, 2021, to compile a list of the most-viewed videos related to UCL injury and management uploaded in the previous 10 years. Five independent search queries were performed using the following terms: “UCL injury,” “ulnar collateral ligament injury,” “UCL surgery,” “ulnar collateral ligament surgery,” and “Tommy John surgery.” The following exclusion criteria were utilized: videos not related to UCL injury of the elbow (or <50% of the video duration related to UCL injury), videos containing only footage of actual UCL injuries occurring, duplicate videos, videos without audio or explanatory text, videos in non-English languages, and videos posted before September 7, 2011. For each of the 5 queries, the 50 most-viewed videos were compiled. From this list of 250 videos, 123 duplicates were excluded, resulting in a list of the 127 videos. Of these, the 100 videos with the most views were identified for analysis and the remainder were added to a reserve list. An additional 5 videos (3 unrelated to UCL injury, 2 with no audio or text) were excluded during the video analysis phase; thus, the next 5 most-viewed videos from the reserve list were included for the final analysis (Figure 1).

Search methodology flowchart. UCL, ulnar collateral ligament.
Of note, videos deemed to be from a series were analyzed as a single video. Videos from a series were either in a YouTube playlist, were from the same producer and had identical titles followed by a colon with the video subtitle, were directly linked by the producer on each video page, or were clearly titled (part 1, part 2, etc). Videos could be from the same producer and not be considered part of a series if these qualifications were not met.
Video Characteristics
The 100 videos that met inclusion criteria were analyzed independently by 2 authors (C.R.C., A.G.). Basic attributes were recorded for each video, including duration, date uploaded, number of views, number of “likes,” number of “dislikes,” and video source. Average views per day, likes per 1000 views, average likes per day, and likes:dislikes ratio were calculated based on these data.
The 6 possible video source categories were “physician-led educational,” “other medical practitioner–led educational,” “nonmedical practitioner–led educational,” “surgical technique,” “patient testimonial,” and “news.” Physician-led educational videos were educational videos presented by a physician (MD or DO) and/or endorsed by a medical institution. Videos categorized as other medical practitioner–led educational were from a nonphysician medical practitioner, including but not limited to physical therapists, occupational therapists, athletic trainers, chiropractors, massage specialists, physician assistants, and nurse practitioners. Nonmedical practitioner–led educational videos were from nonmedical personnel such as students who did not meet the above qualifications, coaches, and sports fans. Surgical technique videos involved recordings of UCLR or repair procedures; these were often paired with audio of the operating surgeon. Patient testimonials involved patients describing their experiences with UCL injuries. If the patient was a medical professional or if a medical professional also provided information in the video, the video was classified in the appropriate educational category. Finally, news videos were uploaded by an official news or sports broadcast agency and did not include a physician interview.
Quality Assessment
The primary outcome measures in this analysis were quality assessment ratings (QARs) for diagnostic (QAR-D) and treatment (QAR-T) content. Scoring rubrics were created by the authors to evaluate quality of content in regard to thoroughness, accuracy, and appropriateness for patient education, in similar format to previous studies. 13,29 Details of the QAR-D and QAR-T scoring rubrics can be found in Table 1 and Table 2, respectively. Videos were assigned separate categorical scores for both diagnostic and treatment content: excellent (QAR = 13-16), high (10-12), moderate (7-9), fair (4-6), and poor (0-3) quality. Reviewer disagreement on quality scoring was reconciled via discussion and joint review of videos as needed.
QAR for Evaluation of UCL Injury-Related Videos: Diagnostic Content a

a CT, computed tomography; MRA, magnetic resonance arthrogram; MRI, magnetic resonance imaging; QAR, quality assessment rating; QAR-D, QAR for diagnostic content; UCL, ulnar collateral ligament.
b If any medically inaccurate statement or scientifically unproven data were included in a specific category, all points in that category were forfeited.
c Grading: 13-16, excellent quality; 10-12, high quality; 7-9, moderate quality; 4-6, fair quality; 0-3, poor quality.
QAR for Evaluation of UCL Injury-Related Videos: Treatment Content a

a QAR, quality assessment rating; QAR-T, QAR for treatment content; UCL, ulnar collateral ligament.
b If any medically inaccurate statement or scientifically unproven data were included in a specific category, all points in that category were forfeited.
c Grading: 13-16, excellent quality; 10-12, high quality; 7-9, moderate quality; 4-6, fair quality; 0-3, poor quality.
It is important to note that if any inaccurate or unfounded information was identified in a video related to a specific QAR item, a score of 0 was assigned for that item. Non–UCL related content, if present, was not evaluated for medical accuracy. The medical judgment of the authors and referencing of peer-reviewed literature was used to determine the accuracy of statements made in videos. The total number and proportion of videos with ≥1 inaccurate statement was also recorded.
Finally, a comprehensibility parameter was developed to evaluate the appropriateness of each video for patient education, much like “readability” parameters are applied to written materials. The comprehensibility scoring system and definitions for each specific score can be found in Table 3. A score of 3 or higher was defined as acceptable for patient education. An intraclass correlation coefficient between the scores of the 2 reviewing authors was calculated for this parameter.
Video Comprehensibility

Statistical Analysis
Categorical variables were reported as counts and continuous variables were reported as means with standard deviations and ranges. The Shapiro-Wilk test was performed to examine the distribution of individual variables for normality. The 1-way analysis of variance (ANOVA) test was used to compare means of continuous variables between groups. Bonferroni-adjusted pairwise t tests were performed for any significant differences found. The Fisher exact test was used to compare means of categorical variables between groups. The Pearson correlation coefficient was used to assess associations between 2 continuous variables. All analyses were performed with R Version 4.1.0 (R Foundation for Statistical Computation). Alpha level was set at < .05.
Results
A total of 100 videos were included in this analysis. Date of video upload ranged from October 28, 2011, to July 28, 2021. The mean duration of all videos was 6 minutes 31 seconds (range, 44 seconds to 43 minutes 31 seconds), the mean number of views was 28,218 (range, 582 to 487,053), and the mean number of likes was 195.66 (range, 0 to 3100). There was no statistically significant correlation between video duration and number of views (r = 0.07; P = .47). A summary of the top 10 most-viewed videos can be found in Appendix Table A1.
The mean QAR-D of all 100 videos was 4.83 ± 3.41 (fair quality), the median score was 4, and the range was 0 to 15 (Figure 2). The most commonly omitted item in QAR-D was “differential diagnosis” (92 videos failed to include). The mean QAR-T of all 100 videos was 2.76 ± 3.26 (poor quality), the median score was 2, and the range was 0 to 16 (Figure 2). Only 3 videos discussed “indications for UCL repair,” and only 4 videos described needing to “avoid valgus stress postoperatively.” A total of 12 videos included ≥1 inaccuracy. The mean comprehensibility score was 2.66 ± 1.12, with 39 videos falling below the acceptable comprehensibility threshold (ie, score <3). The intraclass correlation coefficient for comprehensibility scores was r = 0.82 (P < .01).
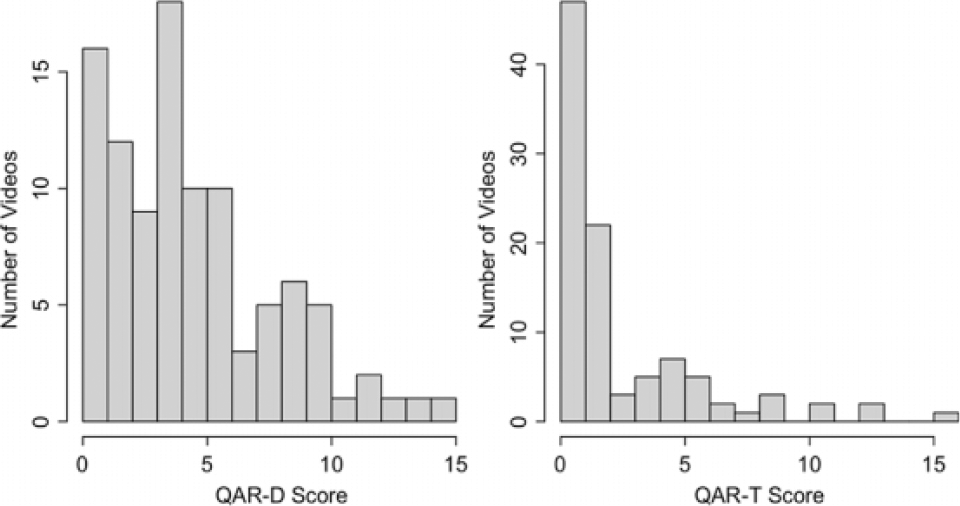
Distribution of QAR-D and QAR-T scores from the 100 most-viewed videos related to ulnar collateral ligament injury and management. QAR, quality assessment rating; QAR-D, QAR for diagnostic content; QAR-T, QAR for treatment content.
Analysis by QAR-D
Regarding QAR-D categories, 3 videos were of excellent quality, 8 were graded as high quality, 14 were moderate quality, 38 were fair quality, and 37 videos were poor quality. Videos with the highest QAR-D scores are highlighted in Appendix Table A2. After performing ANOVA tests for each of the basic video characteristics (eg, duration, views, likes), the only statistically significant difference between the 5 QAR-D groups was video duration (F = 5.45; P = .022) (Table 4). The QAR-D videos graded as excellent and high quality were the longest (mean duration 14 minutes and 6 seconds and 11 minutes and 9 seconds, respectively) and significantly differed in length from the lesser quality videos (P < .01). Duration was also the only video characteristic found to correlate positively with numerical QAR-D scores (r = 0.26; P < .01). Moderate-quality QAR-D videos garnered the highest mean views (62,246) and mean likes per 1000 views (10.22), although there were no statistically significant differences between the groups in either of these categories.
Video Evaluation by QAR-D Category a

aBoldface P value indicates statistically significant difference between quality groupings (P < .05). QAR, quality assessment rating; QAR-D, QAR for diagnostic content.
b Data are presented as mean ± SD or No. of overall videos.
c Data are presented as mean or No. of videos in that category (% of category total).
Each of the 5 QAR-D categories were also stratified by source (Table 4). All 3 excellent-quality QAR-D videos were either physician-led educational or other medical practitioner–led educational videos. The vast majority (24/29; 82.8%) of nonmedical practitioner–led educational, patient testimonial, and news videos fell within the QAR-D categories of fair quality or poor quality. The number of videos achieving each comprehensibility score (1 through 4) from each of the 5 QAR-D categories was also identified, but no statistically significant difference was found between the groups (Table 4).
Analysis by QAR-T
Regarding QAR-T categories, 3 videos were graded as excellent quality, 2 were high quality, 6 were moderate quality, 17 were fair quality, and 72 videos were poor quality. Videos with the highest QAR-T scores are highlighted in Appendix Table A3. Similar to the analysis of diagnostic content, the only statistically significant difference between the QAR-T groups from ANOVA testing of each video characteristic was video duration (F = 36.26; P < .01) (Table 5). Excellent-quality and high-quality QAR-T videos were significantly longer (mean duration 20 minutes 9 seconds and 23 minutes 21 seconds, respectively). There was also a positive correlation between numeric QAR-T scores and duration (r = 0.51; P < .01). Poor-quality QAR-T videos garnered the highest mean views (30,480), but there was no statistically significant difference between groups. Comparison of mean likes of combined poor- and fair-quality QAR-T videos (mean = 209.67) versus combined moderate-, high-, and excellent-quality QAR-T videos (mean = 82.27) revealed that the lower quality videos had significantly more likes (P = .039).
Video Evaluation by QAR-T Category a

a Boldface P value indicates statistically significant difference between quality groupings (P < .05). QAR, quality assessment rating; QAR-T, QAR for treatment content.
b Data are presented as mean ± SD or No. of overall videos.
c Data are presented as mean or No. of videos in that category (% of category total).
Each of the 5 QAR-T categories was also stratified by source (Table 5). All 5 high-to-excellent quality QAR-T videos were either physician-led educational or other medical practitioner–led educational videos. All but 1 (28/29; 96.6%) of the nonmedical practitioner–led educational, patient testimonial, and news videos fell within the QAR-T category of “fair” or “poor” quality. The QAR-T groups did not differ with regard to the relative proportions of each comprehensibility score (Table 5).
Analysis by Video Source
The most common video source was physician-led educational (n = 35) followed by other medical practitioner–led educational (n = 20), surgical technique (n = 16), nonmedical practitioner–led educational (n = 13), patient testimonial (n = 9), and news (n = 7) (Figure 3). ANOVA tests identified statistically significant differences between video source groups for both QAR-D and QAR-T scores (Table 6). Physician-led educational videos had both the highest mean QAR-D (6.37) and the highest mean QAR-T (4.34), and these means were significantly greater than the combined QAR-D and QAR-T means of the other 5 source categories (P < .01 and P < .01, respectively). While not statistically significant, physician-led educational videos had the lowest percentage of videos containing inaccuracies (2/35; 5.71%). Patient testimonial videos had the highest mean views (70,335) despite having the lowest mean QAR-D (2.33) and second lowest mean QAR-T (1.22), but none of these findings reached statistical significance. Technique videos demonstrated the lowest mean comprehensibility score (1.13) on ANOVA and confirmatory t testing (P < .01).

Video distribution by source of most-viewed videos related to ulnar collateral ligament injury.
Video Evaluation by Source a
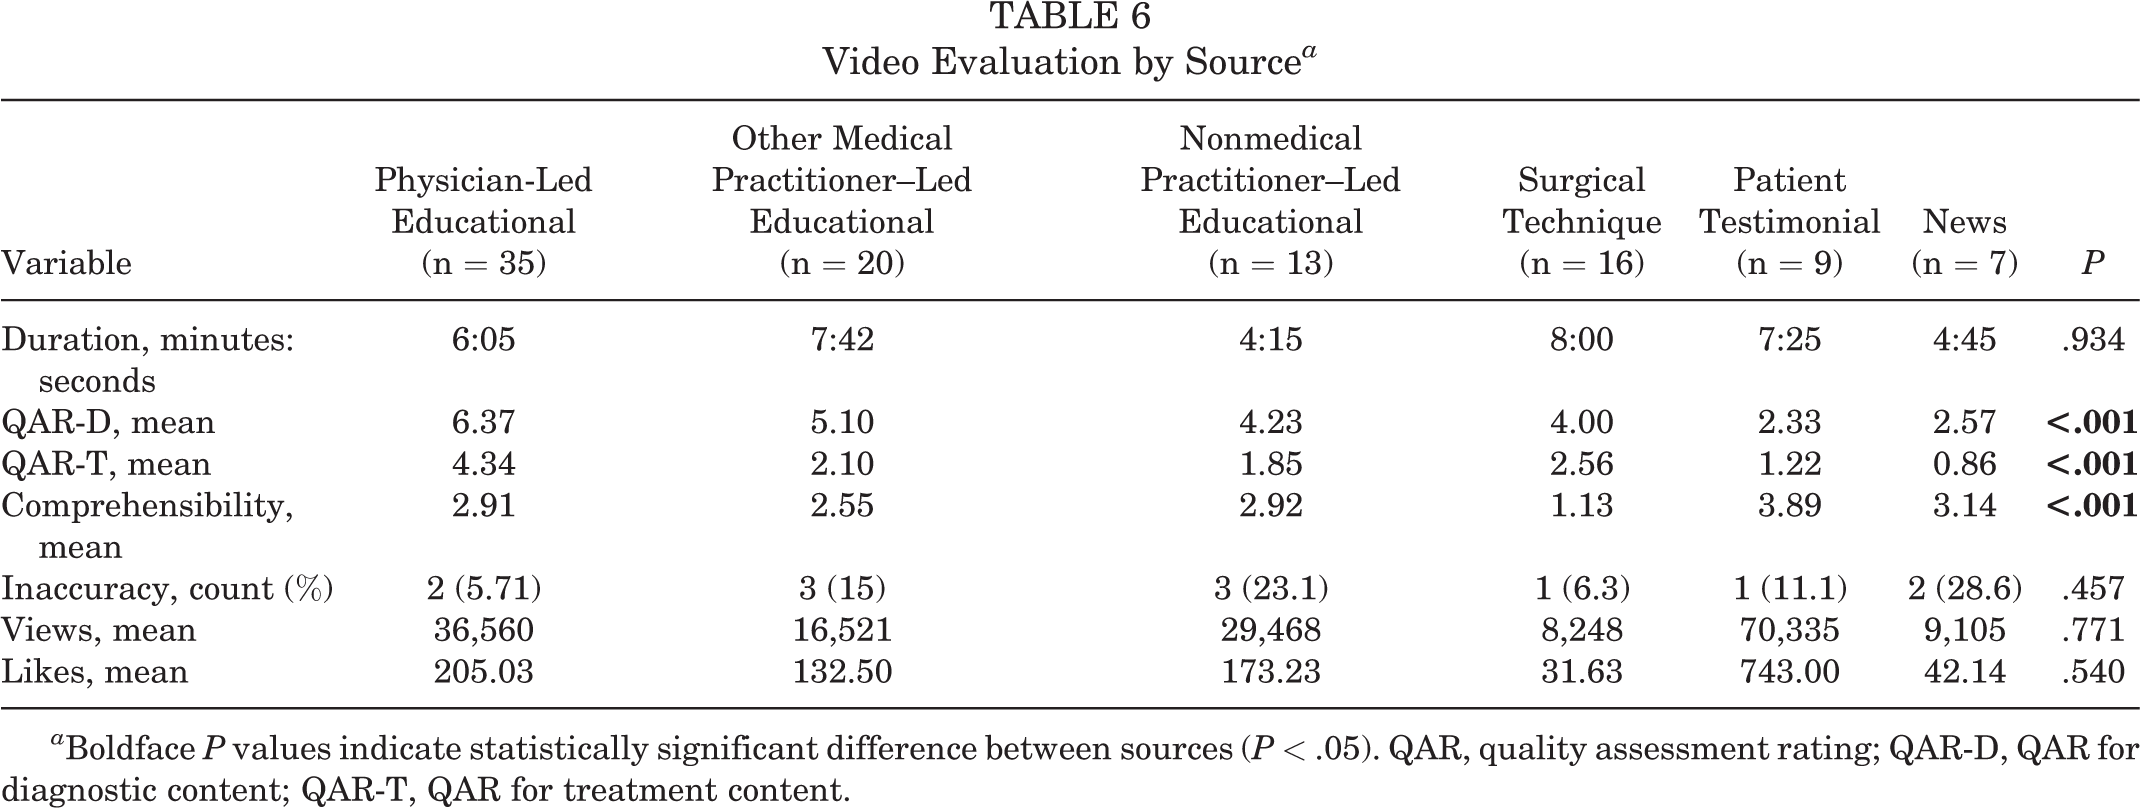
a Boldface P values indicate statistically significant difference between sources (P < .05). QAR, quality assessment rating; QAR-D, QAR for diagnostic content; QAR-T, QAR for treatment content.
Discussion
The purpose of this study was to evaluate the top 100 most-viewed YouTube videos related to UCL injury using 4 key parameters: QAR-D, QAR-T, presence of inaccurate information, and comprehensibility. Key statistically significant findings included the association between video quality and duration (P < .01 for both QAR-D and QAR-T) as well as the increased mean video quality scores (QAR-D, 6.37; QAR-T, 4.34) among physician-led educational videos (P < .01 for both). Also striking was the overall predominance of low-quality videos; 75 videos were of fair or poor quality for diagnostic content, 89 videos were of fair or poor quality for treatment content, and 12 videos included ≥1 inaccuracy. Similar findings have been reported by other studies evaluating online video content for numerous orthopaedic conditions. 2,3,8,9,13,17,29,49,52 In terms of comprehensibility, almost 40% (n = 39) of all videos were deemed inappropriate for patient education.
The only video attribute found to correlate significantly with video quality (both QAR-D and QAR-T scores) in the present study was video duration (r = 0.26, P < .01; and r = 0.51, P < .01, respectively). Videos scoring excellent in QAR-D averaged 14 minutes 6 seconds and videos scoring excellent in QAR-T averaged 20 minutes 9 seconds, while the overall mean duration was 6 minutes 31 seconds. This finding was somewhat expected, as the QAR-D and QAR-T scoring rubrics awarded points based on whether or not a video addressed critical aspects of the diagnosis and management of UCL injuries. As such, videos of longer duration would be expected to contain more content and therefore earn higher scores. Interestingly, video quality did not correlate with likes or views, perhaps because viewers of online content prefer brevity. In fact, previous research has revealed that viewership of online content exponentially decreases after the 6-minute mark. 18 Moving forward, developers of online patient education videos should aim to strike a balance between thoroughness and brevity, so as to present the essential information regarding a certain medical topic while maintaining viewer interest. In addition, future video quality analyses may consider incorporating brevity into the overall quality rating rubric.
Regarding the accuracy of YouTube content related to UCL injuries, the most commonly encountered inaccurate statement was that “throwing curveballs increases the risk of a UCL injury,” which was mentioned in 25% of videos containing an inaccuracy (3 out of 12). This statement is not supported by the current orthopaedic literature. Furthermore, Keller et al 26 have in fact demonstrated that a cohort of 83 Major League Baseball pitchers with history of UCLR pitched a higher rate of fastballs compared with matched controls (46.7% vs 39.4%; P = .035), with no difference in rate of curveballs (8.5% vs 8.2%; P = .88). Misconceptions regarding UCL injuries are numerous and widespread, particularly those about treatment and expected postoperative outcomes. A survey of 516 sportswriters, for instance, found that 45.5% either did not know or believed that no injury was necessary for players to benefit from UCLR. Such misinformation can greatly influence patients’ decision making and further supports the need for peer-reviewed patient education materials. 12
Interestingly, only 3 videos discussed indications for UCL repair (as opposed to UCL reconstruction) despite an abundance of recent research demonstrating considerable success with UCL repair when performed for the proper indications. 15,35,47,48 This finding could be representative of the lag between the publication of novel research in peer-reviewed journals and the incorporation of these findings into freely available online video content. As orthopaedic surgery continues to evolve as a field, there will be a continued need to produce updated online patient education materials so that patients can fully consider all available options.
Several readability studies conducted in the field of orthopaedics have demonstrated that patient education materials often require reading comprehension beyond the recommended sixth-grade level. 14,31,41,42,53 While several tools exist to assess comprehensibility of written patient education materials (eg, the Flesch Reading Ease Score, the Gunning fog index), most are automated text-evaluation systems that are incompatible with video content. 20 As such, a novel 4-point video comprehensibility scale was devised for this study and demonstrated good interrater reliability (r = 0.82; P < .01). This scale also addressed a major limitation of most readability studies, which often only evaluate the length of words and number of words per sentence, without considering the presence of medical jargon. 14,31,53 The mean comprehensibility of videos in the present analysis (2.66) was below the threshold score of 3 (ie, acceptable for patient education), suggesting that both the quality and the comprehensibility of UCL-related content on YouTube is inadequate (Table 3). Problematically, the video source with the highest mean quality scores (physician-led educational: QAR-D, 6.37 [P < .01]; QAR-T, 4.34 [P < .01]) had a mean comprehensibility score below the acceptable threshold (mean comprehensibility, 2.91) (Table 6).
As shared decision making gains wider acceptance and adoption, patient education will become more important than ever. Patients will increasingly turn to the internet as a source of medical information given the tremendous accessibility of online content. As such, it is imperative that patients have unrestricted access to high-quality, accurate, and comprehensible medical content. To this end, the medical community must strive to improve the quality of medical content on the internet and can accomplish this task through a variety of initiatives. Most obviously, medical experts must continue to create evidence-based content that reflects patient preferences in terms of format, content, and duration. Academic promotion committees could consider placing some degree of value to the development of such patient-targeted medical content, similar to what is currently done for the publication of peer-reviewed research. In addition, professional societies could serve as arbiters of online medical content, providing “kitemarks” or seals of approval for content that meets certain quality standards. 33
Limitations
This study is not without its limitations. First, this study provides only a snapshot in time; as new YouTube videos are created, the overall quality of content may change. Second, the scoring rubric utilized to assess video quality emphasized thoroughness and accuracy. It is possible that certain videos contained excellent content but received a low-quality rating due to a narrow focus or a single inaccuracy. For example, a video describing the “modified milking maneuver” was excellent in depicting this physical examination maneuver but scored poorly overall as it did not cover any additional topics related to UCL injury. It is possible that certain individuals utilize YouTube to obtain specific information regarding a certain aspect of a medical condition rather than a comprehensive overview.
Conclusion
Based on an analysis of the top 100 most-viewed videos, the overall quality of YouTube content related to the diagnosis and treatment of UCL injuries was found to be low (mean QAR-D, 4.83 out of 16; mean QAR-T, 2.76 out of 16). In addition, no correlation was observed between video quality and views/likes, suggesting that patients are not preferentially utilizing the limited high-quality content that does exist on the YouTube platform. Similarly, while physician-led educational videos tended to be of higher quality, patient testimonial videos had the most views on average. In addition, almost half of all videos were deemed inappropriate for patient education in terms of comprehensibility, as defined by our novel comprehensibility parameter. These findings represent an evolving problem as patients increasingly turn to the internet as a source of medical information. There is a clear need for physicians and other health care professionals to produce evidence-based and high-quality patient education videos that are appropriate in terms of comprehensibility level and that cater to patient preferences with regard to content (eg, patient testimonials) and duration (preference for brevity).
Footnotes
Final revision submitted September 18, 2022; accepted September 26, 2022.
One or more of the authors has declared the following potential conflict of interest or source of funding: C.A.P. has received education payments from Arthrex. C.S.A. has received consulting fees, nonconsulting fees, and royalties from Arthrex. AOSSM checks author disclosures against the Open Payments Database (OPD). AOSSM has not conducted an independent investigation on the OPD and disclaims any liability or responsibility relating thereto.
Ethical approval was not sought for the present study.