
Abstract
Background:
Medicare reimbursement is rapidly declining in many specialties. An in-depth analysis of Medicare reimbursement for routinely performed diagnostic imaging procedures in the United States is warranted.
Purpose/Hypothesis:
The purpose of this study was to evaluate Medicare reimbursement trends for the 20 most common lower extremity imaging procedures performed between 2005 and 2020, including radiographs, computed tomography (CT), and magnetic resonance imaging (MRI). We hypothesized that Medicare reimbursement for imaging procedures would decline substantially over the studied period.
Study Design:
Cohort study.
Methods:
The Physician Fee Schedule Look-up Tool from the Centers for Medicare and Medicaid Services was analyzed for reimbursement rates and relative value units associated with the top 20 most utilized Current Procedural Terminology (CPT) codes in lower extremity imaging from 2005 to 2020. Reimbursement rates were adjusted for inflation and listed in 2020 US dollars using the US Consumer Price Index. To compare year-to-year changes, the percentage change per year and compound annual growth rate were calculated. A 2-tailed t test was used to compare the unadjusted and adjusted percentage change over the 15-year period.
Results:
After adjusting for inflation, mean reimbursement for all procedures decreased by 32.41% (P = .013). The mean adjusted percentage change per year was –2.82%, and the mean compound annual growth rate was –1.03%. Compensation for the professional and technical components for all CPT codes decreased by 33.02% and 85.78%, respectively. Mean compensation for the professional component decreased by 36.46% for radiography, 37.02% for CT, and 24.73% for MRI. Mean compensation for the technical component decreased by 7.76% for radiography, 127.66% for CT, and 207.88% for MRI. Mean total relative value units decreased by 38.7%. The commonly billed imaging procedure CPT 73720 (MRI lower extremity, other than joint, with and without contrast) had the greatest adjusted decrease of 69.89%.
Conclusion:
Medicare reimbursement for the most billed lower extremity imaging studies decreased by 32.41% between 2005 and 2020. The greatest decreases were noted in the technical component. Of the modalities, MRI had the largest decrease, followed by CT and then radiography.
The cost of health care delivery is increasing at a steady rate, with projections estimating that expenditures will continue to increase at a rate of 5.4% per year. 4 Of the major payers, Medicare is the second largest in the nation. 22 With an aging populace and recent bills proposing to decrease the age eligible to enroll in Medicare to 60 years, Medicare spending will likely continue to increase. 15,30 As providers evaluate their expenses and compensation rates, it is important to understand these trends to maintain a successful practice while lessening the financial burden on patients without compromising the quality of care provided.
Medicare payment structure involves differential reimbursement for each procedure performed, with each procedure assigned a unique Current Procedural Terminology (CPT) code. Each CPT code is given a predetermined reimbursement based on the level of services rendered. This CPT amount is then multiplied by the relative value unit (RVU), which is based on provider labor, practice expense, and malpractice coverage. 15 Final adjustments are made by multiplying the RVU by the conversion factor (CF), which accounts for a variety of factors, such as geographic location and the state of the US economy. 25 This calculation then yields a final billable amount.
Medicare data are made publicly available and updated yearly, with recent research demonstrating declining Medicare reimbursement in multiple health care specialties, such as neurosurgery, 13 emergency medicine, 24 and orthopaedic surgery, 11 including trauma 12 and shoulder surgery. 21 However, there is a paucity of research on routinely performed studies utilized by all specialties, including diagnostic imaging. In a recent study, Tulipan et al 33 analyzed CPT codes from 2000 to 2015 for upper extremity imaging and found a substantial decrease in reimbursement. Given the decline in reimbursement of commonly performed musculoskeletal imaging examinations, combined with increased diagnostic imaging utilization, there is a need to better understand how these fiscal changes might affect diagnostic imaging. 2,29 To our knowledge, no study has examined the Medicare reimbursement trends for lower extremity imaging.
The purpose of this study was to evaluate Medicare reimbursement trends for the 20 most common lower extremity imaging studies performed between 2005 and 2020. Consistent with results from other diagnostic studies, it was hypothesized that lower extremity imaging procedures would see a substantial decline in Medicare reimbursement over the studied period.
Methods
All data were acquired through the publicly available Centers for Medicare and Medicaid Services (CMS) website, thereby exempting this study from institutional review board review. The Healthcare Common Procedure Coding System’s application summary from 2018 was surveyed to gather the top 20 most selected CPT codes for lower extremity imaging. 3 Two CPT codes, 73551 (radiograph, femur, 1 view) and 73552 (radiograph, femur, minimum 2 views), were excluded for incomplete data. The remaining 18 CPT codes and the next 2 most common ones were included to create the 20 codes analyzed. All CPT codes and corresponding procedure names are listed in Table 1.
20 Most Used Lower Extremity Imaging Procedures and Corresponding CPT Codes in 2018 a

a CPT, Current Procedural Terminology; CT, computed tomography; MRI, magnetic resonance imaging.
The CMS Physician Fee Schedule Look-up Tool 5 was queried for all 20 codes for the years 2005 to 2020. This is a publicly available data set that is updated yearly and can be downloaded in a spreadsheet format. Within radiology, a CPT code consists of a technical component (TC) and a professional component (PC). The TC contains the costs related to the equipment, facilities, and staffing required to perform the procedure, while the PC corresponds to the work performed by the provider, such as reading of the imaging. These values were averaged across the different geographic areas to provide a final reimbursement value for each code, with each area being considered equal regardless of size. 5 The RVU values for each CPT code were then similarly obtained. Each RVU was analyzed by the work, malpractice, and facility portions assigned by the CMS.
Once a complete profile of CPT codes was compiled, the change in reimbursement per CPT code from 2005 to 2020 was calculated and averaged among all 20 codes. These values obtained were considered “unadjusted” because they did not account for inflation. The unadjusted values were corrected for inflation by using the Consumer Price Index (CPI) calculator supplied by the US Bureau of Labor Statistics, which is the most widely used method for inflationary adjustment. 34 This yielded the “adjusted values” and allowed for a comparison in terms of 2020 US dollars. Using the adjusted values, the total percentage change and mean annual percentage change of each CPT code were calculated. Total percentage change for work, facility, and malpractice RVUs between 2005 and 2020 were also calculated.
In the interest of gathering a more consistent value for each CPT code reimbursement, the compound annual growth rate (CAGR) was calculated. The CAGR is helpful to evaluate change over a longer period and controls for short-term changes that might skew the results. The calculation utilized is listed as follows 12 :

To allow for a comparison among imaging modalities, adjusted reimbursement change was calculated for each of the 3 modalities: computed tomography (CT), magnetic resonance imaging (MRI), and radiograph. The data set was stratified by TC vs PC components to understand which aspect of imaging had a greater change. Finally, a 2-tailed t test comparison of means was performed to compare the unadjusted and adjusted percentage change over the 15-year period. 31 Significance was defined as P < .05. The data were compiled and analyzed using Microsoft Excel (Version 16.69).
Results
From 2005 to 2020, the overall unadjusted Medicare reimbursement rate for the 20 most common lower extremity imaging procedures decreased by 8.75%. When all data were adjusted to correct for inflation, reimbursement for the 20 most common lower extremity imaging procedures declined by 32.41%, a significantly higher rate of decline as compared with the unadjusted values (P = .013). Annual percentage change showed a mean decrease of 2.82% per year, and the CAGR showed a decrease of 1.03% per year (Table 2). When CPT codes were stratified by TC/PC component, the TC yielded an adjusted reimbursement decrease of 85.78%, while the PC yielded an adjusted reimbursement decrease of 33.02% (Tables 3 and 4). When stratified by image modality, MRI had the largest adjusted decrease of 60.49% (207.8%, TC; 24.7%, PC), followed by CT imaging reimbursement with a decline of 49.53% (127.6%, TC; 37%, PC) and radiography with the smallest decrease at 12.43% (7.7%, TC; 36.4%, PC) (Figure 1, Table 5).
Mean 2005 and 2020 Unadjusted and Adjusted Reimbursement Rates and Percentage Change for Selected Lower Extremity Imaging Procedures: Technical and Professional Components a
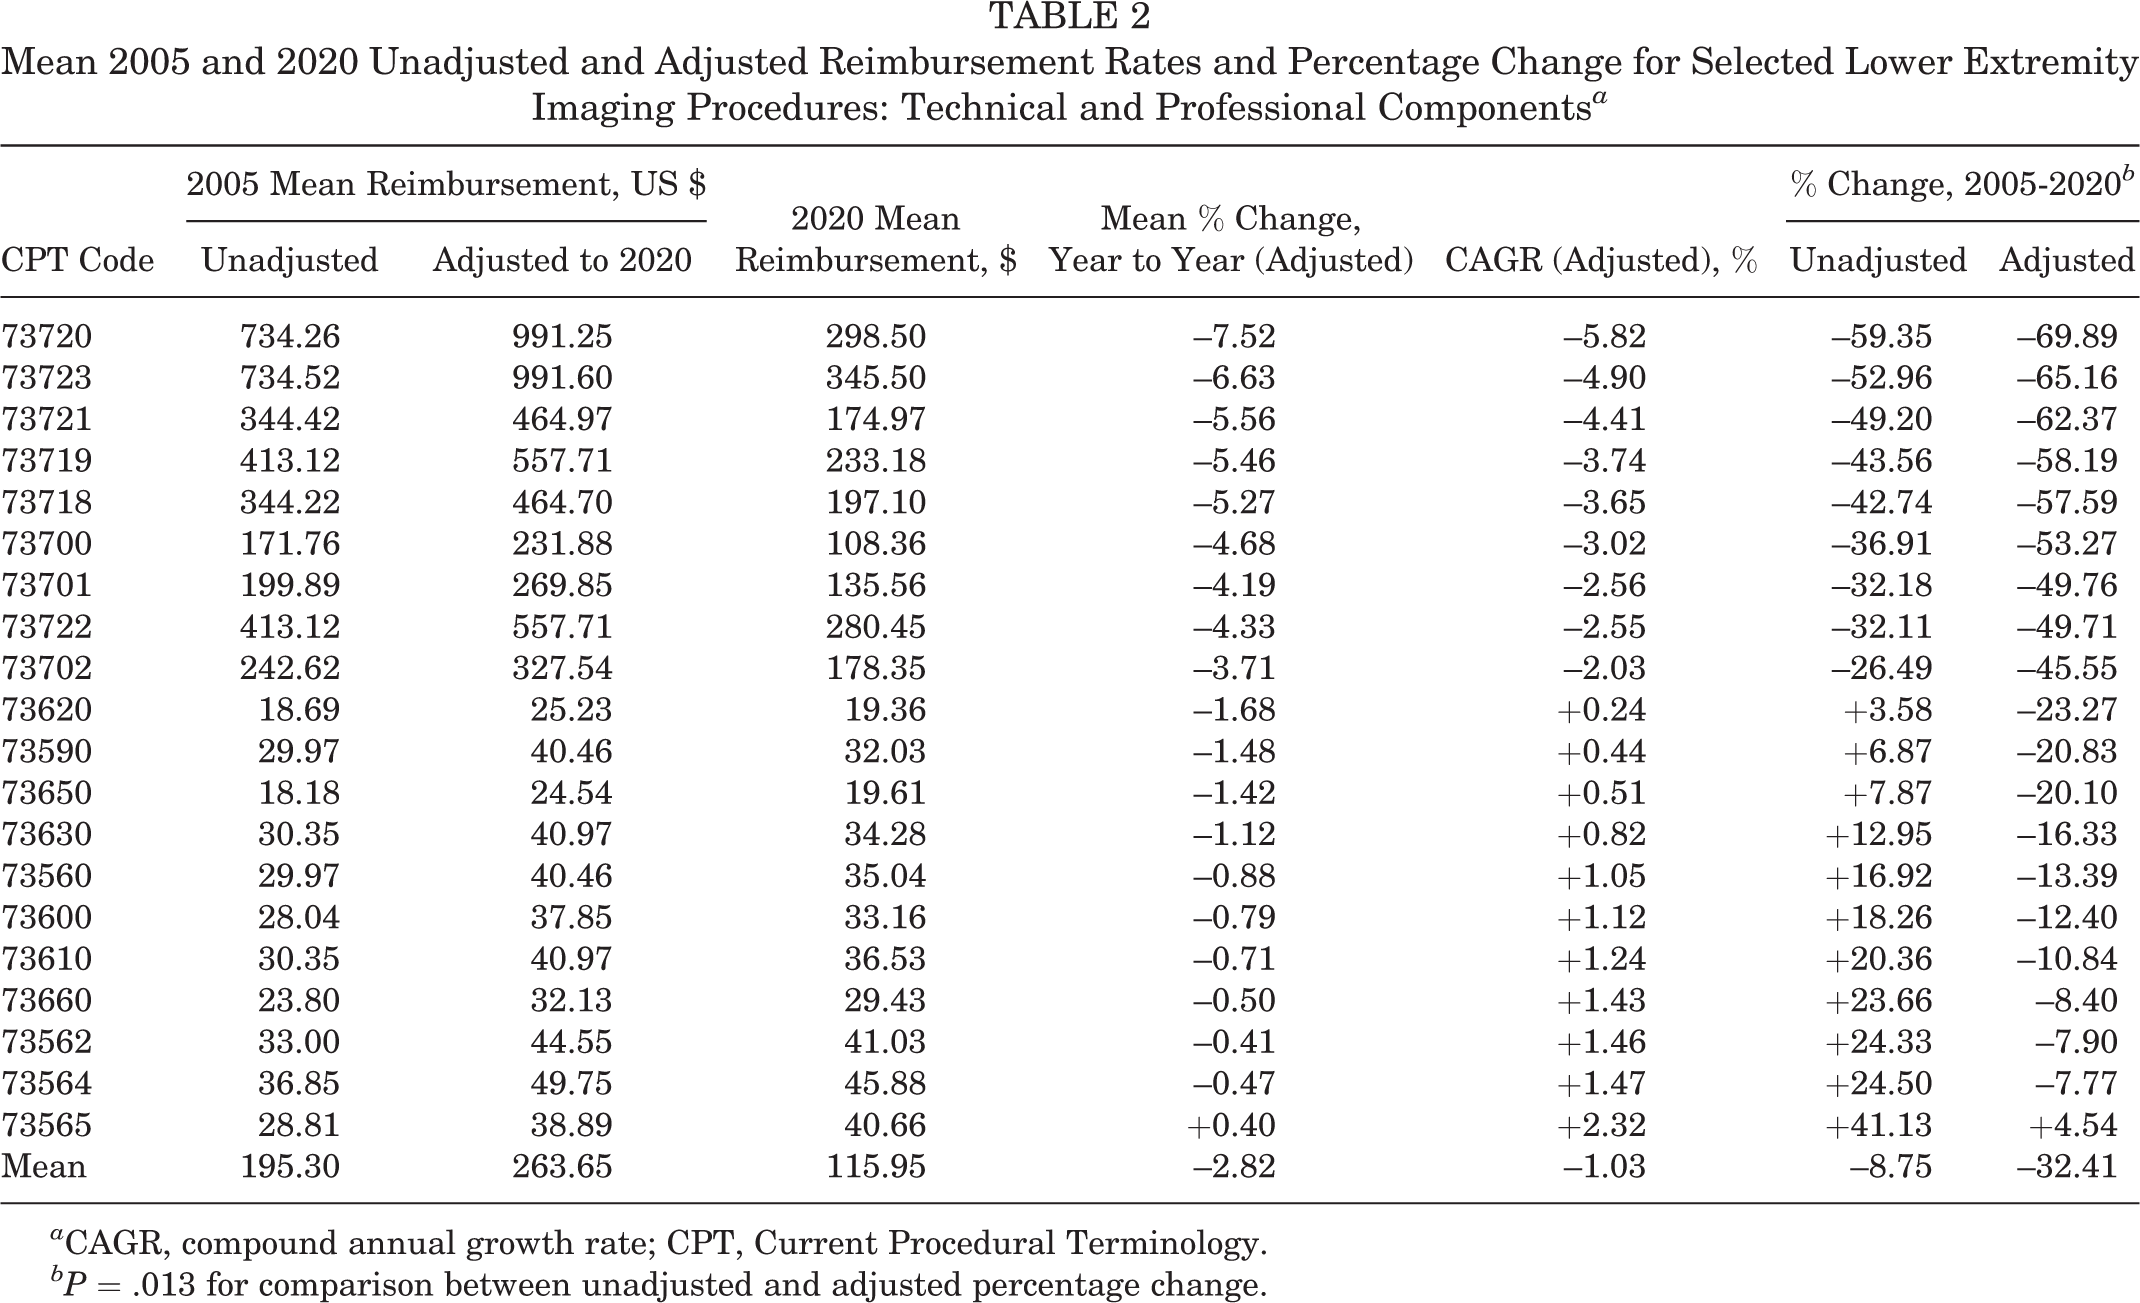
a CAGR, compound annual growth rate; CPT, Current Procedural Terminology.
bP = .013 for comparison between unadjusted and adjusted percentage change.
Mean 2005 and 2020 Unadjusted and Adjusted Reimbursement Rates and Percentage Change for Selected Lower Extremity Imaging Procedures: Technical Component a

a CPT, Current Procedural Terminology.
Mean 2005 and 2020 Unadjusted and Adjusted Reimbursement Rates and Percentage Change for Selected Lower Extremity Imaging Procedures: Professional Component a
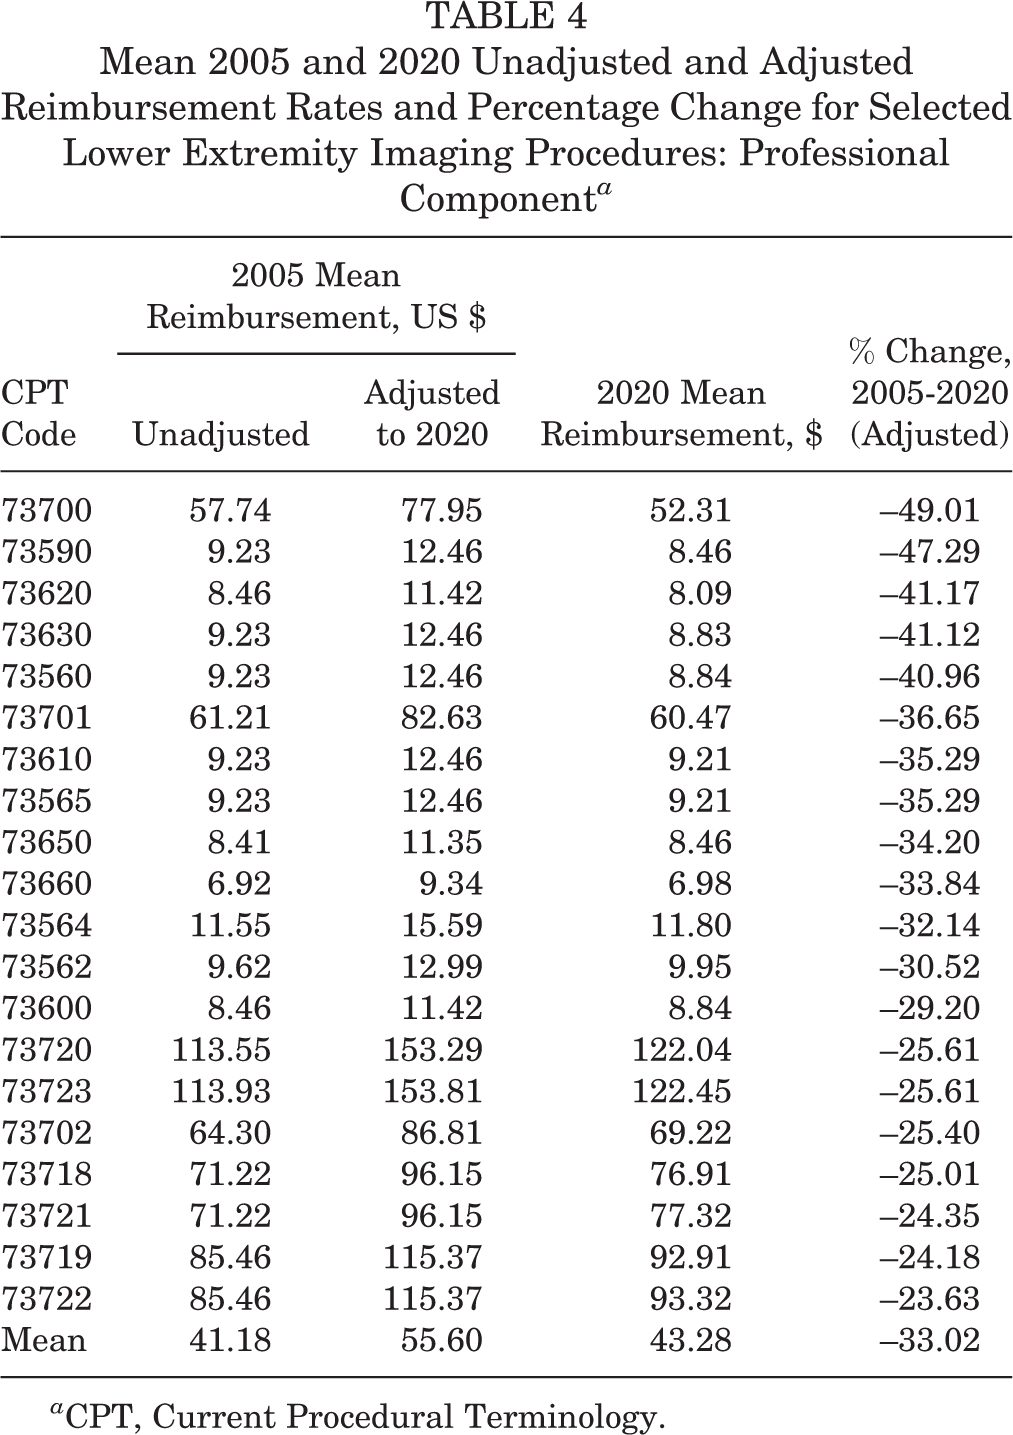
a CPT, Current Procedural Terminology.
Mean Percentage Change in Adjusted Medicare Reimbursement Between 2005 and 2020 by Component and Imaging Modality a

a Values are presented as percentages. CT, computed tomography; MRI, magnetic resonance imaging.

Charting the change in adjusted reimbursement of radiography, computed tomography (CT), and magnetic resonance imaging (MRI) over time.
Within the data, CPT 73720 (MRI lower extremity, other than joint, with and without contrast) had the largest adjusted percentage decrease of 69.89% and a TC decrease of 310.0%. All values within the MRI modality had an adjusted percentage decrease of at least 49.71%. CT reimbursement had an adjusted total percentage decrease of between 45.5% and 53.27% per code, showing a larger decrease in TC vs PC for each code. CPT 73565 (x-ray of both knees, standing, 1 view) was the singular code of the 20 analyzed that showed an adjusted percentage increase from 2005 to 2020 of 4.54% (see Table 2).
The mean total RVUs decreased from 9.35 to 5.73, a reduction of 38.7%. Facility RVUs decreased from 7.99 to 4.68, a 41.4% decline. Malpractice RVUs showed a larger decrease from 0.35 to 0.06, an 82.8% reduction. Work RVUs remained relatively constant over the 15-year period, with a decline from 1.01 to 1.00 (Table 6).
Mean RVUs for Lower Extremity Imaging Between 2005 and 2020 by Modality a
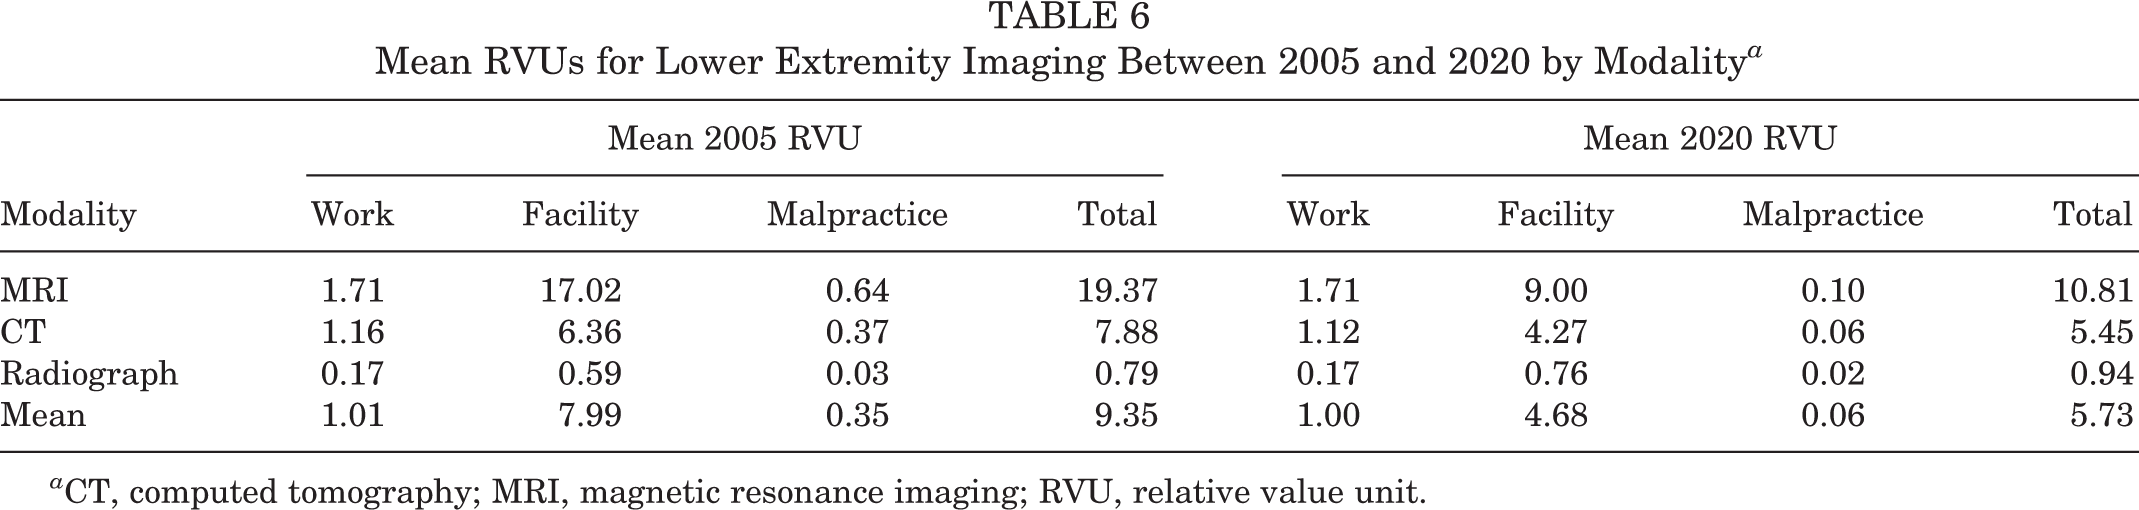
a CT, computed tomography; MRI, magnetic resonance imaging; RVU, relative value unit.
Discussion
Our research’s major findings showed that from 2005 to 2020, the Medicare unadjusted reimbursement rates of the 20 most utilized lower extremity imaging procedures decreased by a mean 8.75%. During this same period, the US CPI increased by 35%, resulting in a true mean reimbursement decrease of 32.41%. MRI reimbursement had the most substantial decrease at a mean adjusted 60.49%, while the TC of MRI accounted for the largest decline noted across the study. Previous studies sought to evaluate the changes in Medicare reimbursement for a variety of procedures, and the results from this study support the initial hypothesis, illustrating a decline in lower extremity imaging reimbursement. 11,13,18,21,24,29 This information will allow physicians, hospital administration, and governmental entities to make more informed decisions when evaluating trends in Medicare over the past 15 years.
The US government, as the provisioner of Medicare, has taken a variety of steps over the years to manage the growing costs of Medicare. One such attempt was the Balanced Budget Act of 1997. 35 This act connected Medicare reimbursement with the use of a sustainable growth rate, which sought to create a sustainable increase in Medicare reimbursement by aligning it with the economic growth of the United States. 32,35 This meant the Medicare spending could not exceed the expansion of the US economy as measured by the gross domestic product. 27,35 However, health care spending had been consistently growing at a greater rate than the gross domestic product of the United States, resulting in gradual deficits in yearly Medicare reimbursement. 7
The next major congressional attempt to limit rising imaging costs occurred in 2006 via the Deficit Reduction Omnibus Reconciliation Act. 9 It sought to curb the increasing costs associated with imaging by decreasing the TC for each CPT code, which resulted in a 20% to 40% decline in reimbursement for the TC related to MRI CPT codes alone. 18,20 In 2015, if not replaced, the sustainable growth rate and Deficit Reduction Omnibus Reconciliation Act would have seen large reimbursement cuts, including a potential 21% decrease for physicians. 27 Yet, after years of decreasing compensation and Medicare cuts, the sustainable growth rate was removed with the passage of the Medicare Access and Chip Reauthorization Act (MACRA). 17 A new focus was also created on quality health outcomes with the implementation of merit-based incentive payment systems and the alternative payment model. This system allowed for greater reimbursement for providers based on certain metrics measured in their patients, incentivizing quality of care over quantity of care. 14 However, the data obtained in this study, in combination with others previously cited, show a continual decline in the reimbursement despite the improvements promised within MACRA.
In addition, lawmakers have passed other forms of legislation to specially target the TC component of radiology reimbursement. One example was the multiple procedure payment reduction (MPPR), which stipulated that if a patient received contiguous imaging studies performed on the same day, the reimbursement for the TC would decrease. The MPPR resulted in a 25% cut in TC for contiguous imaging and was increased to 50% under the Affordable Care Act. 36 CMS held that increased efficiency of same-patient, same-day imaging directly supported the changes in reimbursement. However, studies assessing this claim found that the efficiency gained was significantly smaller than the changes made by the CMS. 1,10 Despite these findings, the CMS expanded the MPPR to include noncontiguous imaging and different modalities performed on the same day.
Other attempts to decrease the TC of Medicare reimbursement included targeting equipment utilization rates. The utilization rate is the amount of time that equipment is used during a 50-hour work week and is one factor employed by the CMS for determining reimbursement for the TC. In theory, an increased utilization rate spreads the cost of operating equipment over more studies, which lowers the payments per procedure. In 2013, The American Taxpayer Relief Act was passed, which increased the utilization rate from 75% to 90%. 8 Even if a facility was not operating equipment at a 90% utilization rate, it was still billed under this universal number. As such, the act resulted in drastic decreases to TC of Medicare reimbursement.
While there was an overall decrease in reimbursement for all observed imaging modalities, our study showed that MRI had the greatest overall change. This trend is not unique to lower extremity imaging and has been noted within other studies, including outpatient imaging in general. 18 One study evaluating Medicare reimbursements for upper extremity imaging reported that the compensation for MRI decreased to a level comparable to wrist ultrasound. 33 While MRI is more expensive than CT and radiography, it allows for the greatest anatomic visualization. Jenkins et al 16 evaluated the cost vs benefit of MRI utilization in scaphoid fractures and found that MRI increased the mean cost by 50% over radiography and 38% over CT. However, they proposed that MRI may remain the most cost-effective modality given its increased sensitivity and decreased likelihood of clinical complications, such as missing a fracture. 16,19 Regarding lower extremity imaging, MRI remains the most accurate means to diagnose soft tissue and cartilage pathology, making it the imaging study of choice for knee injury such as anterior and posterior cruciate ligament tears. 23 As MRI reimbursement continues to decline, as noted in this study, an updated cost-benefit analysis is warranted to evaluate the most efficient use of MRI and to properly update imaging algorithms to maximize diagnostic accuracy and efficiently utilize hospital resources.
Of note, the CPT code 73565 (standing radiograph of both knees) was the only imaging study that had an increase in adjusted reimbursement over the study period. Reasons for this outlier are not entirely certain, given the consistent decline in TC among other radiographic studies. As a result of the relatively low cost of the imaging, it is possible that minute changes in price could lead to a significant percentage change, although the data suggest that other codes with similar pricing did not experience the same phenomenon. Regardless, this code remains an outlier against the other 19 codes studied.
Declining reimbursement may have many unforeseeable effects on patient-related outcome metrics. One study found that increased financial pressure, along with decreased reimbursements from legislation passed between 1985 and 1994, was associated with an increase in 30-day mortality after hospitalization for acute myocardial infarction. 28 In a similar study, Dranove and White 8 reported that Medicare cuts led directly to a decrease in the number of services provided per encounter. Seshamani et al 26 sought to evaluate the effect of Medicare reimbursement cuts from the Balance Budget Act of 1997, hypothesizing that there would be an increase in mortality. They suggested that with increasing health care demands and decreasing compensation, staffing availability would decrease and lead to poorer patient outcomes. Although the authors did not find any significant difference in 30-day mortality, they cited continuing concerns over the long-term sustainability of these cuts. Though the risks of reimbursement cuts to patients are complex, there may be concerns that declining physician compensation may result in unsustainable adjustments by providers to maintain profitable practices. In theory, decreased compensation would require more procedures to be performed to match similar compensation rates, potentially resulting in physician fatigue. Current studies have noted increasing work hours to be prominent contributors to physician burnout. 37 Nevertheless, with implementation of MACRA, Medicare is moving toward greater value-based care, better patient outcomes, and incentivizing quality care on the part of the physician. As such, these components of a value-based practice should be considered when evaluating the effects of declining reimbursement rates.
In the current study, we noted that work RVUs, the value corresponding to the provider’s labor, did not change significantly from 2005 to 2020 yet total compensation decreased by >30%. Although RVUs are used as a common means for evaluating physician compensation, they are modified before the actual reimbursement by multiplying by the CF. The CF considers a variety of complex factors, including geographic location, and is adjusted yearly by the CMS. 25 When the CF is not adjusted with inflation, physician compensation decreases, even though work RVUs remain constant. One study reported that from 1998 to 2019, the CF was relatively constant despite an inflation rate of 50%. To maintain a constant value for the provider’s work and account for inflation, the 2019 CF would have to have been increased by 59%. 6 The current CF is close to the level of 1998 and is expected to decline further in 2022. 5 The data from this study revealed that certain CPT codes maintained a constant unadjusted reimbursement over the 15-year period but had a sizable decrease when adjusted for the CPI of 35%. Our findings do not suggest that the CF necessarily needs to change, but it is important that lawmakers understand that physician compensation will continue to decrease if inflation, in all aspects of Medicare reimbursement, is not accounted for in these formulas.
Limitations
There are several limitations within our study. First, our focus was Medicare reimbursement rates, and as such, it is not a complete representation of the entire US health care system. However, it has been shown that Medicare reimbursement tends to dictate how the health care industry performs overall. 12 Thus, the information presented in this study still allows for a depiction of the greater reimbursement trends within the market. Second, the geographic variations within the United States can lead to discrepancies in Medicare reimbursement. An attempt was made to control for this by averaging the values obtained. Although this might have led to a less specific evaluation of each area, the averaging of data allows for a more comprehensive and generalizable view of the reimbursement trends. Finally, as with all data mining, data can be erroneously categorized. This was minimized by using 2 people to input and verify accuracy.
Conclusion
Our research indicated that Medicare reimbursement for the most billed lower extremity imaging studies decreased by 32.41% with inflation adjustment between 2005 and 2020. The greatest cuts in compensation were noted in technical costs, which include support staff, equipment, and the facility itself. Of the imaging modalities studied, MRI had the largest decrease, followed by CT and finally radiography. This study adds to the collective data on Medicare reimbursement rates, allowing for a more accurate discussion of Medicare changes going forward.
Footnotes
Final revision submitted September 1, 2022; accepted September 13, 2022.
One or more of the authors has declared the following potential conflict of interest or source of funding: N.H. has received education payments from Goode Surgical and ImpactOrtho. K.P. has received education payments from Arthrex. AOSSM checks author disclosures against the Open Payments Database (OPD). AOSSM has not conducted an independent investigation on the OPD and disclaims any liability or responsibility relating thereto.
Ethical approval was not sought for the present study.