
Abstract
Background:
Biocomposite anchors have been a popular choice for use in coracoid transfer procedures for shoulder instability and are hypothesized to allow bone ingrowth.
Purpose:
To quantitatively evaluate the osteointegration of 85% PLLA/15% β-TCP biocomposite anchors used in the coracoid transfer procedure for shoulder instability.
Study Design:
Case series; Level of evidence, 4.
Methods:
We performed a retrospective case series of abstracted data from the records of 74 patients who underwent coracoid transfer procedures with biocomposite anchors. Computed tomography was performed at 24 months postoperatively. A total of 4 researchers independently reviewed the computed tomography images. The density (in Hounsfield unit [HU] values) of the anchor tunnels, glenoid, and subscapularis was assessed, and osteointegration of the anchor tunnels was evaluated with HU values, the quantitative ossification quality score (QOQS), and tunnel widening.
Results:
Included were 74 patients (58 male, 16 female), involving 76 shoulders and 124 biocomposite anchors. At ≥24-month follow-up, 72 of 124 (58.06%) anchor tunnels were classified as QOQS type 1, including 12 completely ossified tunnels and 60 almost completely ossified tunnels. Some degree of ossification (QOQS types 1-3) was observed in 118 (95.16%) anchor tunnels. Overall, 3 anchor tunnels were enlarged (QOQS type 5). The mean HU value of the anchor tunnels was 339.75, which was significantly higher than the preoperative HU value of the glenoid vault (262.19). Among the 124 anchor tunnels, 79 had HU values higher than their glenoid HU values, and 45 had lower HU values than their glenoid HU values. In the comparison of tunnel HU values at 12 versus ≥24 months, the HU value at ≥24 months was significantly higher. A total of 20 anchor tunnels widened.
Conclusion:
Among 124 anchor tunnels, 95.16% showed ossification, 58.06% were completely or nearly completely ossified, and 3 were enlarged. The HU value of the anchor tunnel increased over time.
Keywords
Biocomposite anchors are broadly used in shoulder instability surgery or rotator cuff repair. As a result, biocomposite anchor degradation and bone replacement have attracted increasing attention. Why does this matter? The bone tunnel will remain stable if biocomposite anchors are not degraded and replaced by bone. In worse cases, the bone tunnel is not replaced by bone, but, rather, a bone cyst forms. Residual holes and bone cysts increase the risk of glenoid fractures and complicate revision procedures.
Early bioabsorbable implants were fabricated using polyglycolic acid (PGA) and polylactic acid (PLA). However, the use of PGA for implants was abandoned because of severe adverse effects, including rapid degradation, synovitis, foreign body reactions, and osteolysis. 8,28 Poly-L-lactic acid (PLLA) anchors were introduced to diminish the abovementioned adverse reactions. 14 PLLA degrades slowly, leading to fewer adverse reactions. 11,22 Polylactic-co-glycolic acid (PLGA) was also developed by combining PGA and PLA and is expected to degrade more slowly than pure PGA, thus allowing control over the degradation time.
Although these PLLA and PLGA implants do degrade, there is no accompanying osteogenesis. 2,9 To promote bone formation, biocomposite implants consisting of a bone formation–promoting ceramic material, such as β–tricalcium phosphate (β-TCP), added to a biodegradable polymer material were developed. 5,27 PLLA/β-TCP anchors are widely used biocomposite suture anchors. However, very few studies have evaluated the osteointegration of PLLA/β-TCP anchors. Sgroi et al 24 evaluated the absorption and osteoconductivity of PLLA/β-TCP anchors used for rotator cuff repair with magnetic resonance imaging and found that almost all anchors were not completely absorbed at 2 years postoperatively, although osteoconductivity was found at the middle and apex of the anchors. However, this study included 2 types of anchors with different lengths, and the number of anchors was relatively small. Therefore, a study involving only 1 type of anchor and a larger number of anchors is necessary to obtain more convincing results.
In addition, previous investigators have pointed out 2 limitations in evaluating the osteointegration of biocomposite implants. First, there is no gold standard for assessing the ossification of anchor sites. Barber and Dockery 1 first developed the ossification quality score (OQS) for assessing ossification on computed tomography (CT), and this is a helpful tool that has been used in several studies. However, the interobserver agreement of the OQS is relatively low, 1,20,27 and the coronal and cross-sectional planes on CT are not along the long axis of the anchor tunnel, and the sagittal plane is not perpendicular to the long axis, 17 which could lead to measurement errors. To minimize these 2 limitations, we modified the OQS in the present study.
In this study, we aimed to evaluate the osteointegration of a biocomposite anchor: an 85% PLLA/15% β-TCP anchor (PushLock; Arthrex). The hypothesis was that PushLock anchors would display some osteointegration at 2 years after surgery.
Methods
Patient Recruitment
The protocol for this study received ethics committee approval. This was a retrospective cohort study of a consecutive series of patients who underwent coracoid transfer procedures for shoulder instability between May 2015 and November 2018. The patients’ postoperative CT images were analyzed to assess the osteointegration of the biocomposite anchors. The inclusion criteria were as follows: (1) treatment with arthroscopic or open coracoid transfer procedures, including the Cuistow procedure, traditional Bristow procedure, or Latarjet procedure; (2) surgery performed by a single surgeon (G.C.) from May 2015 to November 2018 at a single institution; and (3) application of PushLock anchors (length: 15.5 mm; diameter: 2.9 mm) at the glenoid. The exclusion criteria were as follows: (1) previous surgery on the ipsilateral shoulder; (2) lack of CT scans preoperatively, on the first postoperative day, or at 2 years postoperatively; (3) postoperative infections; or (4) diabetes or epilepsy. For some patients, the anchors were excluded if the anchor tunnels were too short. In addition, an anchor was excluded if it was too close to other anchors or screws to interfere with its Hounsfield unit (HU) measurement.
A total of 254 patients (260 shoulders) underwent coracoid transfer procedures using PushLock anchors. Overall, 85 of 254 patients had CT scans of the affected shoulder at different time points, including preoperatively, on the first day postoperatively, and at 2 years postoperatively. There were 2 patients who underwent surgery on both shoulders (Figure 1). Ultimately, 9 patients (9 shoulders) were excluded because of previous surgery, postoperative infections, or diabetes. Interference of the HU measurement for 5 anchor tunnels was caused by screws or other anchors; thus, the 5 anchors were excluded. Additionally, 20 anchors were excluded because their tunnels were too short for measurements. Of these 20 anchors, 19 were located between the 4:30 and 6-o’clock positions in the right shoulder (7:30 and 6-o’clock positions in the left shoulder), and the remaining anchor was located at the 12-o’clock position. Finally, 74 patients involving 76 shoulders and 124 PushLock anchors were included in the present study.
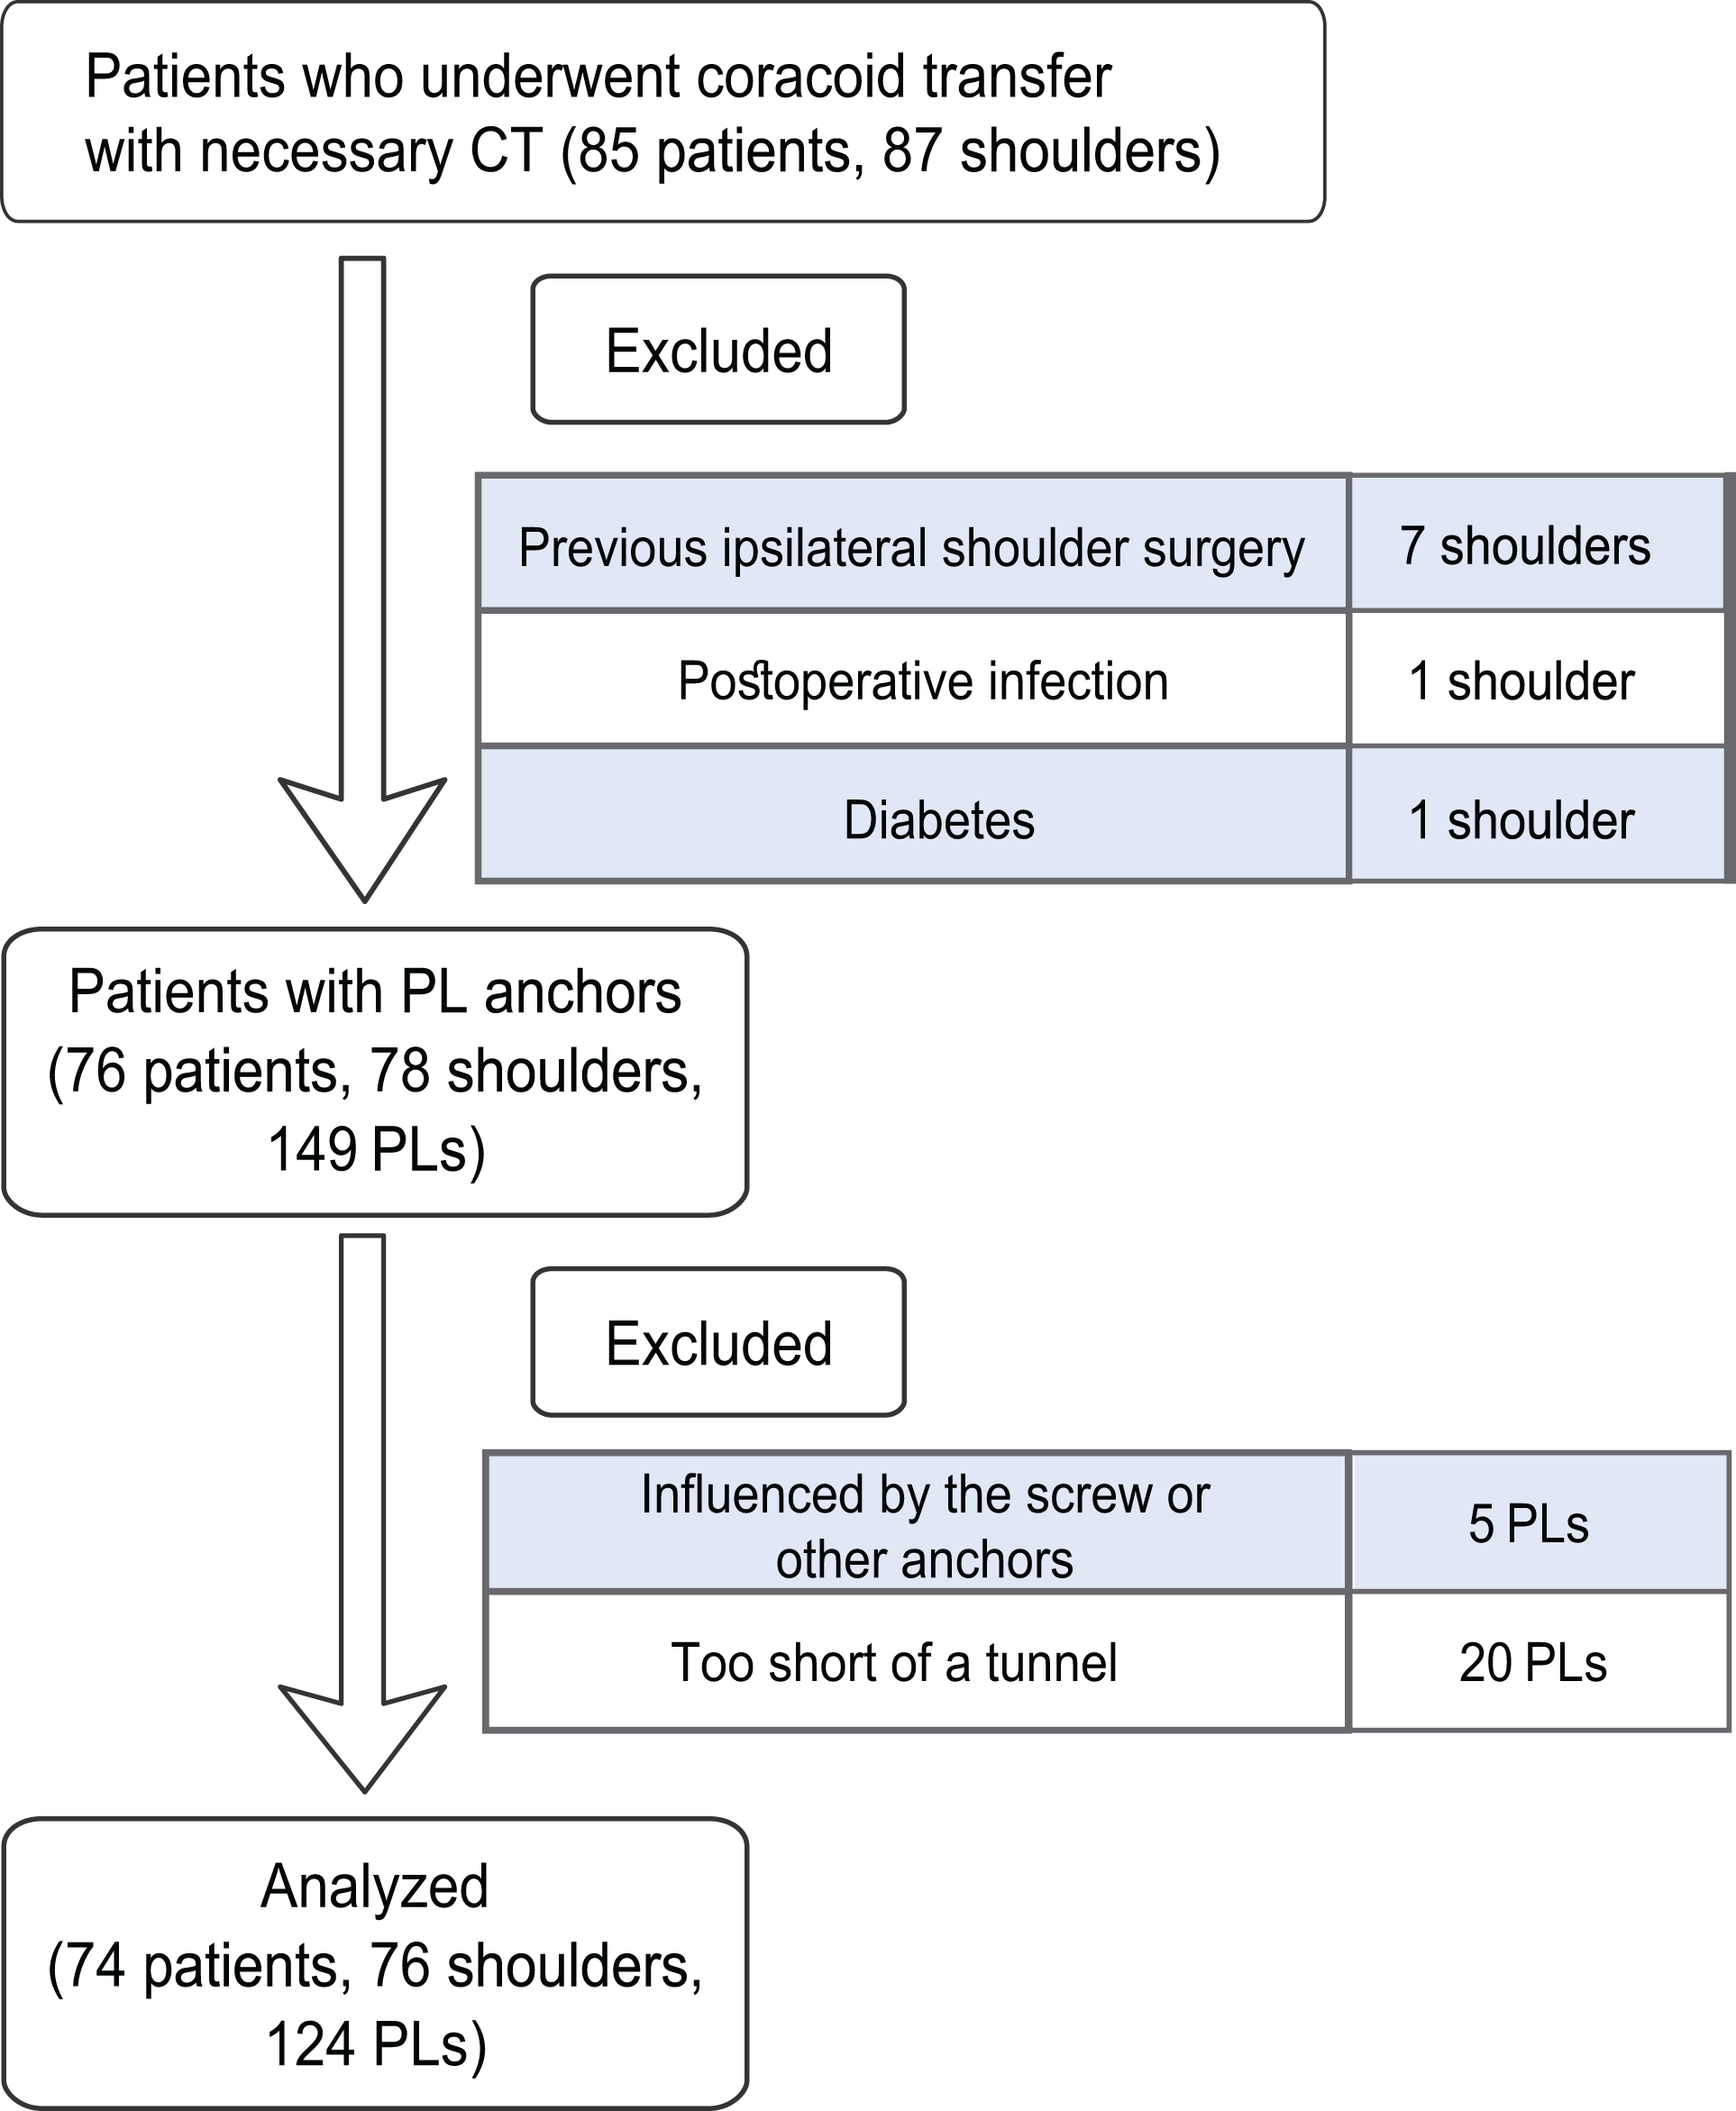
CONSORT (Consolidated Standards of Reporting Trials) diagram. CT, computed tomography; PL, PushLock.
Surgical Technique
All surgical procedures were performed with the patient in the beach-chair position under general anesthesia. The Latarjet and traditional Bristow procedures were performed as previously described. 7,12,15,16 The surgical technique of the Cuistow procedure has been described in detail in our previous work. 19,25
After the removal of soft tissue, osteotomy of the coracoid process was performed. The coracoid bone block was 15 mm long for the Cuistow procedure (adjusted by the defect size of the glenoid), <1 cm long for the traditional Bristow procedure, and osteotomized at the “knee” of the coracoid process for the Latarjet procedure.
The subscapularis was split at the junction of the inferior one-third and superior two-thirds to expose the anterior glenoid neck. The anterior glenoid rim was then prepared. The anteroinferior rim of the glenoid was ground flat in the Latarjet and traditional Bristow procedures to place the coracoid graft. In the Cuistow procedure, a socket with a diameter of 10 mm and a depth of 7 to 9 mm was created at the 4- or 8-o’clock position (for the right or left shoulder, respectively). The coracoid graft was then retracted, trimmed, transferred, and fixed at the anterior glenoid rim with a Mini TightRope device (Arthrex) or a 3.5-mm screw (DePuy Synthes). Next, an Orthocord suture (DePuy Synthes) was inserted into the conjoint tendon close to the coracoid tip.
After confirmation of the position and stability of the graft, the remaining capsule and labrum were then sutured to the anterior edge of the glenoid rim. Then, 2 sockets were drilled at the surface close to the anterior rim, usually at the 5- and 3-o’clock positions for the 2.9-mm PushLock anchors. The preset Orthocord suture was passed through the labrum and capsule and then tightened and fixed to the 5-o’clock position with a PushLock anchor. This is helpful for preventing rotation of the coracoid graft. Another PushLock anchor was used to repair the upper labrum at the 3-o’clock position. If necessary, other injuries, such as superior labrum from anterior to posterior tears, were also operatively managed.
Radiological Assessment
In all patients, CT was performed at 2 years postoperatively with a 64-detector CT scanner (Siemens). The scanning parameters were as follows: matrix, 512 × 512; pixel spacing, 0.46 × 0.46 mm; slice thickness, 1.0 mm; pitch, 0.8 mm; and 120 kVp.
The HU is a relative quantitative measurement for assessing tissue density on CT. The HU values for human anatomy on CT are as follows: 0 HU for liquid, <120 HU for soft tissue, >150 HU for light trabecular bone, and 1000 HU for cortical bone. 21 HU values have been used to evaluate anchor tunnel bone ingrowth. 3,27 In the present study, values <150 HU were considered to indicate unossified tissue, while values >150 HU were considered to indicate ossified tissue.
The HU value at each anchor tunnel was measured. The HU values of the glenoid vault and subscapularis were also measured on preoperative CT to represent the HU values of cancellous bone and soft tissue. We performed multiplanar reconstruction using thin-slice CT of the shoulder to obtain coronal, sagittal, and transverse planes of the glenoid. We drew 3 bisectors of the glenoid from rostral to caudal (Figure 2). We measured glenoid HU values in the 3 middle cross sections, including only cancellous bone, without including the cortex. Abnormal bone tissue, such as bone cysts, was excluded. Ultimately, 3 sections of the glenoid were measured, and the average was taken as the final glenoid HU value.

Hounsfield unit (HU) measurement technique of the glenoid vault on computed tomography. The red lines in panels A, C, and E are measurement reference lines. The red circles in panels B, D, and F are the measurement range, including as much cancellous bone as possible but excluding cortical bone.
To clarify the influence of the area of the anchor site on osteointegration, the glenoid was divided into 6 different aspects by considering the glenoid as a clock face: 11 to 1 o’clock was the superior aspect, 1 to 3 o’clock was the anterosuperior aspect, 3 to 5 o’clock was the anteroinferior aspect, 5 to 7 o’clock was the inferior aspect, 7 to 9 o’clock was the posteroinferior aspect, and 9 to 11 o’clock was the posterosuperior aspect.
The anchor tunnel diameters, HU values, and unossified areas were measured on 2-dimensional images according to the following steps. (1) Sagittal and coronal images were reconstructed using axial CT of the shoulder (Figure 3, A-C). (2) Axial, coronal, and sagittal images of the anchor tunnel were obtained, and the tunnel was exposed entirely (Figure 3, D-F). (3) The HU values of various anchor sections were measured (8 and 12 mm away from the tunnel entrance) (Figure 4); the HU value of the anchor tunnel was the average of the HU values of the 2 sections. (4) The unossified area was measured (Figure 5A). (5) The anteroposterior diameter (APD) and upper and lower diameter (ULD) were measured (Figure 5, B and C); these 2 diameters were used to define the maximum width of the unossified area. (6) Finally, the density of cancellous bone of the glenoid vault and subscapularis was measured.

Shoulder computed tomography of an anchor tunnel. (A) Coronal plane. (B) Cross-sectional plane. (C) Sagittal plane. (D) Coronal plane along the long axis. (E) Cross-sectional plane along the long axis. (F) Sagittal plane perpendicular to the long axis of the anchor.

Hounsfield unit (HU) values of various anchor sections. (A) At 8 mm from the tunnel entrance. (B) At 12 mm away from the tunnel entrance. (C, D) HU values measured on the sagittal plane.
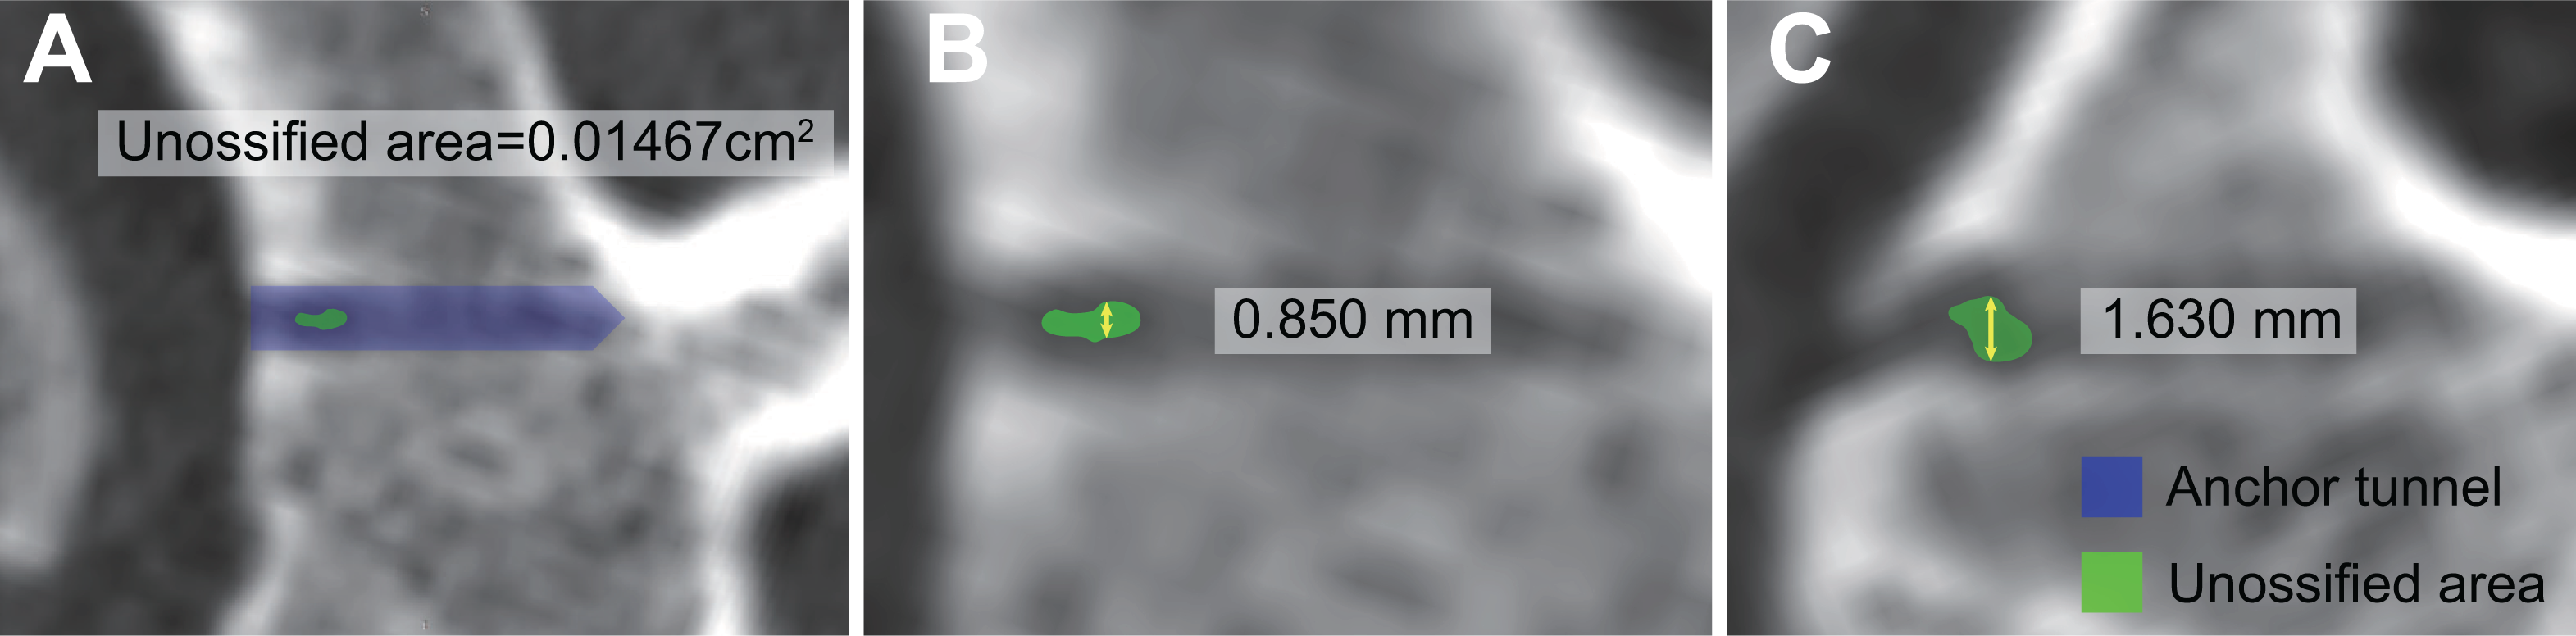
Measurements of the unossified area. (A) Unossified area. (B) Anteroposterior diameter. (C) Upper and lower diameter.
Four researchers (G.S., C.T., Y.Z., and G.L.) who were blinded to the study data independently performed the measurements. If 3 or 4 of the surgeons made the same decision, the final grade was determined based on that decision. If not, the final grade was determined based on a consensus.
The OQS has been used to evaluate anchor or screw ossification in previous studies. 1,13,20,24,27 The OQS ranges from types 1 to 4: type 1, no or little ossification; type 2, some ossification; type 3, ossification with a thin lucent rim; and type 4, good ossification. It is a semiquantitative subjective assessment. The reported interobserver agreement of the OQS is 0.430 with 3 observers. 20 In the present study, we modified the OQS to increase interobserver agreement (quantitative OQS [QOQS]). Using a coronal view of the anchor tunnel (Figure 5A), we measured the unossified area. The QOQS is divided into 6 types according to the unossified ratio, calculated as follows: Unossified ratio = Unossified area/(Anchor length × Anchor diameter) × 100% (Table 1). Representative images of QOQS types 1 to 5 are shown in Figure 6. Evidence of anchor tunnel ossification was considered to be present for QOQS types 1 to 3.
Quantitative Ossification Quality Score

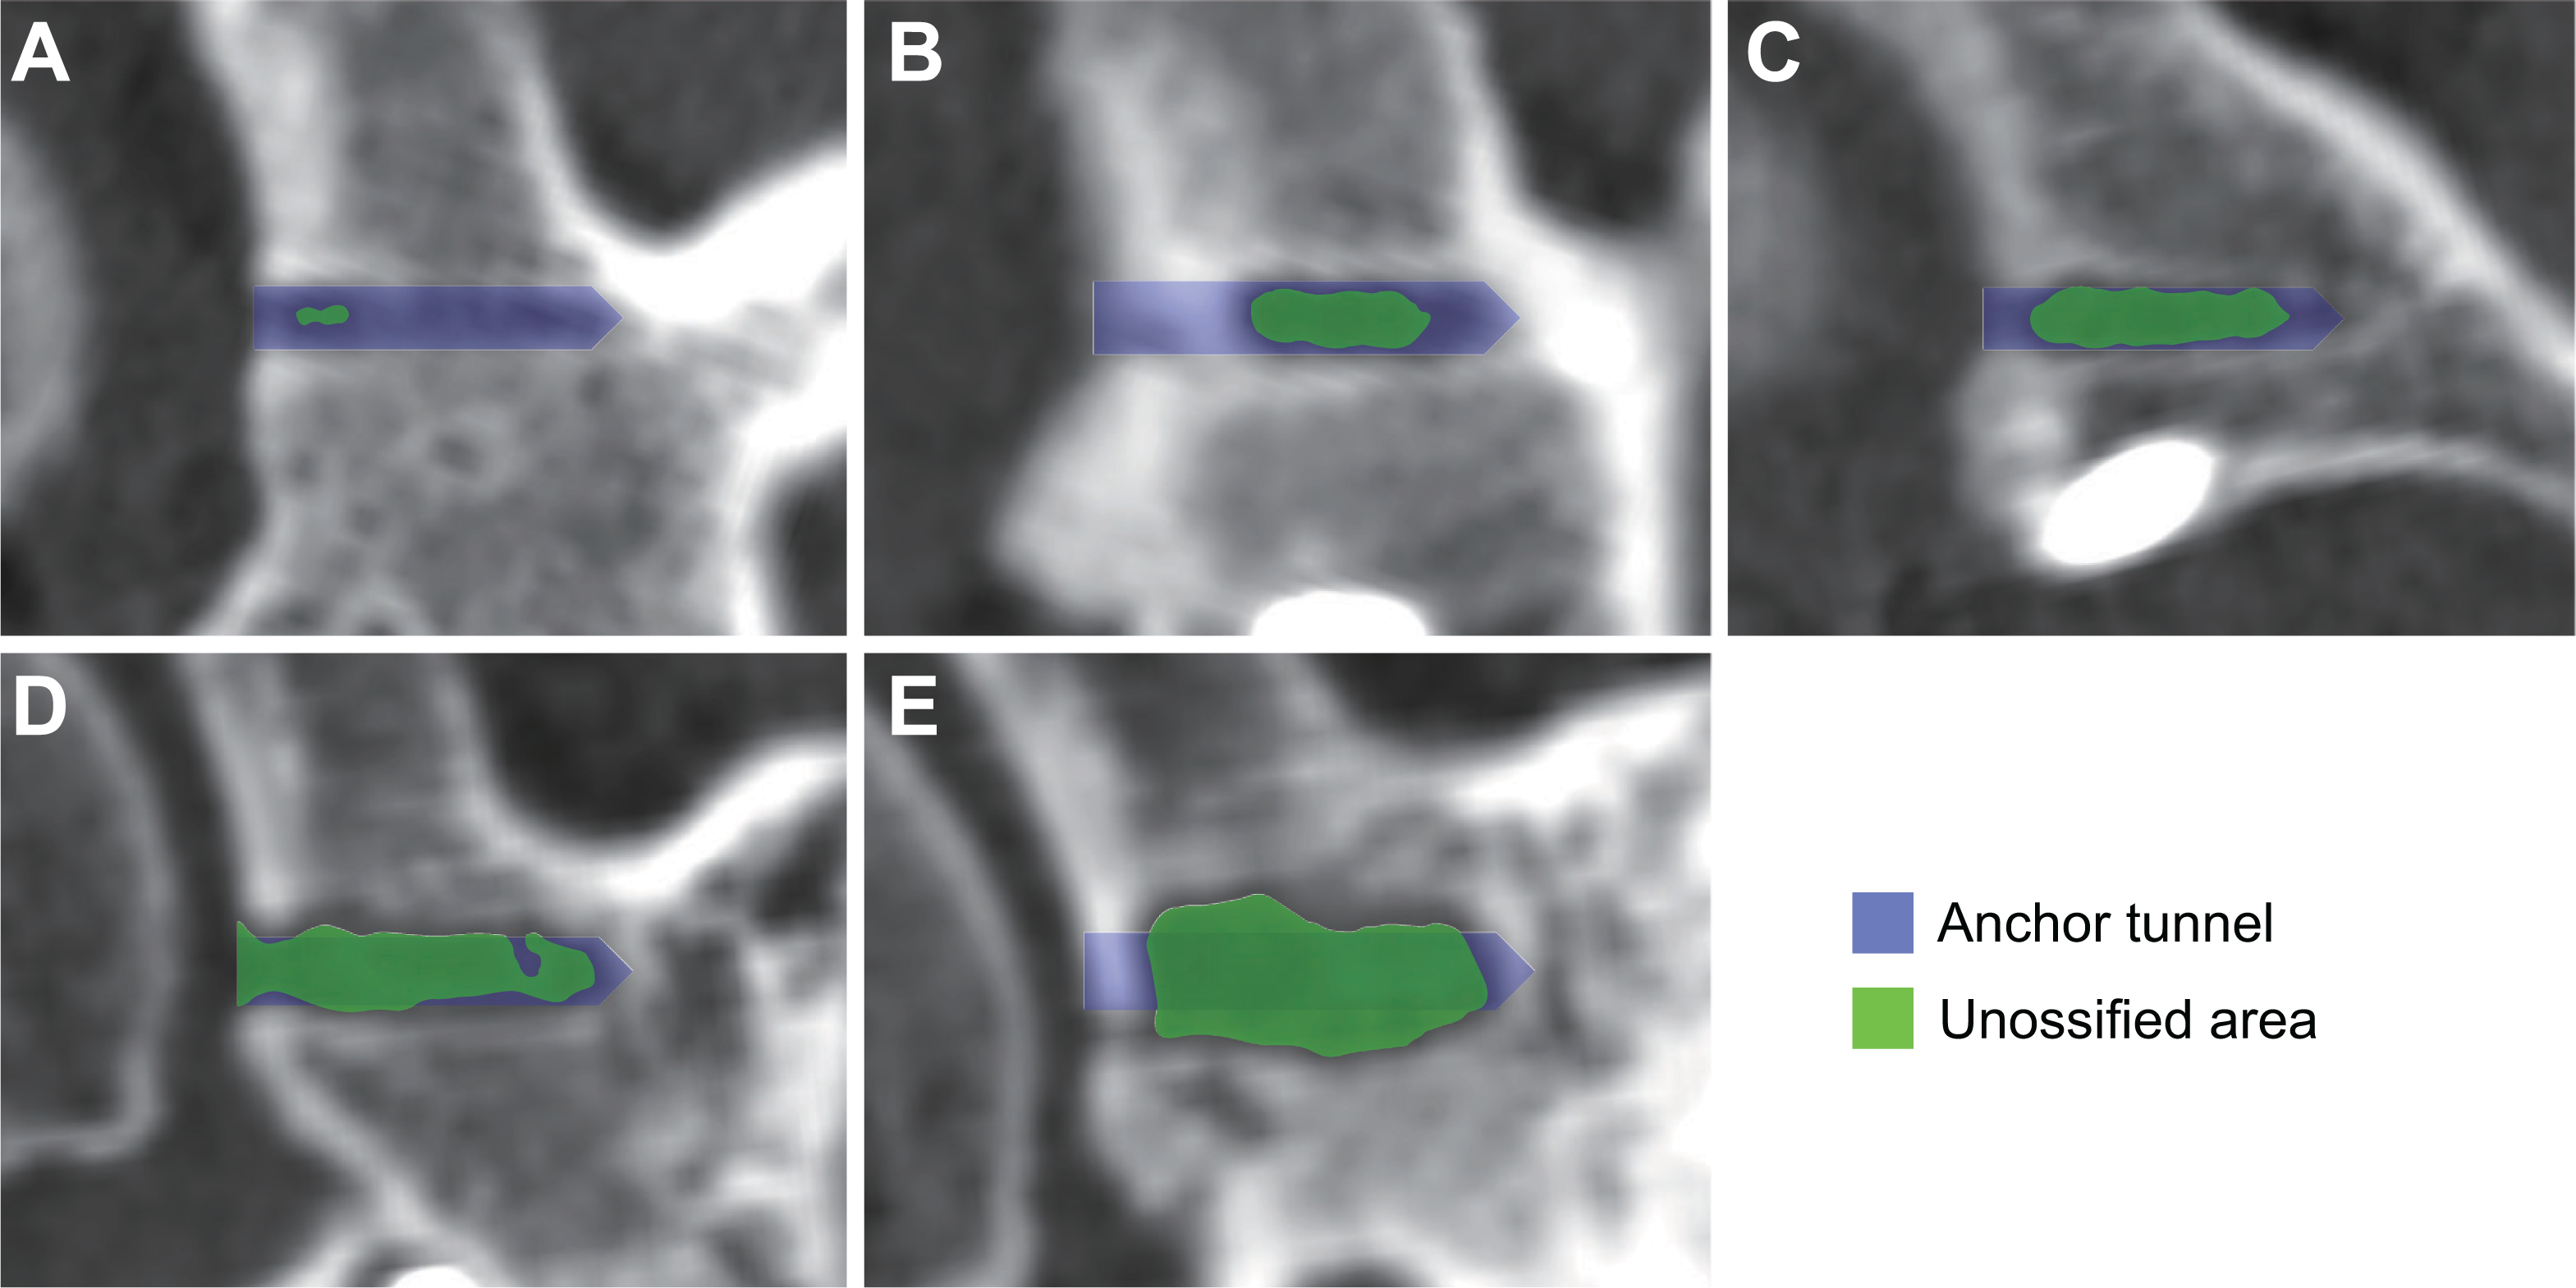
Representative images of quantitative ossification quality score types 1 to 5. (A) Type 1: almost complete calcification (unossified ratio: 3.53%). (B) Type 2: extensive calcification (unossified ratio: 30.03%). (C) Type 3: moderate calcification (unossified ratio: 60.13%). (D) Type 4: little or no ossification (unossified ratio: 88.85%). (E) Type 5: tunnel enlargement of 1 to 1.5 times (unossified ratio: 125.07%).
Statistical Analysis
Preliminary data processing was conducted with R (Version 4.0.3), and subsequent data analysis was conducted with SAS (Version 9.4; SAS Institute) and SPSS (Version 26; IBM). The Kendall coefficient of concordance (Kendall W) was used to analyze interobserver agreement. The distribution of the Kendall W is between 0 and 1, and conventionally, W ≤0.2 indicates poor agreement, >0.2 to ≤0.4 fair agreement, >0.4 to ≤0.6 moderate agreement, >0.6 to ≤0.8 substantial agreement, and >0.8 excellent agreement. The Wilcoxon signed-rank test (for categorical variables with a nonnormal distribution) and t test (for numerical variables with a normal distribution) were used for within-group comparisons of HU values at 12 and ≥24 months, HU values of the anchor tunnel with the glenoid vault, and HU values of the anchor tunnel with the subscapularis. Statistical significance was set at P < .05.
Results
Demographic and Clinical Data
In total, 74 patients (58 male, 16 female) with 76 shoulders and 124 PushLock anchors were enrolled in the present study. Other demographic data are presented in Table 2.
Demographic and Clinical Data (N = 76 Shoulders) a

a Data are reported as No. of shoulders, mean ± SD, or median (interquartile range), unless indicated otherwise. Because the operation time may be different for different shoulders of the same patient, data are displayed based on the shoulder rather than the patient.
HU Values
The main HU measurement results are shown in Table 3. The HU value of the anchor tunnel increased over time (12 vs ≥24 months; P < .01). At least 2 years after surgery, the mean HU value of the anchor tunnels was 339.75 ± 161.62, which was significantly higher than the HU value of the glenoid vault (P < .01). However, the HU values of 45 (36.29%) anchor tunnels were still lower than the preoperative glenoid HU values. In addition, regardless of whether the time point was 12 or ≥24 months, the HU values of the anchor tunnels were higher than those of the subscapularis (P < .01).
Hounsfield Unit Values

a Anchor tunnel versus glenoid vault.
b Anchor tunnel versus subscapularis.
c 12 months versus ≥24 months.
Ossification Quality
In the present study, the QOQS was the main observation index. There were 4 researchers who determined the QOQS, and the interobserver agreement was 0.789, which was considered to indicate substantial reliability. QOQS type 1 was observed in 72 of 124 (58.06%) anchor tunnels, including 12 completely ossified tunnels and 60 almost completely ossified tunnels (Figure 7). In other words, over 40% of tunnels still had >25% nonossified areas. Some degree of ossification (QOQS types 1-3) was observed in 95.16% of anchor tunnels. Additionally, 3 anchor tunnels were enlarged, and the unossified area reached 1 to 1.5 times the initial tunnel area, corresponding to QOQS type 5. No cases of QOQS type 6 were found in the present study (Table 4).

Computed tomography of anchor tunnels the day after surgery (A, C, E) and at the last follow-up (B, D, F) of 3 patients showing quantitative ossification quality score type 1. (A, B) Patient 1, male, aged 18 years at the time of surgery, followed up for 41 months. (C, D) Patient 2, female, aged 34 years at the time of surgery, followed up for 44 months. (E, F) Patient 3, male, aged 18 years at the time of surgery, followed up for 49 months.
QOQS Types a

a Data are reported as No. (%). QOQS, quantitative ossification quality score.
There were 30 tunnels with CT images at 12 and ≥24 months. The QOQS of the 30 tunnels at 12 and ≥24 months was analyzed. The QOQS of 23 tunnels did not change. The QOQS of 1 tunnel increased from type 2 to type 1. The QOQS of 6 tunnels decreased, and their HU values also decreased from 12 to ≥24 months (Table 5). The glenoid HU values of 3 tunnels were significantly lower than the mean value of the glenoid vault (262.19). The poor osteointegration of 3 tunnels may have been caused by their low bone mass, and the poor osteointegration of the other 3 tunnels may have been caused by increasing osteolysis as the anchor resorbed.
Tunnels With Decreased QOQS a
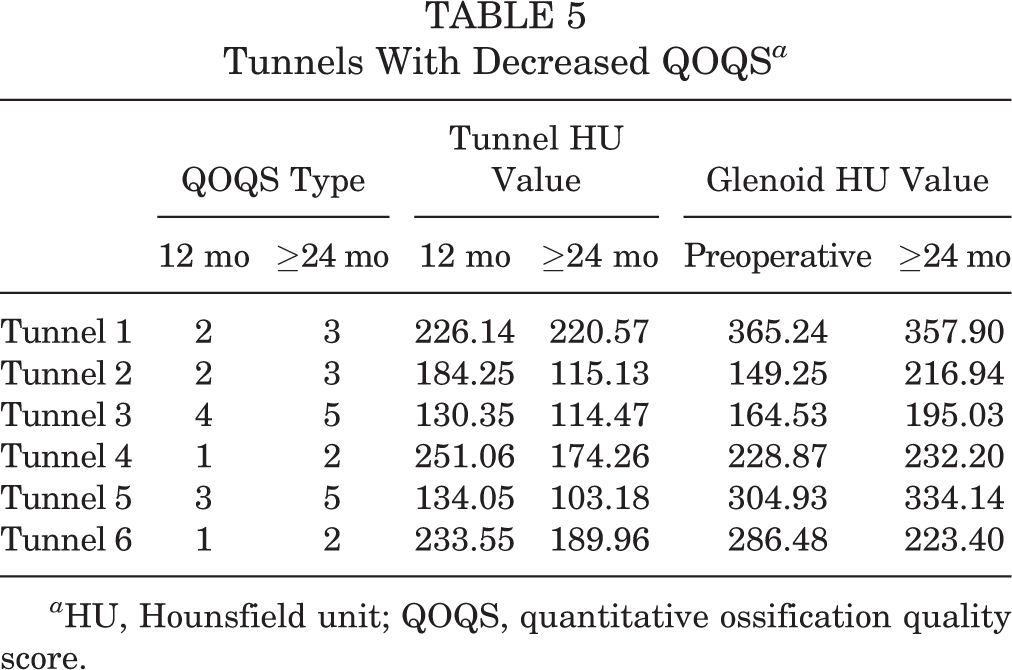
a HU, Hounsfield unit; QOQS, quantitative ossification quality score.
The influence of the anchor position on the QOQS was also examined (Table 6). At 12 and ≥24 months, the anchors showed high ossification rates at 6 different locations (90%-100%). At ≥24 months, the ossification rates for the anterosuperior aspect and the anteroinferior aspect were 94.54% and 90.91%, respectively, and that of the remaining aspects was 100.00% except the posterosuperior aspect with 0.00%.
Relationship Between Ossification (QOQS Types 1-3) and Anchor Position a

a Data are reported as No. (%). QOQS, quantitative ossification quality score.
Anchor Tunnel Diameter Changes
The ULD and APD of the tunnels and the number of widened tunnels are summarized in Table 7. As long as one of the ULDs or APDs increased, the tunnel was considered widened. At least 2 years postoperatively, 20 anchor tunnels widened. In addition, 6 anchor tunnels were observed with increases in both ULD and APD.
Diameters of Anchor Tunnels a
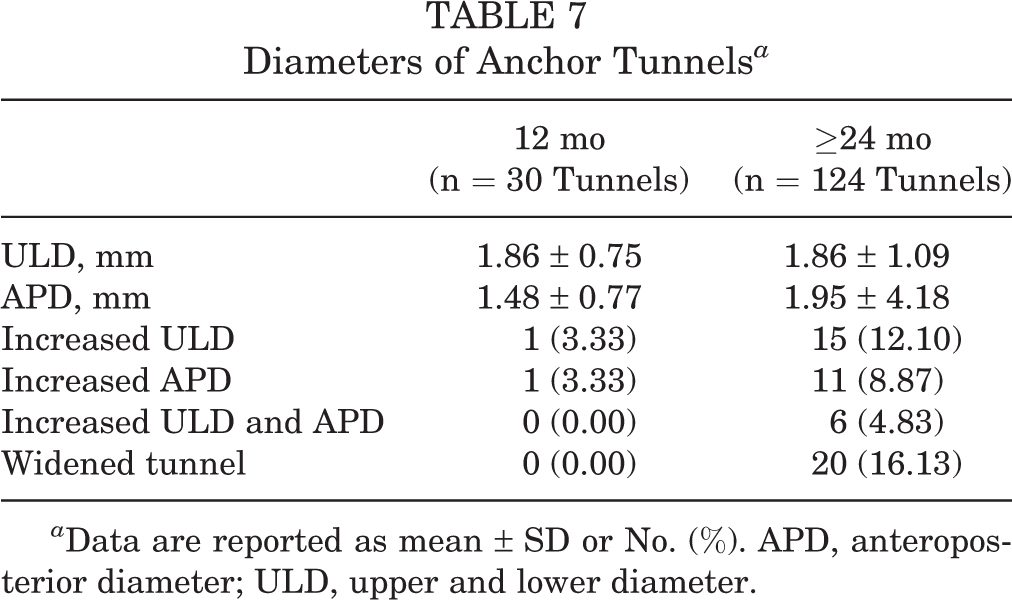
a Data are reported as mean ± SD or No. (%). APD, anteroposterior diameter; ULD, upper and lower diameter.
Discussion
The principal finding of the present study was that osteointegration was observed at least 2 years after surgery. QOQS type 1 was observed in 72 of 124 (58.06%) anchor tunnels, including 12 completely ossified tunnels and 60 almost completely ossified tunnels. Some degree of ossification (QOQS types 1-3) was observed in 95.16% of anchor tunnels. It is noteworthy that over 40% of tunnels still had >25% nonossified areas. In addition, the tunnel HU values were significantly higher than those of the glenoid vault, and widening of 20 anchor tunnels was observed. Finally, the interobserver agreement of the QOQS proposed in this study was 0.789, higher than that of the OQS reported in previous studies.
In the present study, the PushLock anchors used were made from PLLA/β-TCP. Complete ossification occurred in 12 (9.68%) anchor tunnels. Almost complete ossification was observed for 60 (48.39%) anchor tunnels, and some degree of ossification was observed for 118 (95.16%) anchor tunnels. However, over 40% of tunnels still had >25% nonossified areas. This could increase the risk of glenoid fractures if the shoulder is redislocated. Ntagiopoulos et al 23 reported considerable osteoconductivity for PLLA/β-TCP anchors in anterior cruciate ligament reconstruction after 37.5 months of follow-up. Sgroi et al 24 reported that almost all PLLA/β-TCP anchors used for rotator cuff repair were not completely absorbed at 2 years postoperatively, although osteoconductivity was found at the middle and apex of the anchors. The use of bioabsorbable PLLA anchors in shoulder instability surgery has also been reported. Stein et al 26 reported that none of the PLLA anchors were fully absorbed and that drill hole healing was incomplete after 32 months of follow-up. This was in line with a previous publication showing that PLLA tack holes were still visible at least 7 years postoperatively. 10
Bioabsorbable implants have absorbable properties, similar to biocomposite anchors, but cannot induce bone ingrowth. The main difference between the 2 implants is that biocomposite implants contain ceramic material. LeGeros 18 demonstrated that the osteoconductivity of bioceramics was caused by its porous block structure that can induce bone formation. Moreover, TCP could actively break down and provide a scaffold that buffers the acidic breakdown products of lactic acid and glycolic acid, encouraging new bone ingrowth. 1,4 Ntagiopoulos et al 23 reported different densities of replaced tissue when including different proportions of TCP in PLLA screws; the 30% TCP screw showed a mean density of 379.3 HU, while the 60% TCP screw showed a significantly higher mean density of 596.2 HU. However, the best proportion of bioceramics has yet to be determined by further research.
In this study, the ossification of anchors was better than that of implants of the same material in previous studies. The main reasons include the following. First, we proposed a method for the quantitative assessment of ossification (ie, the QOQS). Second, previous studies did not use quantitative assessments of the HU value but used subjective judgment by researchers. They may consider light trabecular bone to be nonossified tissue, resulting in a low ossification area. Third, we performed 3-dimensional multiplanar reconstruction using thin-slice CT data. The adjusted sagittal plane perpendicular to the long axis of the anchor tunnels and the adjusted coronal and cross-sectional planes along the long axis were displayed entirely.
The OQS is a semiquantitative method for assessing implant resorption and osteoconductivity and has been widely used in previous studies. However, the OQS is based on the subjective judgment of morphological characteristics, which requires rich clinical experience and histological knowledge. The average reported interobserver agreement is 0.616 (0.257-0.895), 13,20,24,27 which is relatively low and indicates inconsistency. Moreover, the grading system does not consider tunnel widening. In the present study, the QOQS is determined based on HU values. HU values >150 were considered to indicate ossified tissue, 6,21 and those <150 were recognized as unossified tissue. The QOQS was graded according to the proportion of the unossified area to the tunnel area (Table 2). The tunnel area was defined as the length of the anchor multiplied by the diameter. Therefore, determining the QOQS through an accurate unossified ratio is a more objective and repeatable method.
In previous studies, multiplanar images obtained after reconstruction consisted of coronal, sagittal, and transverse views of the shoulder rather than the anchor tunnels. 17 As a result, the coronal and cross-sectional planes on CT were not along the long axis of the anchor tunnels, and the sagittal plane was not perpendicular to the long axis, which could lead to measurement errors. To overcome the above problem, we performed multiplanar reconstruction of the anchor tunnels rather than the shoulder joint. The tunnels were displayed completely, thereby minimizing measurement errors.
The ossification rates of anchor tunnels were 94.54% and 90.91% in the anterosuperior and anteroinferior aspects, respectively. The remaining aspects showed a 100.00% ossification rateexcept the posterosuperior aspect with 0.00%. However, the ossification rate of the anchor tunnels was compared between the anterior area and other areas in a published study, and no significant difference was found. 20 We speculate that the anterior aspect of the glenoid bears more mechanical force, thus slowing down bone ingrowth.
Cortical defects remained at 2-year follow-up, while cancellous bone had healed in some anchors. The healing of cortical bone is often slower than that of cancellous bone. Another possible reason is that joint fluid immersion affects cortical bone healing. At 2 years after surgery, only 3 anchors showed tunnel enlargement, which could be considered a low rate. Previous studies in the literature have pointed out that tunnel enlargement might be associated with the process of anchor biodegradation and mechanical stress. 11
Limitations
First, because the anchor tunnels had been partially or entirely replaced by bone, it was difficult to accurately determine the edge of the tunnel. Therefore, some measurement errors may have occurred. Second, many patients came from other cities, and they did not come to our hospital for follow-up after they had recovered; thus, some patients lacked CT scans from 2 years after surgery. Third, we validated the QOQS by comparing the interobserver agreement with the OQS in previously published studies, which may not be the best validation method. Fourth, the anchors were used in conjunction with a coracoid transfer procedure, which may lessen stress on the anchors compared with Bankart repair. Therefore, the conclusions of this study are not fully applicable to anchors in Bankart repair.
Conclusion
At least 2 years after the coracoid transfer procedure using 85% PLLA/15% β-TCP biocomposite anchors, 12 (9.68%) of 124 anchor tunnels were completely ossified, 60 (48.39%) were almost completely ossified, and 3 were enlarged. The mean HU value of anchor tunnels was significantly higher than that of the preoperative glenoid vault.
Footnotes
Final revision submitted July 29, 2022; accepted September 13, 2022.
One or more of the authors has declared the following potential conflict of interest or source of funding: This study was supported by the Suzhou Health Talent Project (grant GSWS2020033), the National Mentorship Program for Young Health Talents of Suzhou (grant 20042), the National Natural Science Foundation of China (grants 82172423 and 81871770), and the National Key Research and Development Program of China (grant 2018YFF0301100). AOSSM checks author disclosures against the Open Payments Database (OPD). AOSSM has not conducted an independent investigation on the OPD and disclaims any liability or responsibility relating thereto.
Ethical approval for this study was obtained from Peking University Third Hospital (No. M2021132).