
Abstract
Background:
Numerous radiographic measurement methods related to rotator cuff tears (RCTs) have been described. The most widely used of these parameters is the critical shoulder angle (CSA) as measured via radiography. However, magnetic resonance imaging (MRI) measurements provide more accurate results than direct radiography.
Purpose:
To determine the relationship between anatomic shoulder parameters and RCT type via MRI scans.
Study Design:
Cross-sectional study; Level of evidence, 3.
Methods:
The data and physical examination notes of 389 patients were retrospectively analyzed, and 242 patients were included in the study. Patients were divided into 2 groups: those with RCT (n = 127) and those without RCT (control group; n = 115). Using suitable MRI sections, the CSA, lateral acromial angle, acromial index, superior glenoid inclination, acromion–greater tuberosity impingement index, and acromiohumeral distance were compared between the RCT and control groups. The correlation of these shoulder parameters with the presence of RCT was investigated, and the predictive value of each parameter was examined using receiver operating characteristic (ROC) analysis.
Results:
There were significant positive relationships between the presence of RCT and CSA, acromial index, acromion–greater tuberosity impingement index, and superior glenoid inclination, with the strongest correlation belonging to CSA (r = 0.716). There were also significant negative relationships between presence of RCT and lateral acromial angle (r = –0.510) and acromiohumeral distance (r = –0.222). The ROC analysis revealed CSA to be the best predictor for the presence of RCT (area under the ROC curve = 0.899).
Conclusion:
The study outcomes showed that CSA as measured on MRI is the best predictor for determining the presence of RCTs. In patients with shoulder pain attributed to RCT, it may be helpful to examine the CSA on MRI.
Keywords
The rotator cuff is active in all shoulder functions, and rotator cuff tears (RCTs) are one of the most common causes of shoulder pain. RCT incidence increases with advancing age. 22 Many studies have been conducted to examine RCT treatment and diagnosis and to evaluate the results of shoulder scans and RCT treatment. 2 –5,11 Radiological measurement methods in recent studies have been developed to investigate factors that may contribute to degenerative RCTs. 18 Numerous radiographic measurement methods have been described in the extant literature related to RCTs. 1,3,19,20 One of the most commonly used measurements in shoulder surgery is the critical shoulder angle (CSA). Moor et al, 24 investigating the relationship between lateral extension of the acromion and shoulder diseases, stated that a CSA >35° is a risk factor for RCT and a CSA <30° is a risk factor for glenohumeral arthritis. The acromial index (AI), which was introduced by Nyffeler et al 26 and gives a value to the acromial extension, is another important parameter for detecting RCTs. Banas et al 1 stated that higher lateral acromial angles (LAAs) appearing in coronal oblique magnetic resonance imaging (MRI) are associated with subacromial diseases. Yet, the acromiohumeral distance (AHD) decreases after superior migration of the humerus because of RCT. 20 Superior glenoid inclination (SGI) is one of the most recent and up-to-date parameters recommended for detecting RCTs, and it can be measured via MRI. 3 Finally, Liu et al 19 found that a new radiographic measurement method, the acromion–greater tuberosity impingement index (ATI), is associated with degenerative RCTs.
MRI provides more detailed information to shoulder surgeons than tomography and shoulder radiography in terms of imaging soft tissue patterns, size of RCT, retraction, and fatty infiltration. 21,25 Therefore, MRI has become more reliable than direct radiography for preoperative planning in rotator cuff repair. 26 New MRI examination parameters have been presented for RCT diagnosis. 19 However, though many studies have investigated the measurement parameters for RCT diagnosis, controversial issues remain in the literature. 4,18,23,24 For instance, one of the most reported topics relates to the relevance of CSA in RCT diagnosis, but conflicting accounts continue to be published. 4,18,23,24 In many studies, factors such as tear size and various measurements have not been evaluated together. There are insufficient data in the literature that compares multiple parameters together to diagnose RCTs. Therefore, we wanted to ask whether the measurement of a specific anatomic shoulder parameter in MRI is effective in detecting degenerative RCTs or the tear size. The purpose of this study was to determine the relationship between anatomic shoulder parameters and RCT, including tear size, via MRI scan. We hypothesized that some of these parameters can be more helpful for RCT classification.
Methods
Ethics approval of the study protocol was received from our institution, and all study steps were designed according to good clinical practice and the Declaration of Helsinki recommendations. As the study employed a retrospective design, informed consent was not obtained from the participants.
Patient Selection and Grouping
The data and physical examination notes of 389 patients were retrospectively analyzed. Patients who had received MRI scans at our hospital between 2017 and 2020 were considered for inclusion in this study. Patients with a history of trauma, neurological deficits, scapular fracture sequela, or cysts or masses on the humeral or glenoid bone were excluded, as were those who had undergone prior surgery on the affected shoulder. To avoid false MRI measurements, patients with Hamada stage 2-4 glenohumeral osteoarthritis were also excluded. After screening, 340 patients remained eligible. Of the 340 MRI scans, 98 were excluded, leaving a study sample of 242 patients. All patients included in the study had undergone physical examination by 2 study authors (A.G. and R.Ö.).
Patients were divided into 2 groups: those with RCT and those without RCT (control). Patients in the RCT group were divided into 3 subgroups based on the size of the RCT: partial-thickness tear, full-thickness tear, and massive tear (>5 cm). The diagnosis of partial tears was made per the Elman definition, 8 and articular- and bursal-sided tears, but not intratendinous tears, were included in the partial-tear group. Massive tears were considered as those >5 cm, 6 or complete tears of ≥2 tendons. 10
MRI Measurements
Shoulder examinations were evaluated with a 1.5-T MRI device (SIGNA Explorer; General Electric). Angle measurements were made on coronal T1-weighted sequence images at the radiology workstation (Sectra Workstation IDS7). The parameters for the T1-weighted sequence images were as follows: repetition time/echo time = 608/10.4 ms, field of view = 170 mm, section thickness = 4 mm, cross section = 4 mm, number of excitations = 4, matrix = 256 × 160. All scans were taken with the patients in the supine position, with the arm fixed in abduction and the palm of the hand in the medial neutral position. In this way, we ensured the standardization of the shots. All measurements were made on the workstation by magnifying the image 4 times.
Shoulder Parameters
The CSA, LAA, ATI, SGI, AI, and AHD measurements were performed on coronal view MRI scans by 2 shoulder surgeons who are experienced in their field (A.G., R.O.). These 2 observers were blinded with regard to control and patient groups. They independently performed the measurements at different time points (1 month apart), and we calculated the intra- and interobserver reliabilities for all measurements.
CSA was calculated as reported by Moor et al. 24 The equation depended on a line connecting the superior and inferior boards of the glenoid fossa and an additional line from the inferior board of glenoid to the lateral board of the acromion (Figure 1A). LAA was calculated per Banas et al. 1 The measurement was made via a line parallel to the lateral surface of the glenoid and a line along the undersurface of the acromion (Figure 1B). ATI was a ratio of the distance from the center of the humeral head’s rotation point to the tuberculum majus by the distance from the center of the humeral head’s rotation point to the acromion’s inferior line 19 (Figure 1C). AI was calculated according to Nyffeler et al. 26 AI is the ratio of the distances from the most lateral point of the acromial extension and the most lateral point of the proximal humerus to the straight line that connects the glenoid inferior and superior rims (Figure 1D). The SGI was calculated as reported by Chalmers et al. 3 It was based on the angle between the superior border of the supraspinatus fossa and the line of the glenoidal fossa (Figure 1E). The AHD was the measure of the distance between the parallel line drawn from the inferior end of the acromion and the parallel line tangent to the humeral head (Figure 1F), as described by Werner et al. 29

(A) Critical shoulder angle, (B) lateral acromial angle, (C) acromion–greater tuberosity impingement index, (D) acromial index, (E) superior glenoid inclination, and (F) acromiohumeral distance.
Statistical Analysis
Continuous variables are reported as mean and standard deviation, as well as median and range, and categorical variables as frequencies and percentages. The inter- and intraobserver reliabilities of the MRI measurements were assessed with the intraclass correlation coefficient, where <0.5 indicated poor reliability, 0.5 to 0.75 average reliability, 0.76 to 0.9 good reliability, and >0.90 excellent reliability.
Demographic data and outcome parameters were compared between the RCT and control groups. The normality of continuous data was tested using the Kolmogorov-Smirnov test when the number of patients was >50 and the Shapiro-Wilk test when <50. When parametric test assumptions were met, the significance test of the difference between 2 means and 1-way analysis of variance (post hoc Tukey test) were used to compare differences between independent groups. When parametric test assumptions were not met, the Mann-Whitney U test and Kruskal-Wallis variance analysis (post hoc Mann Whitney U test with Bonferroni correction) were used to compare differences between independent groups.
Due to the nonnormal distribution and ordinal data structure, the relationships between continuous variables and the presence of RCT were analyzed using Spearman correlations. We investigated the relationship between shoulder parameters and tear size (partial thickness, full thickness, or massive) using Kruskal-Wallis variance analysis. We used receiver operating characteristic (ROC) curve analysis to examine the predictive power of each shoulder parameter for differentiating between the presence and absence of RCT. For all analyses, P < .05 was considered statistically significant. The data were analyzed with SPSS Version 25.0 (IBM).
Results
The mean age of the participants was 52.43 ± 12.18 years; 127 (52.5%) patients were female; and the most common RCT type was full thickness (25.2%). Table 1 summarizes the patients’ demographic data.
Demographical Characteristics of the Study Patients (N = 242)
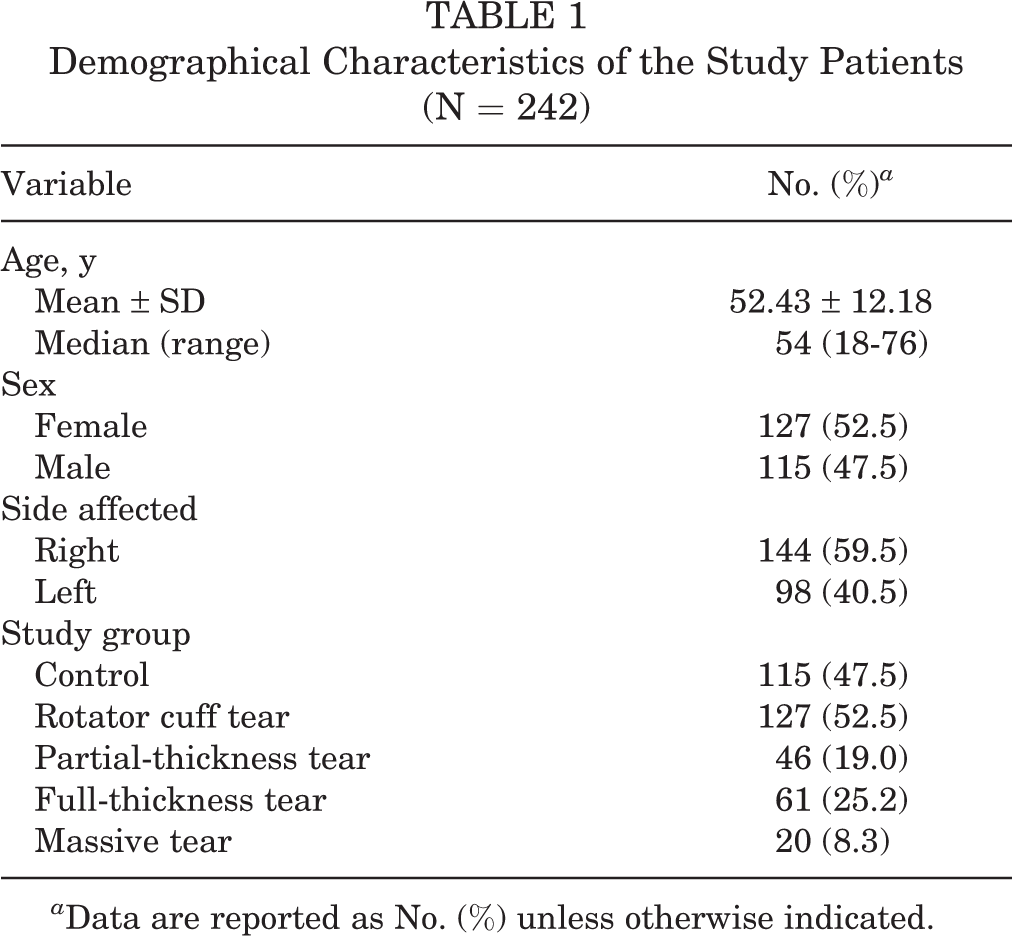
a Data are reported as No. (%) unless otherwise indicated.
The intraclass correlation coefficients were between 0.88 and 0.92 for all MRI measurements, indicating good to excellent inter- and intrarater reliability. Significant positive relationships were found between CSA, AI, ATI, and SGI and the presence of RCT, with CSA having the strongest correlation (r = 0.716; P < .001). There were also significant negative relationships between the presence of RCT and the LAA (–0.510) as well as AHD (–0.222; P < .001 for both) (Table 2).
Evaluation of the Relationship Between Shoulder Parameters and the Presence of RCT a

a AHD, acromiohumeral distance; AI, acromial index; ATI, acromion–greater tuberosity impingement index; CSA, critical shoulder angle; LAA, lateral acromial angle; RCT, rotator cuff tear; SGI, superior glenoid inclination.
b Each correlation was statistically significant (P < .05; Spearman correlation analysis).
When the shoulder parameter measurements were compared between the RCT and control groups, a significant difference was found for all parameters: CSA (P = .0001), AI (P = .0001), LAA (P = .0001), ATI (P = .013), AHD (P = .026), and SGI (P = .0001) (Table 3). In the CSA, AI, ATI, and SGI examinations, the measurements were significantly lower in the control group than in the RCT group. Yet, in the LAA and AHD examinations, the measurements were significantly higher in the control group than in the RCT group.
Comparison of Shoulder Parameters Between the RCT and Control Groups a
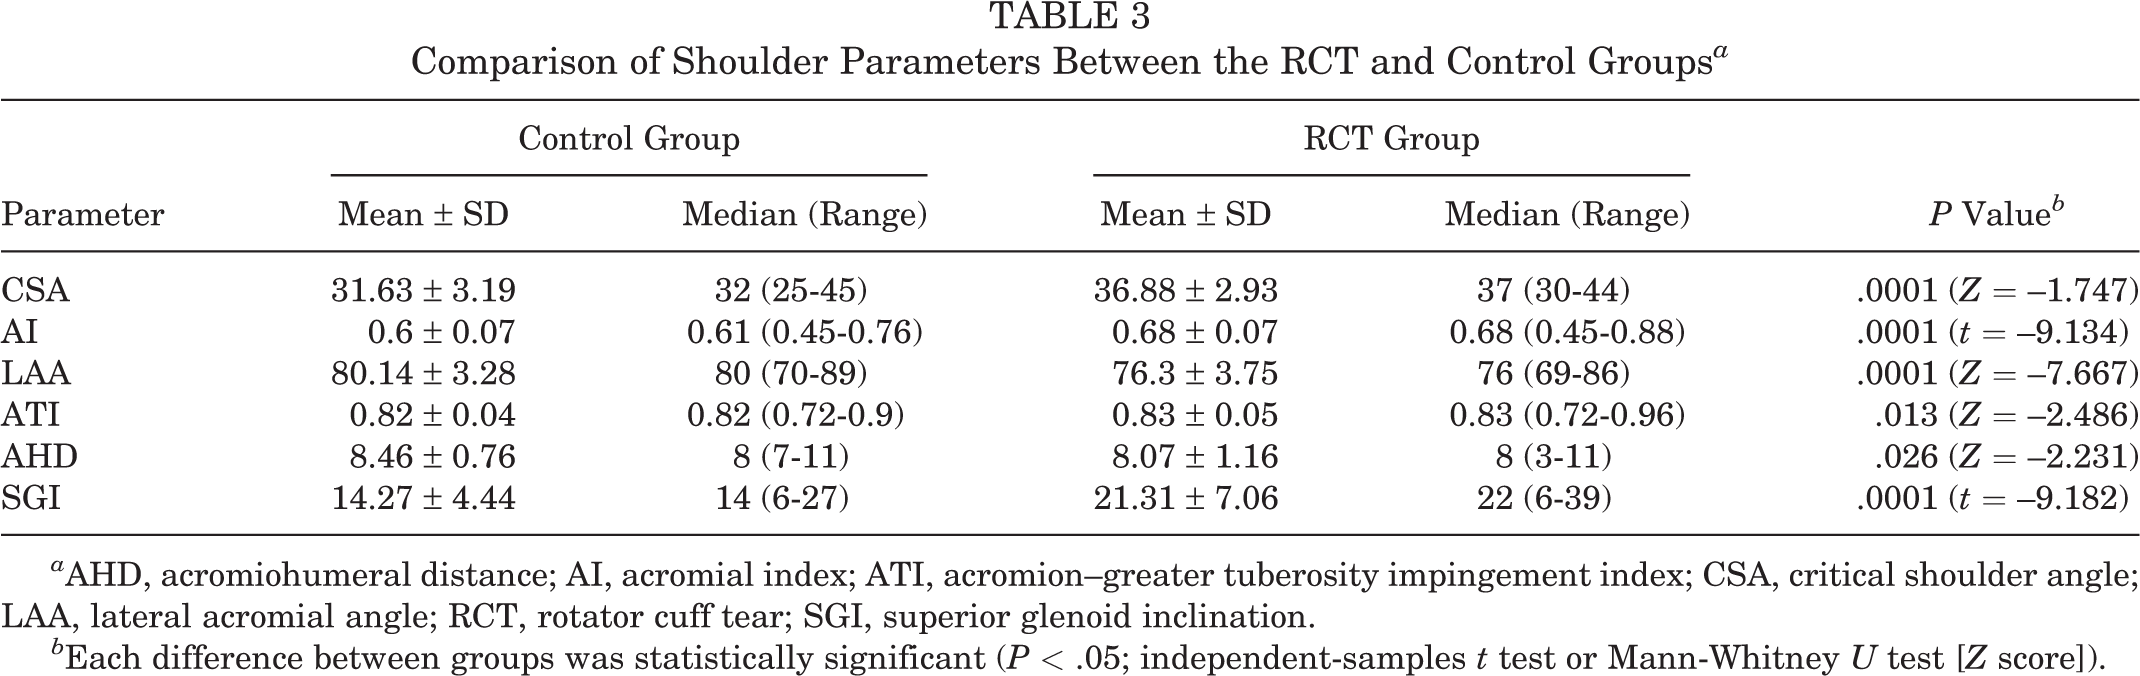
a AHD, acromiohumeral distance; AI, acromial index; ATI, acromion–greater tuberosity impingement index; CSA, critical shoulder angle; LAA, lateral acromial angle; RCT, rotator cuff tear; SGI, superior glenoid inclination.
b Each difference between groups was statistically significant (P < .05; independent-samples t test or Mann-Whitney U test [Z score]).
In the multiple comparisons between the control group and the partial-thickness, full-thickness, and massive tear subgroups, there were statistically significant differences for all parameters as compared with the control group (Table 4).
Comparison of Shoulder Parameters Among the Control Group and Tear Size Subgroups a

a AHD, acromiohumeral distance; AI, acromial index; ATI, acromion–greater tuberosity impingement index; CSA, critical shoulder angle; KW, Kruskal-Wallis; LAA, lateral acromial angle; SGI, superior glenoid inclination.
* Statistically significant difference between b control and partial-thickness tear, c control and full-thickness tear, d control and massive tear, e partial-thickness and massive tear, and f full-thickness and massive tear (P < .05; 1-way analysis of variance [F test] or KW variance analysis).
The results of the ROC analysis and post hoc analysis are shown in Figure 2. According to the results, CSA best determined the presence of RCT (area under the ROC curve = 0.899) (Table 5). The other scores were discriminatory, albeit at a lower level.

Receiver operating characteristic curve analysis for predictive power of shoulder parameters for the presence of rotator cuff tear. AHD, acromiohumeral distance; AI, acromial index; ATI, acromion–greater tuberosity impingement index; AUC, area under the curve (receiver operating characteristic); CSA, critical shoulder angle; LAA, lateral acromial angle.
Effectiveness of Shoulder Parameters to Determine the Presence of Rotator Cuff Tear a

a AHD, acromiohumeral distance; AI, acromial index; ATI, acromion–greater tuberosity impingement index; AUC, area under the curve (receiver operating characteristic); CSA, critical shoulder angle; LAA, lateral acromial angle; SGI, superior glenoid inclination.
b Each AUC was statistically significant (P < .05).
Regarding tear sizes, CSA, AI, LAA, and SGI had diagnostic value for distinguishing partial-thickness, full-thickness, and massive RCTs. However, the ATI and AHD could distinguish only massive RCTs (Table 6).
Effectiveness of Shoulder Parameters to Predicting Tear Size a

a AHD, acromiohumeral distance; AI, acromial index; ATI, acromion–greater tuberosity impingement index; AUC, area under the curve (receiver operating characteristic); CSA, critical shoulder angle; LAA, lateral acromial angle; SGI, superior glenoid inclination.
b Statistically significant (P < .05).
Discussion
The study findings showed that CSA is the best predictor for determining the presence of RCTs (area under the ROC curve = 0.899). The power analysis was performed as applied to the results at the end of our study (postpower): according to the lowest correlation coefficient obtained with the RCT and ATI (r = 0.212), we calculated that our study reached 91.9% power at the 95% confidence level. Meanwhile, CSA, AI, LAA, and SGI had diagnostic value for distinguishing partial-thickness, full-thickness, and massive RCTs (P < .05). Yet, the ATI and AHD could distinguish massive RCTs only.
Most of the previous studies investigating the relationships between RCT and its diagnostic radiological measurement parameters were conducted with CSA, as CSA is one of the most frequently used RCT diagnostic parameters. 9,16,17,24 CSA has been associated with RCTs, but most of these studies were done on radiographic measurements. 5 In contrast, MRI is almost routinely performed to detect the size, retraction, and accompanying pathologies of RCTs. 22 Gerber et al 10 suggested that these angles may be indicators of RCTs. However, one of the biggest handicaps in this regard is the possibility of inadequate shoulder/arm position on direct radiographs and therefore incorrect measurements. Chalmers et al 5 reported that in their samples, CSA could be measured accurately in only 21% of 1522 radiographs, and the radiography allowed measurements of limited quality. Recent studies of CSA have emphasized that the malrotation that occurs with direct radiographs may deviate >2° from a 20° change, which may invalidate the CSA measurement. 28 In a systematic review, Zaid et al 31 examined 660 studies, analyzing the relationship between anatomic shoulder parameters and shoulder pathologies on direct radiographs. They concluded that the parameters based on tomographic and MRI measurements were sufficient. They also stated that there is a limited number of studies on this subject and that these parameters should be explained in large series. In the current study, CSA was determined to be an effective parameter for differentiating between control shoulder MRI scans and RCTs. It was additionally found to discriminate among partial-thickness, full-thickness, and massive RCTs.
AI is derived on the basis that increased lateral expansion of the acromion increases the rotator cuff load. 26 This parameter, which is suggested to be effective for recognizing early rotator cuff degeneration, is significantly higher in patients with RCT. Another prediction is that functional scores are worse in patients with high AI values. 17 On the contrary, Hamid et al 13 suggested that AI is not effective for determining the presence of RCTs. The current study found that AI has different predictive quality across different RCT patterns. AI was insignificant at differentiating between full-thickness and massive RCTs. However, it was an effective parameter for differentiating control and partial-thickness, control and full thickness, control and massive, partial and full thickness, and partial and massive images (P < .05) (Table 4). AI is the parameter with the highest diagnostic value after CSA in the differentiation of control and full-thickness tears.
Like the hook shape of the acromion, SGI in scapular morphology is associated with RCT and superior migration of the humerus. 26 CSA is measured using the glenoid inclination. 3,27 The SGI parameter has been described in connection with RCTs, and Daggett et al 7 found that CSA and glenoid inclination are associated in the diagnosis of massive RCTs. In the current study, although SGI was determined to be insignificant for distinguishing partial- and full-thickness RCTs, it was significant for distinguishing control and partial-thickness, control and full thickness, control and massive, partial and massive, and full thickness and massive images (P < .05) (Table 4). Moreover, it has been found to have the best diagnostic value after CSA in the differentiation of control and partial tears.
Studying MRI LAA measurements, Banas et al 1 stated that the LAA is related to RCTs. After examining 1000 cases, Heuberer et al 14 reported that CSA is a better diagnostic parameter than AI or LAA. Yu et al 30 reported that the mean lateral acromion angle was significantly smaller in geriatric patients with full-thickness RCTs as compared with geriatric healthy participants. In the current study, LAA was insignificant at differentiating partial- and full-thickness images and full-thickness and massive images. However, it was an effective parameter for differentiating control and partial-thickness, control and full thickness, control and massive, and partial thickness and massive images (P < .05) (Table 4). Therefore, it did not have as strong a diagnostic value as CSA and AI in distinguishing partial- and full-thickness RCTs.
There are new studies related to RCT, and new parameters such as ATI are being put forward. 24 Liu et al 19 suggested that ATI is a strong marker for detecting degenerative RCTs. In the current study, although ATI was an insignificant parameter for differentiating control and partial-thickness, control and full thickness, and partial and full thickness images, it was effective at distinguishing control and massive, partial and massive, and full thickness and massive images (P < .05) (Table 4). This finding can be effective for planning the treatment of massive RCTs attributed to the reduced AHD in massive RCTs.
The AHD is the distance between the acromion and the humeral head. Goutallier et al 12 stated that an AHD <6 mm in the true anteroposterior shoulder radiographs of symptomatic patients may be associated with RCT size (isolated supraspinatus or subscapularis, supra- plus infraspinatus, supraspinatus plus subscapularis, or 3 tendons). The AHD decreases because of the superior migration of the humeral head in RCTs. This reduction in the subacromial space is a risk factor for tendinopathy. Hufeland et al 15 found that AHD calculations in MRI scans are 1.2 ± 2.1 mm (13%) lower than those in radiography, and they recommended that these calculations not be used as a decision criterion for evaluating glenohumeral centering. In the current study, the AHD was effective in distinguishing only massive tears from others (P < .05) (Table 4). Also, AHD was the parameter with the highest diagnostic value after CSA in distinguishing massive tears.
Strengths and Limitations
A strength of this study was that each shoulder parameter was individually evaluated to determine its performance for distinguishing control shoulder images and RCTs, as well as its performance for distinguishing RCT types. Yet, this study’s retrospective design and relatively low number of cases from different RCT subtypes were its limitations. The fact that it was evaluated by 2 shoulder surgeons can be considered another limitation. Although morphological differences were examined in the study, functional status was not. To evaluate morphological status as a predisposing factor for RCT, further studies with prospective functional status are needed. RCT was consistent with the intraoperative tear sizes and types observed in these patients. However, these results could not be presented, as this study focused on MRI measurement results.
Conclusion
The study outcomes show that CSA through MRI scanning is the best predictor for determining the presence of RCTs. Meanwhile, CSA, AI, LAA, and SGI had diagnostic value for distinguishing partial-thickness, full-thickness, and massive RCTs. However, ATI and AHD could distinguish only massive RCTs. In patients with shoulder pain who are considered for RCT, it may be helpful to perform a tear scan on MRI and examine the CSA, which is the best predictor measurement.
Footnotes
Final revision submitted May 25, 2022; accepted August 2, 2022.
The authors declared that there are no conflicts of interest in the authorship and publication of this contribution. AOSSM checks author disclosures against the Open Payments Database (OPD). AOSSM has not conducted an independent investigation on the OPD and disclaims any liability or responsibility relating thereto.
Ethical approval for this study was obtained from Alaadin Keykubat University (No. 10354421-2020/19).