
Abstract
Objective:
The first objective of this study is to determine the reference Tibial Tubercle-Trochlear Groove (TT-TG) distance on MRI in Southern Chinese population. The second objective is to investigate the correlation between TT-TG distance and (i) age, (ii) sex, (iii) height, (iv) weight and (v) Body Mass Index (BMI) respectively.
Method:
Three hundred MRI knees performed in two different centres between August 2017 and October 2018 were included. All patients were prospectively recruited after MRI referral from Orthopaedics department. The TT-TG distances were measured by two radiologists independently. Measurement reliability was assessed using intraclass correlation coefficient (ICC). One sample t-test was used to compare the results between this study and other published studies. Spearman’s rank correlation coefficient was used to determine correlations between the TT-TG distance and age, sex, height, weight and BMI respectively.
Result:
There was no statistical significance between the mean of TT-TG distances from the two radiologists (P-value = 0.32). The measurement reliability was excellent (ICC = 0.922 ± 0.02). The mean of averaged TT-TG distance was 8.32 ± 0.33 mm (range 2.01 to 17.48 mm). There were no statistical significant differences in means of TT-TG distance between laterality and gender. There were statistically significant correlations between (i) TT-TG distance and age (p-value = 0.009), and (ii) TT-TG distance and height (p-value = 0.014).
Conclusion:
The reference TT-TG distance on MRI in Southern Chinese population was 8.32 ± 0.33 mm. Statistically significant correlations were established between (i) TT-TG distance and age; and (ii) TT-TG distance and height.
Keywords
Introduction
Tibial Tubercle-Trochlear Groove (TT-TG) distance is an important parameter to assess the degree of external tibial torsion and lateralisation of the tibial tubercle. It has been validated in multiple studies and has been shown to be a prognostic value in predicting patellar instability and guide surgical decision. 1 TT-TG distance greater than 20 mm is considered as abnormal in Caucasian population. 1 There are many studies which had shown different reference values for different ethnicities. 1,2,5 –8 The first aim of this study is to determine the reference TT-TG distance on Magnetic Resonance Imaging (MRI) in Southern Chinese population. The second aim is to investigate the correlation between TT-TG distance and (i) age, (ii) sex, (iii) height, (iv) weight and (v) Body Mass Index (BMI) respectively.
Method and materials
Patient population
The study was approved by the ethics committee of HKEC (HKECREC-2020-034).
Patients who had MRI of knee in Hong Kong East Cluster (Pamela Youde Nethersole Eastern Hospital (PYNEH) and Ruttonjee & Tang Shiu Kin Hospital (RTSKH)) between 1 August 2017 and 31 October 2018 were prospectively recruited. Those with known patellar instability, ligamentous laxity, mal-alignment including varus osteoarthritis of more than 10 degree or flexion contracture were excluded.
Image acquisition
The MR images were obtained using a 1.5-Tesla SIEMENS Avanto scanner in PYNEH and a 1.5-Tesla SIEMENS Aera scanner in RTSKH respectively. The parameters of both MR scanners were the same as follows: TR 4700 milliseconds (ms), TE 44 ms, slice thickness 4 millimetres (mm) and Field of View (FOV) 320 × 320 mm. Both MR scanners were from the same brand with same magnetic field strength. There was no difference in image quality between the MR scanners. The images were performed with the knee in full extension and the quadriceps relaxed.
Quantitative image analysis
All the MR images were reviewed in CARESTREAM software (Figure 1). The TT-TG distance was determined in fat suppressed proton density turbo spin echo axial sequence. It was measured as described by Schöttle et al. 9 The first axial craniocaudal image depicting a complete cartilaginous trochlea was used to determine the deepest point within the trochlear groove. A line was drawn through the deepest point of the trochlear groove perpendicular to the posterior condyle tangent. A second line was drawn parallel to the trochlear line through the most anterior portion of the tibial tubercle. The distance between these two parallel lines in millimetres (mm) represented the TT-TG distance. The TT-TG distance of each knee was measured by two radiologists independently.
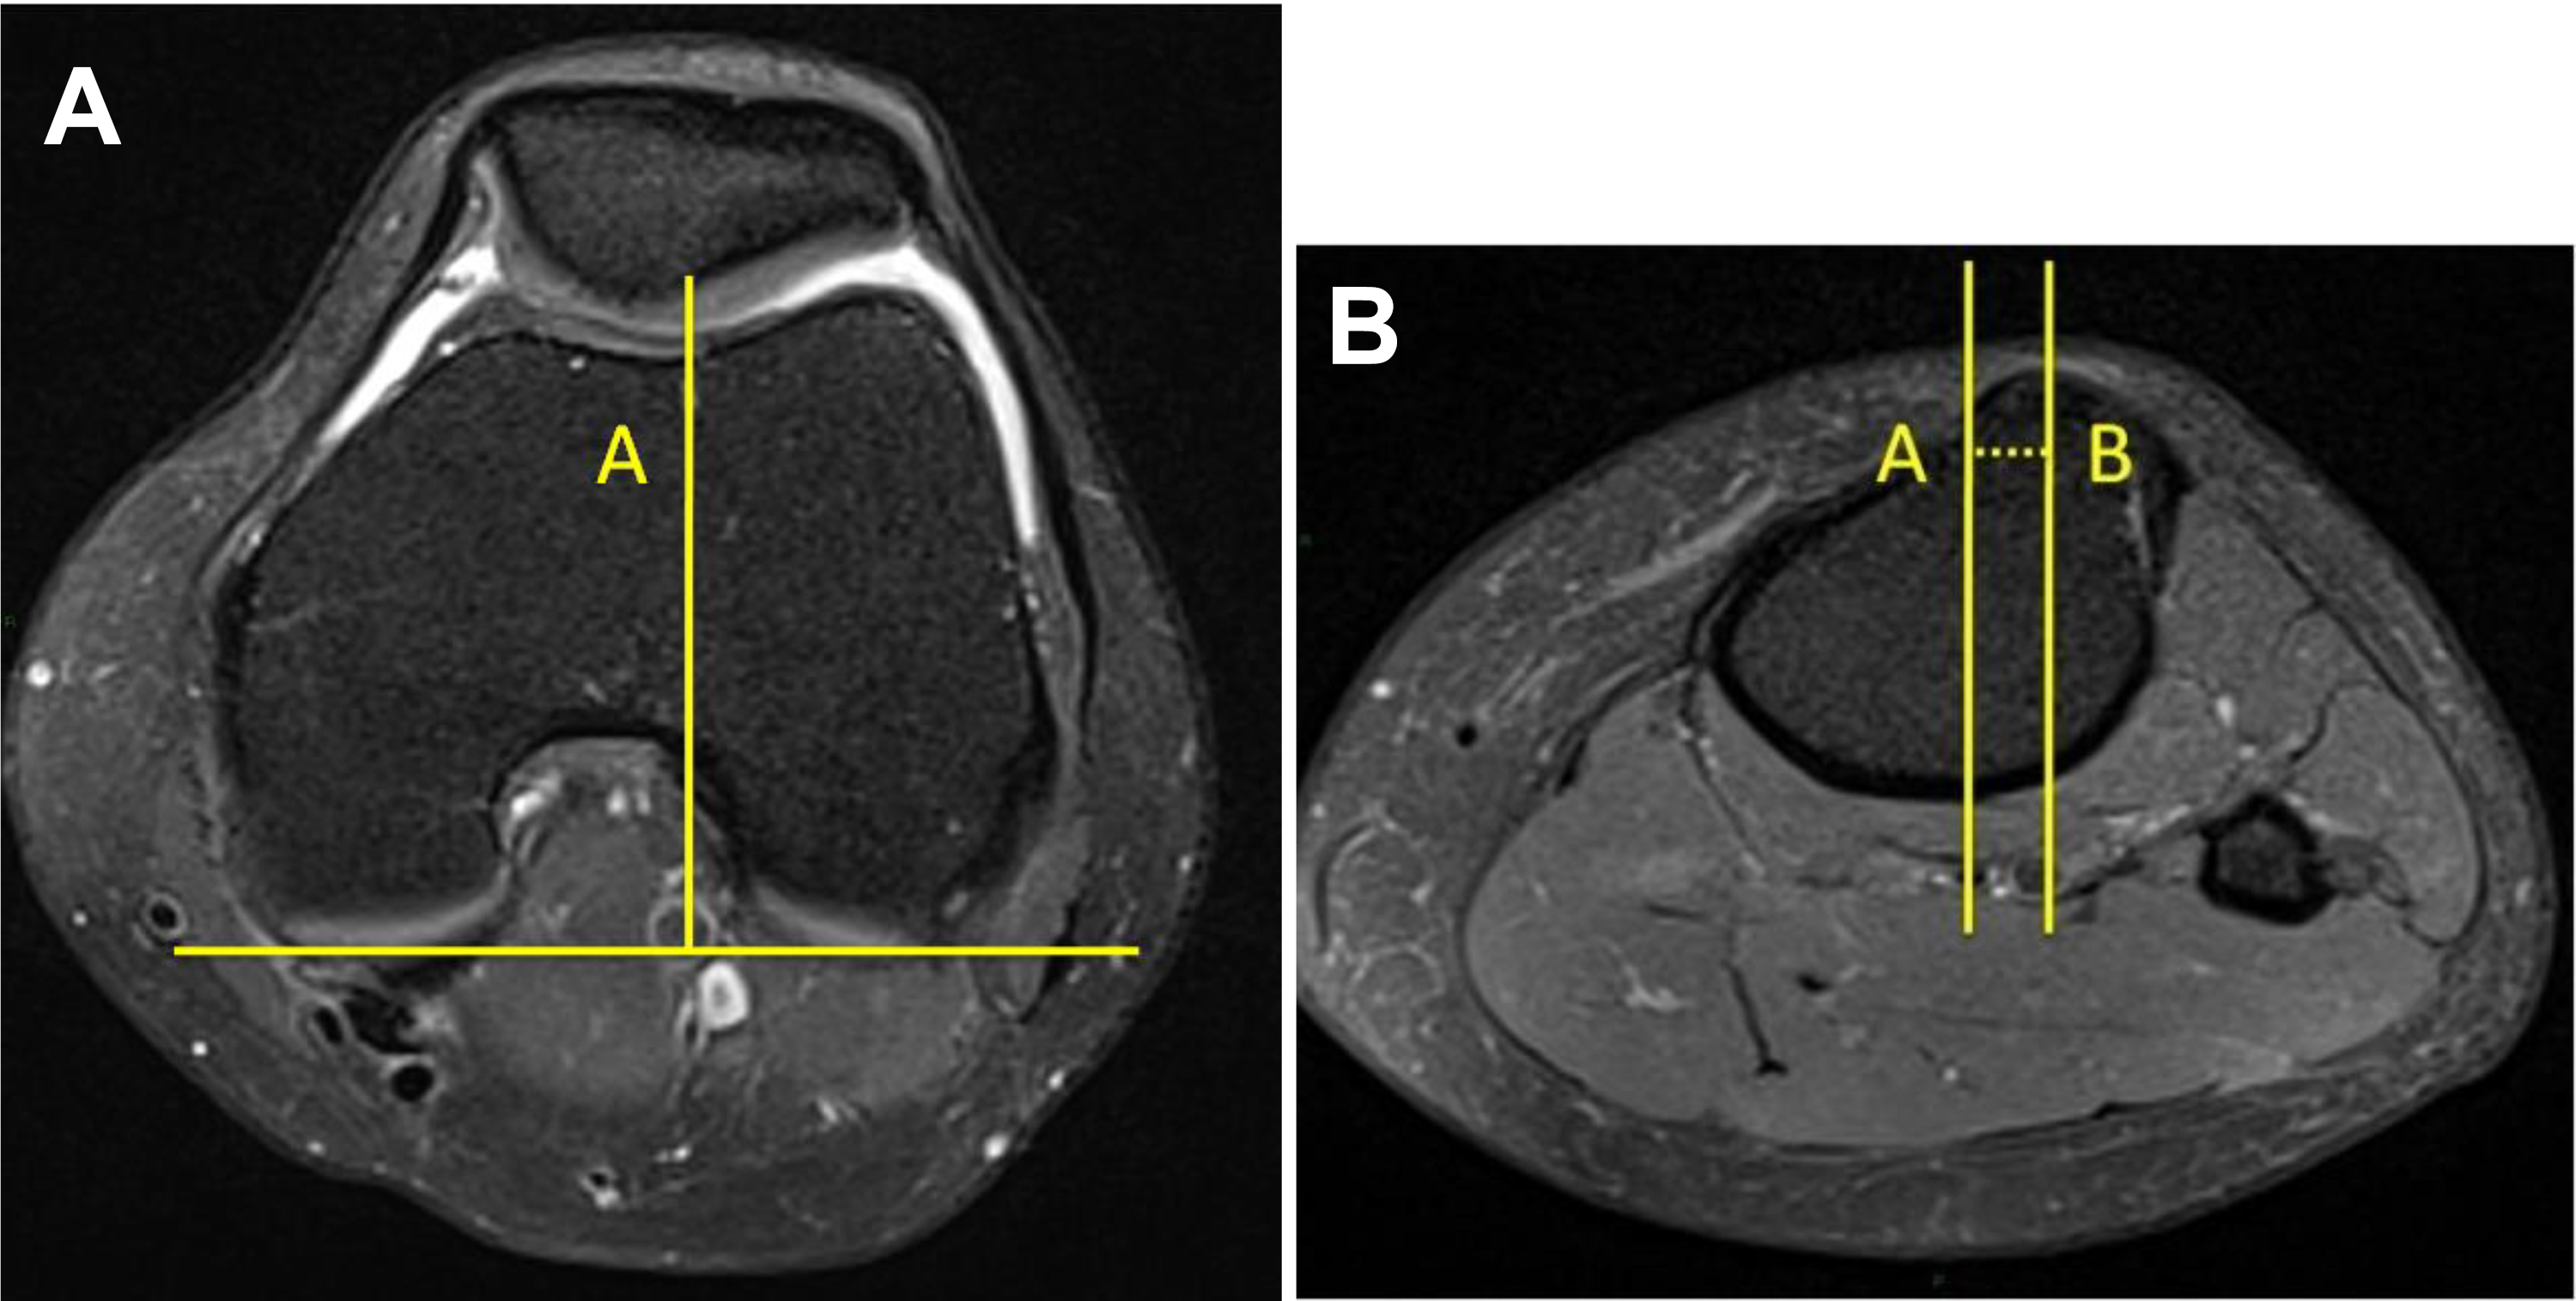
Measurement of tibial tubercle-trochlear groove (TT-TG) distance. The first line (A) went through the deepest point of the trochlear groove, perpendicular to the posterior condyle tangent. The second line (B) was drawn parallel to line (A) through the most anterior point of the tibial tubercle. The distance (dash line) between lines (A) and (B) represented TT-TG.
Statistical analysis
Patient’s age, sex, height and weight at the time of scan were retrieved. Statistical analysis was performed in SPSS (version 16.0 for Windows, SPSS Inc, Chicago, Illinosis, USA). Measurement reliability was assessed using intraclass correlation coefficient (ICC). Paired t-test was used to analyse any differences between the two sets of TT-TG distance obtained from the two radiologists. One sample t-test was used to compare the results between this study and other studies. Spearman’s rank correlation coefficient was used to determine correlations between the TT-TG distance and age, sex, height, weight and BMI respectively. P-value less than 0.05 was considered statistically significant. The results are displayed in terms of mean ± confidence interval unless specified.
Results
A total of 300 MRI examination of knees were performed in 287 patients consecutively with age equal or above 18 years old. Of whom 13 had MRI scans of both knees. 25% of MRI was referred for non-specific knee pain. Another 25% was referred for suspected meniscal tear or cartilage injury. Suspected ligament or tendon injury accounted for 20% of indication. Remaining 30% included various indications such as inflammation, infection, degeneration or suspected tumour.
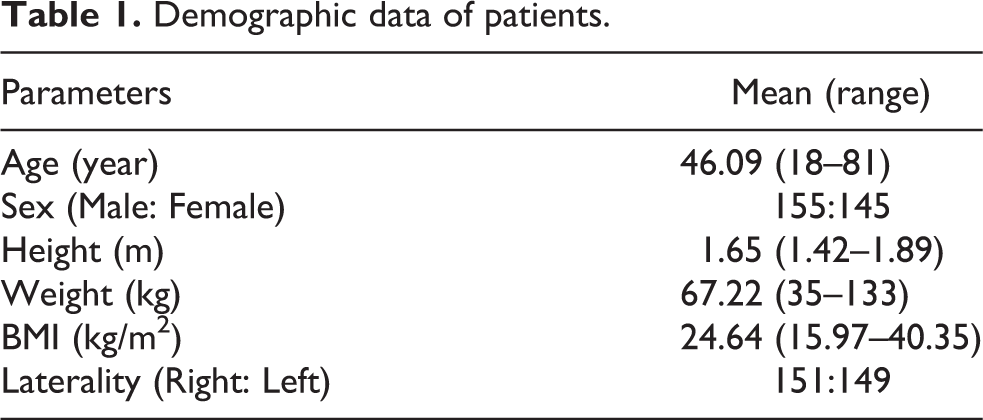
The mean age of patients included was 46.09 years old (range 18 to 81 years old). 51.7% were male. 50.3% of scans were performed on the right knee. The mean height, weight and BMI were 1.65 m, 67.22 kg and 24.64 kg/m2 respectively. Table 1 showed the demographic data of patients.
Demographic data of patients.
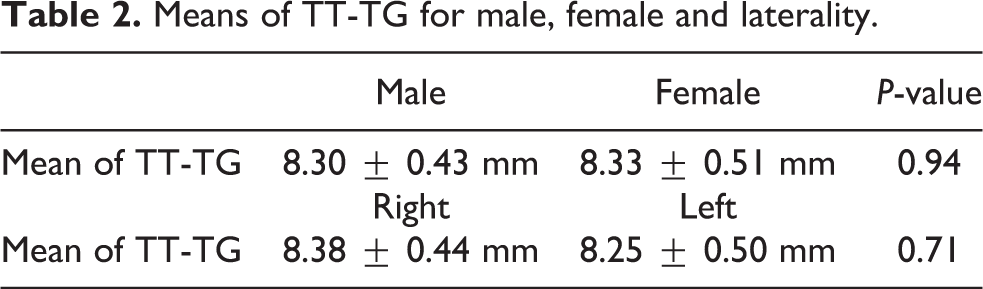
The means of TT-TG distance obtained from the two independent radiologists were 8.44 mm and 8.19 mm respectively. There was no statistical significance (P-value = 0.32). The measurement reliability was excellent (ICC was 0.922 ± 0.02). Therefore, the two sets of TT-TG distance data were averaged. The mean of averaged TT-TG distance was 8.32 ± 0.33 mm (range 2.01 to 17.48 mm). There were no statistical significant differences in means of TT-TG distance between laterality, male and females (Table 2).
Means of TT-TG for male, female and laterality.
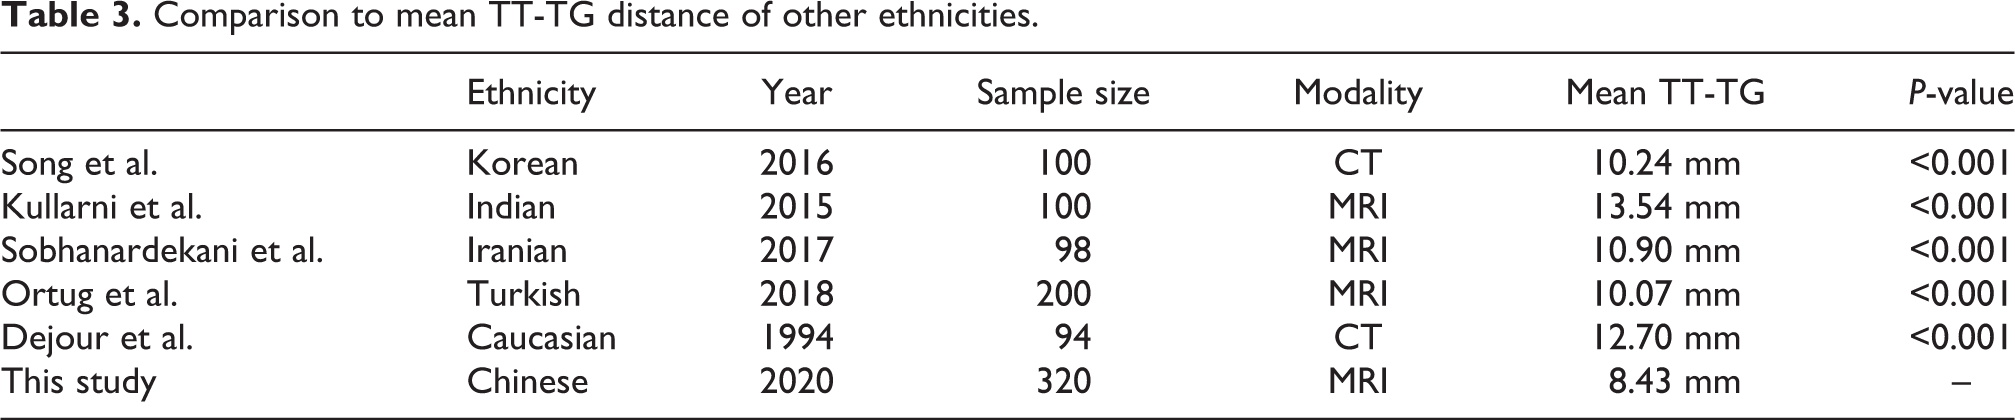
The mean of TT-TG distance from this study was statistically significantly shorter than that published on other ethnicities, including Korean, Indian, Iranian, Turkish and Caucasian. The result was summarized in Table 3.
Comparison to mean TT-TG distance of other ethnicities.
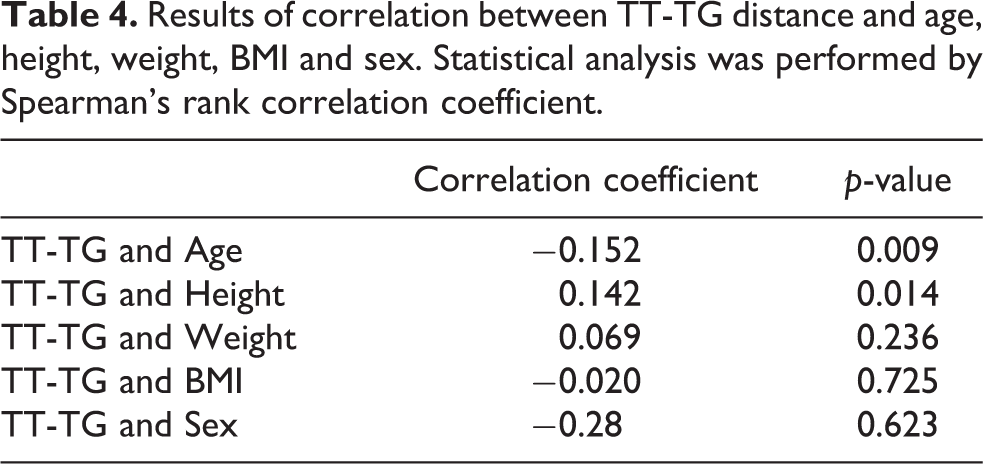
There were statistically significant correlations between (i) TT-TG distance and age (p-value = 0.001), and (ii) TT-TG distance and height (p-value = 0.025). No statistical significance was demonstrated between (i) TT-TG distance and weight (p-value = 0.335), (ii) TT-TG distance and BMI (p-value = 0.671), and (iii) TT-TG distance and Sex (p-value = 0.754). The results were summarized in Table 4.
Results of correlation between TT-TG distance and age, height, weight, BMI and sex. Statistical analysis was performed by Spearman’s rank correlation coefficient.
Discussion
Multiple risk factors for patellar instability have been identified including elevated TT-TG distance, 1 patellar alta and trochlear dysplasia. Various studies have evaluated the normal mean TT-TG distance in different ethnicities. 1,2,5 –8 However, there are limited studies in Southern Chinese population. It is crucial to determine the reference value for Southern Chinese population in order to apply TT-TG distance in clinical practice appropriately. This study has shown that the reference TT-TG distance in Southern Chinese population is statistically significantly shorter than Caucasian and other ethnicities in Asia (Table 3). The differences between these values may be explained by the anthropological difference in skeleton.
This study has also shown statistically significant correlations between (i) TT-TG distance and age, and (ii) TT-TG distance and height. Pennock et al. established TT-TG distance increase as a function of height in paediatric and adolescent patients. 4 Although paediatric and adolescent patients were excluded from this study, correlation between TT-TG distance and height exists in adult and elder age-group. As Spearman’s rank correlation coefficient was used in this study, the correlation could be linear or non-linear. There was also statistical significant correlation between age and height (correlation coefficient = −0.353, p-value <0.001). Further study (such as stratifying age and height) is required to analyse the type of correlation and association between these height, age and TT-TG distance. No significant correlations were found between (i) weight and TT-TG distance; (ii) BMI and TT-TG distance and (iii) sex and TT-TG distance. Possible explanation is that weight is mainly attributed by soft tissue, while BMI is derived from weight. There is also proportional change of skeletons between genders.
TT-TG distance was first measured using Computed Tomography (CT). 10,11 Both CT or MRI can be used to measure the TT-TG distance, and both can identify patient with patellofemoral instability. 12 A number of studies have proven that TT-TG distance measured on CT is significantly greater than those measured on MRI. 10,11,13 Potential causes include MRI distortion and knee flexion. 10 11,13 Padding was placed between the knee and coils to minimize motion during MRI, which resulted in knee flexion as cited by Camp et al. 13 Hinckel et al. proposed that clinical effect of MRI distortion was not significant and knee flexion may attribute to the differences in some extent. 10
It is predicted that MRI will be more widely available in the near future. There are advantages of MRI over CT for knee assessment. MRI provides better cartilage and soft tissue visualization, which is useful for identifying other risk factors for patellar dislocation and pre-operative planning. The centre of patellar tendon could be determined in MRI as well. It better represents the direction of force on patellar tendon as suggested in literatures. 3,9 Last but not least, MRI is free of ionizing radiation. The prevalence of patellar dislocation is higher in paediatrics and adolescent. 13 Radiation is a concern for this group of patients. Nonetheless, some institutions with limited MR resources use CT as the main imaging modality for knee work-up currently. The TT-TG distances from CT or MRI should be interpreted with caution. This should be borne in mind when surgical decision making is based solely on TT-TG distance calculation on MRI.
There were limitations of this study. All patients were referred for MRI scans by the Orthropaedics department. They had indications for MRI including suspected meniscal tear, ligamentous injury, suspected tumour near knee etc. The subjects recruited were not asymptomatic or disease-free. It was difficult to recruit healthy subjects for MRI scan in public institutions. Besides, the cut-off value of TT-TG distance in Southern Chinese population to define tibial tubercle transfer cannot be determined in this study because no patients with history of patellar instability were included in this study. Further study with disease group patients is needed.
Conclusion
This study has established the reference TT-TG distance on MRI in Southern Chinese population to be 8.32 ± 0.33 mm. Statistically significant correlations were demonstrated between (i) TT-TG distance and age; and (ii) TT-TG distance and height.
Footnotes
Declaration of conflicting interests
The author(s) declared no potential conflicts of interest with respect to the research, authorship, and/or publication of this article.
Funding
The author(s) received no financial support for the research, authorship, and/or publication of this article.