
Abstract
Background:
Both coronal- and sagittal-plane knee malalignment can increase the risk of ligamentous injuries and the progression of degenerative joint disease. High tibial osteotomy can achieve multiplanar correction, but determining the precise hinge axis position for osteotomy is technically challenging.
Purpose:
To create computed tomography (CT)–based patient-specific models to identify the ideal hinge axis position angle and the amount of maximum opening in medial opening wedge high tibial osteotomy (MOWHTO) required to achieve the desired multiplanar correction.
Study Design:
Descriptive laboratory study.
Methods:
A total of 10 patients with lower extremity CT scans were included. Baseline measurements including the mechanical tibiofemoral angle (mTFA) and the posterior tibial slope (PTS) were calculated. Virtual osteotomy was performed to achieve (1) a specified degree of PTS correction and (2) a planned degree of mTFA correction. The mean hinge axis position angle for MOWHTO to maintain an anatomic PTS (no slope correction) was 102.6° ± 8.3° relative to the posterior condylar axis (PCA). Using this as the baseline correction, the resultant hinge axis position and maximum opening were then calculated for each subsequent osteotomy procedure.
Results:
For 5.0° of mTFA correction, the hinge axis position was decreased by 6.8°, and the maximum opening was increased by 0.49 mm for every 1° of PTS correction. For 10.0° of mTFA correction, the hinge axis position was decreased by 5.2°, and the maximum opening was increased by 0.37 mm for every 1° of PTS correction. There was a significant difference in the trend-line slopes for hinge axis position versus PTS correction (P = .013) and a significant difference in the trend-line intercepts for maximum opening versus PTS correction (P < .0001).
Conclusion:
The mean hinge axis position for slope-neutral osteotomy was 102.6° ± 8.3° relative to the PCA. For smaller corrections in the coronal plane, more extreme hinge axis positions were necessary to achieve higher magnitudes of PTS reduction.
Clinical Relevance:
Extreme hinge axis positions are technically challenging and can lead to unstable osteotomy. Patient-specific instrumentation may allow for precise correction to be more readily achieved.
The use of medial opening wedge high tibial osteotomy (MOWHTO) to correct both coronal- and sagittal-plane alignment of the knee has become an increasingly utilized approach that confers reproducible improvements in alignment and function with low complication rates. 22 Both coronal- and sagittal-plane malalignment can increase the risk of ligamentous injuries such as anterior cruciate ligament (ACL) and posterior cruciate ligament ruptures, as well as increase the progression of degenerative joint disease. 2- 4,12,36 As such, there has been growing interest in utilizing MOWHTO to correct multiplanar deformities, often in conjunction with cartilage restoration, ligament reconstruction, or meniscal procedures. 8,15,21
Because an increased posterior tibial slope (PTS) has been cited as a risk factor for both primary ACL ruptures and reruptures after ACL reconstruction, many surgeons will consider correcting an abnormal PTS in ACL-deficient knees. 1,5,7,13,15,18,25,36 However, while slope-reducing osteotomy may help to restore normal alignment, the magnitude of slope differences may vary considerably between patients, and slope deformities requiring small or precise changes remain challenging to reproduce. Recently, precise coronal-plane correction has also been identified as an important predictor of early outcomes after MOWHTO, as suboptimal correction may lead to lower postoperative International Knee Documentation Committee scores. 24
The use of patient-specific guides for achieving precise component placement and correction has been applied in other areas of orthopaedic surgery to surmount obstacles imparted by challenging patient anatomy and to maximize reproducibility. For example, the use of patient-specific cutting guides in total knee arthroplasty has demonstrated better restoration of knee kinematics and alignment compared to conventional instrumentation in some studies. 16,29,30 However, with regard to MOWHTO, there is a paucity of literature investigating the use of patient-specific guides to achieve sagittal and coronal deformity corrections. While previous studies have investigated the use of 3-dimensional (3D) printed or custom guides, such investigations are limited in that these tools may not be readily available at various institutions, the creation of individual guides can be costly, and these models do not consider deformities in multiple planes simultaneously. 9,27,33,37 Therefore, a system that could identify the optimal hinge axis position for precise multiplanar correction based on preoperative imaging would be of great clinical utility for practicing surgeons.
The purpose of the current study was to create computed tomography (CT)–based patient-specific models to identify both the ideal hinge axis position and the amount of maximum opening in MOWHTO to achieve the desired slope correction in both the coronal and sagittal planes. We hypothesized that this CT-based system would be able to provide accurate and reproducible targets to achieve the desired PTS and mechanical tibiofemoral angle (mTFA) correction during MOWHTO.
Methods
Patients and Imaging Acquisition
A total of 10 adult patients with osteoarthritis of the medial compartment of the knee with available standing hip-to-ankle anteroposterior (AP) radiographs, as well as CT scans of the lower extremity, were identified. Data acquisition from CT scans was performed in a standardized fashion following the Bodycad Imaging Guide (Bodycad) as previously described. 10 In short, the slice thickness could be no greater than 1 to 1.5 mm, and a minimum of 15 cm of the patient’s hip (5 cm proximal to and 10 cm distal to the femoral head), 30 cm of the patient’s knee (15 cm above and below the joint line), and 10 cm of the distal tibia were required to be captured on the CT scans to provide adequate landmarks and data for analysis. Digital Imaging and Communications in Medicine data were extracted using proprietary software (Bodycad Imager; Bodycad), and 3D models of the femur, tibia, and fibula were created.
Virtual Osteotomy
Virtual osteotomy was performed using Bodycad Osteotomy software (Bodycad) as previously described. 10 In short, 3D images of each patient’s tibia and femur were created and rotated to match the contour of the bones on their respective AP radiographs. After the bony orientation was established, baseline measurements, including the mTFA, the medial proximal tibial angle, and the PTS, were calculated. First, for each patient, the hinge axis was positioned such that osteotomy would result in no change in the tibial slope. For all 10 patients, the mean hinge axis position angle was 102.6° ± 8.3° relative to the posterior condylar axis (PCA). Second, virtual osteotomy was planned for each patient with the goal of achieving various degrees of mTFA correction (5.0°, 7.5°, 10.0°, 12.5°, and 15.0°) while keeping the PTS consistent (no change in PTS).
Next, additional virtual osteotomy was performed for each patient to achieve 2 parameters simultaneously: (1) a desired degree of mTFA correction (5.0°, 7.5°, 10.0°, 12.5°, and 15.0°) and (2) a desired degree of PTS correction (0.0°, 3.0°, 6.0°, 9.0°, and 9.5°). These were accomplished by first positioning the hinge axis such that the cut would result in no change in the tibial slope (mean, 102.6° ± 8.3°). Next, the desired degree of mTFA correction was placed into the program, and the resultant osteotomy gap (millimeter) was produced. However, to change both the PTS and the mTFA, we manually moved the hinge axis position from its baseline position until the desired degree of PTS correction was achieved. Both the hinge axis position and the amount of maximum opening were then manually adjusted in the program such that the outputs of the desired mTFA correction and PTS correction were achieved for each patient using each osteotomy procedure. The hinge axis position was defined with respect to the PCA, and the angle reported is the angle between the PCA and the hinge axis (Figure 1A). The maximum opening was defined as the greatest length of the resultant osteotomy gap (millimeter) that was located directly opposite from the hinge axis (Figure 1, B and C). The resultant hinge axis position and maximum opening were then calculated for each multiplanar correction.

(A) Axial view of a 3-dimensional computed tomography (3D CT)–reconstructed tibia demonstrating the posterior condylar axis (green line), the hinge axis position (yellow line), and the angle between the 2 lines (dashed red line). (B) Coronal view of a 3D CT–reconstructed tibia showing an example of medial opening wedge high tibial osteotomy. (C) Sagittal view of a 3D CT–reconstructed tibia demonstrating the medial aspect of the osteotomy site and measuring of the gap at the position of the maximum opening (millimeter).
Statistical Analysis
Excel in Office 2018 (Microsoft Corp) was used for data compilation and figure preparation. GraphPad Prism 9 (GraphPad Software) was used to perform all statistical analyses. Simple linear regression analysis, including trend lines, R 2 values, and P values, was conducted using GraphPad Prism. Linear regression equations generated for each variable were used to calculate the degree of each parameter necessary to produce a 1° change in the PTS. A comparison of linear regression analysis trend lines was performed for both the hinge axis position angle and the amount of maximum opening required to achieve PTS correction using a modified analysis of covariance in GraphPad Prism. GraphPad Prism was also used to determine whether the trend lines from linear regression were significantly different. Then, multiple comparison tests were performed using the slope means and standard errors. These data were analyzed using 1-way analysis of variance (ANOVA) with Tukey multiple comparison tests. The significance level for all tests was set at P = .05. Adjusted P values were used for the multiple comparison tests.
Results
Of the 10 patients included in this study, 4 were male, and 6 were female. There were 2 left and 8 right lower extremities included. The mean patient age was 57 years (range, 49-66 years). All patients had medial compartment osteoarthritis with varus deformities of the lower extremities with a mean mTFA of 8.1° ± 3.2° (range, 3.6°-13.4°). The mean PTS was 9.5° ± 1.8° (range, 7.2°-12.3°). The mean tibial width was 73.0 ± 6.2 mm (range, 66-85 mm) (Table 1).
Patient Descriptive Data and Baseline Measurements a

a F, female; L, left; M, male; mTFA, mechanical tibiofemoral angle; PTS, posterior tibial slope; R, right.
First, virtual osteotomy was planned for all 10 patients with the goal of achieving 5.0°, 7.5°, 10.0°, 12.5°, and 15.0° of mTFA correction while keeping the PTS consistent (ie, maintaining 0.0° of PTS correction). The results of these osteotomy procedures are shown in Table 2. To perform osteotomy while maintaining each patient’s anatomic PTS, we used a mean hinge axis position angle of 102.6° ± 8.3° relative to the PCA for each correction (Figure 2A).
Amount of Maximum Opening Necessary for Varying Degrees of mTFA Correction a
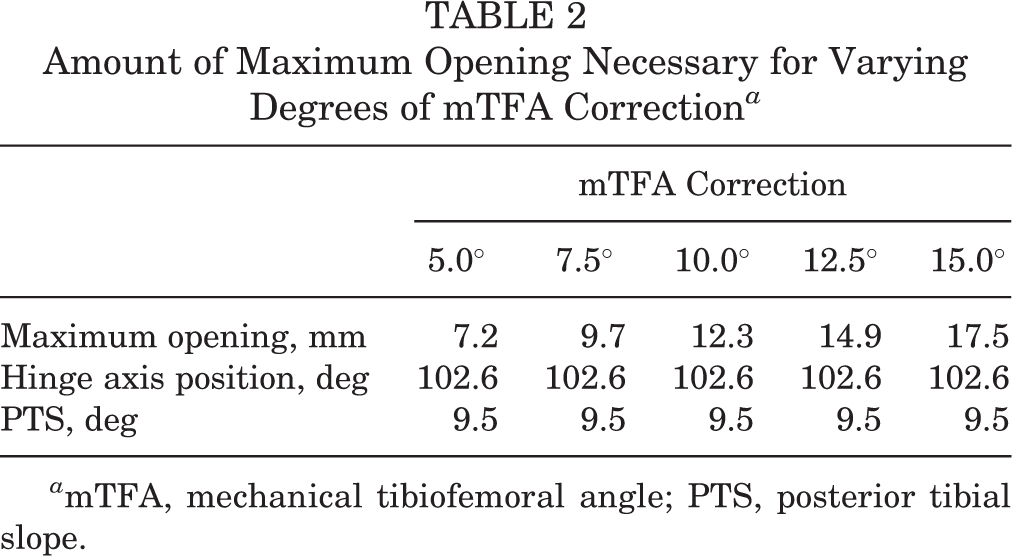
a mTFA, mechanical tibiofemoral angle; PTS, posterior tibial slope.

(A) Axial view of a 3-dimensional computed tomography–reconstructed tibia demonstrating the posterior condylar axis (black line) and the hinge axis position (gray line). The angle between these 2 lines was calculated to be a mean of 102.6° ± 8.3° for the hinge axis position at which medial opening wedge high tibial osteotomy could be performed without affecting the posterior tibial slope (PTS). (B) For 3.0° of PTS correction, the hinge axis position for 5.0° of mechanical tibiofemoral angle (mTFA) correction (green), 7.5° of mTFA correction (blue), 10.0° of mTFA correction (yellow), 12.5° of mTFA correction (red), and 15.0° of mTFA correction (pink) was more internally rotated for smaller degrees of mTFA correction. (C) Hinge axis positions for 6.0° of PTS correction. (D) Hinge axis positions for 9.0° of PTS correction. (E) Hinge axis positions to create neutral-slope osteotomy (9.5° of PTS correction).
Next, virtual osteotomy was performed to achieve both a desired degree of mTFA correction (5.0°, 7.5°, 10.0°, 12.5°, and 15.0°) and a desired degree of PTS correction (0.0°, 3.0°, 6.0°, 9.0°, and 9.5°). The relative hinge axis positions on axial views of the tibia’s 3D reconstruction are shown in Figure 2. For each fixed magnitude of PTS correction, to achieve smaller degrees of mTFA correction, the hinge axis position became more internally rotated. Additionally, for each fixed magnitude of mTFA correction, the hinge axis position was increasingly internally rotated to correct larger degrees of the PTS (Figure 3).

The hinge axis positions for 0.0° of posterior tibial slope (PTS) correction (gray line), 3.0° of PTS correction (green line), 6.0° of PTS correction (blue line), 9.0° of PTS correction (orange line), and slope-neutral osteotomy (red line) are shown for (A) 5.0°, (B) 7.5°, (C) 10.0°, (D) 12.5°, and (E) 15.0° of mechanical tibiofemoral angle correction. The black line represents the posterior condylar axis.
The trends between hinge axis position and PTS correction are reported (Figure 4 and Table 3). Utilizing linear regression analysis, we found that with 5.0° of mTFA correction, the hinge axis position was decreased by 6.8° for every 1° of PTS correction. For 7.5° of mTFA correction, the hinge axis position was decreased by 6.0° for every 1° of PTS correction. For 10.0° of mTFA correction, the hinge axis position was decreased by 5.2° for every 1° of PTS correction. For 12.5° of mTFA correction, the hinge axis position was decreased by 4.5° for every 1° of PTS correction. Finally, for 15.0° of mTFA correction, the hinge axis position was decreased by 3.9° for every 1° of PTS correction. These data demonstrate that with small coronal-plane corrections, the hinge axis position decreased by larger magnitudes, whereas with large coronal-plane corrections, the hinge axis position changed by smaller magnitudes to achieve the same slope correction. Trend lines calculated for each parameter change demonstrated high coefficients of determination (R 2 > 0.93). Overall, the difference in trend-line slopes among the groups was found to be statistically significant (P = .013), but there was no significant difference among the intercepts. One-way ANOVA of the slopes and standard errors from the groups confirmed an overall statistically significant difference (P = .011). However, Tukey multiple comparison tests demonstrated that the pairwise differences that were statistically significant included 5.0° of mTFA correction versus 12.5° of mTFA correction (P adjusted = .045) and 5.0° of mTFA correction versus 15.0° of mTFA correction (P adjusted = .012). Other pairwise comparisons of slopes were not significant.

Hinge axis position angle required for posterior tibial slope correction of 0.0°, 3.0°, 6.0°, 9.0°, and 9.5°. mTFA, mechanical tibiofemoral angle.
Amount of Maximum Opening and Hinge Axis Position Angle Necessary for Varying Degrees of PTS Correction and mTFA Correction a

a mTFA, mechanical tibiofemoral angle; PTS, posterior tibial slope.
The trends between the amount of maximum opening and PTS correction are reported (Figure 5 and Table 3). Utilizing linear regression analysis, we found that with 5.0° of mTFA correction, the maximum opening was increased by 0.49 mm for every 1° of PTS correction. For 7.5° of mTFA correction, the maximum opening was increased by 0.43 mm for every 1° of PTS correction. For 10.0° of mTFA correction, the maximum opening was increased by 0.37 mm for every 1° of PTS correction. For 12.5° of mTFA correction, the maximum opening was increased by 0.34 mm for every 1° of PTS correction. Finally, for 15.0° of mTFA correction, the maximum opening was increased by 0.31 mm for every 1° of PTS correction. The trend lines calculated for each parameter change demonstrated high coefficients of determination (R 2 > 0.94). Overall, there was no significant difference in the slopes (P = .066) among trend lines, but there was a significant difference among the intercepts (P < .0001). One-way ANOVA of the intercepts and standard errors from the groups confirmed an overall statistically significant difference (P < .001). Tukey multiple comparison tests demonstrated that the pairwise differences were statistically significant for all pairwise comparisons between groups (P adjusted < .001).
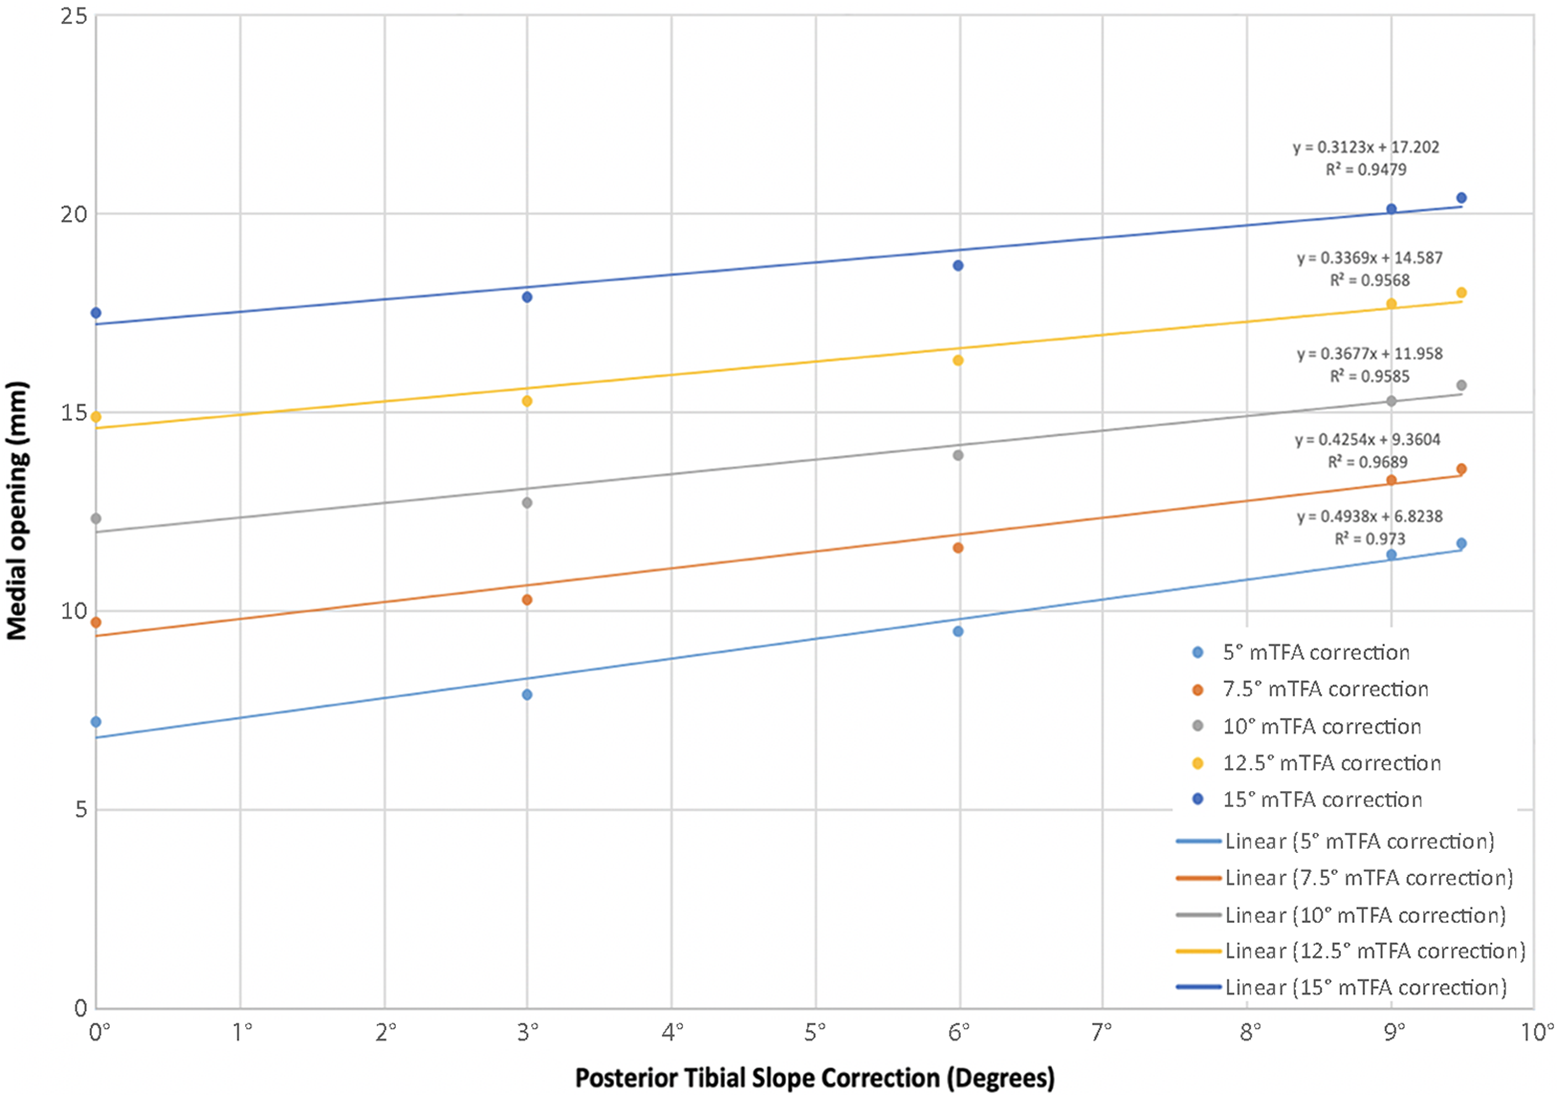
Amount of maximum opening required for posterior tibial slope correction of 0.0°, 3.0°, 6.0°, 9.0°, and 9.5°. mTFA, mechanical tibiofemoral angle.
Discussion
The main findings of the current study were as follows: (1) utilizing virtual osteotomy via 3D CT, we found the ideal hinge axis position angle for MOWHTO to maintain an anatomic PTS (no slope correction) was a mean of 102.6° ± 8.3° in this series of patients, and (2) with smaller coronal-plane corrections, more extreme (more internally rotated) hinge axis positions were necessary to achieve the same degree of PTS correction.
The current study defined patient-specific targets for multiplanar correction during MOWHTO, which may provide considerable clinical value, given the intraoperative challenges associated with manually defining the hinge axis position. We defined the hinge axis position relative to the PCA, which was readily reproducible utilizing 3D CT, and found that the ideal mean hinge axis position angle of 102.6° ± 8.3° allowed for mTFA correction without changing the PTS. The hinge axis position is not well defined in the literature. Some studies have defined the “hinge axis” as the angle between the position of the hinge and the AP axis of the tibia in the axial view. 23,26 In their retrospective study of 17 patients who had undergone MOWHTO, Moon et al 26 found that the mean hinge axis was 4.92° ± 3.86° posterolaterally compared with the AP axis and that the hinge axis was a significant factor in changing the PTS. Others have defined the “hinge position” relative to anatomic landmarks in the coronal and sagittal planes, but this fails to take into account the rotation of the hinge position in the axial view. 17 The PCA is often used in other orthopaedic subspecialties (eg, to assess rotation in patients with tibial torsion or to assess the component position for patients undergoing total knee arthroplasty). 28,34 Utilizing the PCA as a reference, we calculated an angle (mean, 102.6° ± 8.3°) to define the hinge axis position as a reproducible reference point for the ideal hinge axis position in MOWHTO when no PTS correction is required.
Our findings also demonstrated that small changes in any of the osteotomy parameters may result in statistically significant differences in alignment outcomes such as the mTFA and PTS, which may otherwise be difficult to target without patient-specific guides. For example, across various degrees of mTFA correction, the hinge axis position was decreased between 3.9° and 6.8° to achieve 1° of PTS correction. Similarly, the maximum opening was increased by 0.31 to 0.49 mm, depending on the degree of mTFA correction, to achieve 1° of PTS correction. These small changes are perhaps the most challenging for the surgeon to reproduce intraoperatively without careful preoperative planning or intraoperative guidance. This proof-of-concept analysis demonstrates the complexity of multiplanar correction and the precision that is required during MOWHTO to produce planned patient-specific changes.
With the trend lines calculated from this study, there was a significant difference in the trend-line slopes for the hinge axis position and a significant difference in the trend-line intercepts for the amount of maximum opening. In both analyses, the trend lines demonstrated high coefficients of determination; however, it is evident in Figure 4 that, based on the plotted trend lines and the R 2 values, the trend lines appear to fit best for larger degrees of mTFA correction (R 2 > 0.99). This highlights that it may be more challenging or, in other words, requires more change in the hinge axis rotation to achieve the same magnitude of PTS correction with a smaller mTFA correction than with a larger mTFA correction. This is important and clinically relevant because most mTFA corrections in the setting of MOWHTO are relatively small, ranging from approximately 2° to 7° of mechanical valgus when the surgical goal is to offload the medial compartment. 6,19 Therefore, the importance of patient-specific preoperative planning is likely even more relevant when making these small corrections because aggregate modeling does not accurately account for these small differences, especially in multiplanar deformities. Additionally, these extreme hinge axis positions necessary with small coronal-plane corrections (when the hinge axis is very internally rotated) can potentially lead to unstable osteotomy and are much more technically challenging.
Given the technical challenges in performing precise coronal- and sagittal-plane corrections during HTO, increasing focus has been placed on utilizing preoperative planning and intraoperative technology to optimize the precision and accuracy of corrections made during this procedure. Previous research has investigated the use of intraoperative navigation systems to aid with HTO in an attempt to produce consistent results and reduce outliers. 14,20,32 However, others have argued that there are several disadvantages to using these intraoperative navigation systems, such as operative visibility, technical challenges, software malfunctions, higher costs, and the need for extra equipment. 31,35 Additionally, as with many surgical procedures that apply intraoperative technology, there may be a steep learning curve involved with navigation-assisted HTO, which could potentially lead to even higher complication rates. 11 Given these challenges, the application of 3D CT–based patient-specific guides for HTO may provide a potential solution capable of optimizing the precision of corrections made intraoperatively without the disadvantages of intraoperative navigation.
Limitations
There were limitations to this study. First, these data were obtained from virtual osteotomy that was performed on a small number of patients, and these results may not reflect those after MOWHTO in clinical practice. Second, all patients had medial compartment osteoarthritis of the knee and varus deformities, and these data may not be generalizable to the population at large or to younger patients who are undergoing osteotomy in the setting of concomitant ligamentous reconstruction or cartilage and meniscal preservation procedures. Third, many of the manipulations and calculations for these virtual osteotomy procedures were performed manually, and therefore, this may introduce inconsistency across surgeons and other interoperator issues. Finally, clinical data were not available for these patients, which limits the utility of these results. Because these osteotomy procedures were only performed utilizing preoperative imaging, additional patient factors such as the amount of soft tissue and the types of soft tissue release performed intraoperatively cannot be considered. 37
Conclusion
The study findings indicated that the mean hinge axis position for slope-neutral osteotomy was 102.6° ± 8.3° relative to the PCA and that for smaller corrections in the coronal plane, extreme hinge axis positions were necessary to achieve any degree of PTS reduction.
Footnotes
Final revision submitted December 31, 2021; accepted February 8, 2022.
One or more of the authors has declared the following potential conflict of interest or source of funding: K.N.K. has received education payments from Arthrex; consulting fees from Arthrex, Biom’Up, Bodycad, Corin, Heraeus Medical, Intellijoint Surgical, LinkBio, Medical Device Business Services, Ortho Development, United Orthopedic, and Zimmer Biomet; speaking fees from Arthrex, Ortho Development, and Pacira Pharmaceuticals; and hospitality payments from Biocomposites, OrthoSensor, and Stryker. A.S.R. has received education payments from Gotham Surgical; consulting fees from Anika Therapeutics, Arthrex, Bodycad, Flexion Therapeutics, Heron Therapeutics, Smith & Nephew, and Stryker; speaking fees from Smith & Nephew; and royalties from ConforMIS. AOSSM checks author disclosures against the Open Payments Database (OPD). AOSSM has not conducted an independent investigation on the OPD and disclaims any liability or responsibility relating thereto.
Ethical approval for this study was obtained from Hospital for Special Surgery (No. 2019-2285).