
Abstract
Background:
Repetitive loading of the back puts elite rowers at risk for acute and chronic back injuries.
Hypothesis:
That asymptomatic elite rowers would demonstrate characteristic intervertebral disk (IVD) alterations on T2* magnetic resonance imaging (MRI) mapping compared with asymptomatic nonrowers.
Study Design:
Cross-sectional study; Level of evidence, 3.
Methods:
This study included 20 asymptomatic elite rowers (mean age, 23.4 ± 3.03 years; 9 women, 11 men) studied at 2 different times, once before (t 1) and once after (t 2) the competition phase. MRI including T2* mapping was performed on a 3-T scanner. The authors derived normative T2* data from a previous study on 40 asymptomatic volunteers (20 men, 20 women) who were not competitive rowers; based on complete T2* data sets, 37 controls were included. T2* values were compared between groups in 4 lumbar IVDs, and midsagittal T2* values were compared in 5 zones: anterior annulus fibrosus (AF), anterior nucleus pulposus (NP), central NP, posterior NP, and posterior AF. The Pfirrmann grade was used for morphological assessment of disk degeneration. Statistical analysis was conducted using the Mann-Whitney U test, Wilcoxon matched-pairs test, and Spearman rank correlation coefficient.
Results:
Lower T2* values were noted in the rower group compared with the controls (37.08 ± 33.63 vs 45.59 ± 35.73 ms, respectively; P < .001). The intersegmental comparison revealed lower mean T2* values among rowers (P ≤ .027 for all). The interzonal comparison indicated significantly lower mean T2* values for the rowers in all zones except for the anterior NP (P ≤ .008 for all). Lower mean T2* values were observed for the rowers at t 1 versus t 2 (39.25 ± 36.19 vs 43.97 ± 38.67 ms, respectively; P = .008). The authors noted a higher level of IVD damage according to Pfirrmann assessment in the rower cohort (P < .001); the Pfirrmann grade distributions of rowers versus controls, respectively, were as follows: 51.3% versus 73.7% (grade 1), 20.5% versus 19.5% (grade 2), 21.8% versus 6.8% (grade 3), 5.1% versus 0% (grade 4), and 1.3% versus 0% (grade 5). The authors also noted a correlation between low T2* and high Pfirrmann grade at t 1 (r =–0.48; P < .001) and t 2 (r =–0.71; P < .001).
Conclusion:
The cohort of elite rowers revealed more degenerative IVD changes compared with controls. The T2* values suggest that repetitive loading of the spine has demonstrable short-term and possibly permanent effects on the lumbar IVD.
Rowing is considered a low-injury 1,13 and health-promoting sport 40 that can be started at an early age and in which athletes can continue to train and compete well, even at an advanced age. However, as in every sport practiced for performance, rowing also involves health risks, including chronic injuries caused by repetitive joint overuse, 1,33 –35 that can imply a considerable loss of training and competition time for the athlete. 39
The rowing movement is characterized by a precise sequence of movement performed in a seated position with 3 contact points with the boat: the feet, buttocks, and hands. The legs contribute to approximately half of the rowing power, the trunk to a third. The arms and shoulders are responsible for the rest of the power. 23 To achieve maximum speed, the rower must minimize resistance and maximize propulsion. A key factor for propulsion is the stroke length. The stroke length requires strong flexion of the back, leading to great loads on relatively relaxed muscles during the catch. Peak compressive force at the lumbar spine relative to body weight can reach 4.6 times the body weight of the athlete. 28 In sweep rowing, there is additional torsion in the back.
The intervertebral disk (IVD) plays a protective role in the spine’s long-term health by facilitating shock absorption and load distribution. 16 Hence, early detection of compositional changes in the IVD is essential for preserving the tissue and avoiding the onset or progression of degenerative disk disease. Magnetic resonance (MR) imaging (MRI), including conventional T1-, proton density–, and T2-weighted MR sequences, is used to ascertain the morphological status of the IVD and other structures in the area of the spine.
T2* mapping is a noncontrast MRI technique that depicts changes in anisotropy and water content and allows high-resolution isotropic 3-dimensional imaging on standard clinical MRI systems. 17 It is thus an ideal instrument for the quantitative evaluation of cartilage and IVD degeneration. T2* mapping has been used in human and animal samples, mostly in the lumbar and cervical spine. 10 –12,19 –21,24,25,40,41,46 It is recently becoming clinically relevant in the proper assessment of early IVD abnormalities, enhancing the analysis and the judgment of therapy. 11
This study aimed to evaluate T2* values in elite rowers and assess any IVD degeneration due to repetitive overloading of the IVD. We hypothesized that there would be a pattern of IVD degeneration reflecting the repetitive flexion and axial loading of the lumbar spine. We further expected IVD T2* variations between the winter preparation phase as well as the summer competitive phase.
Methods
Study Population
This study was approved by the local ethics committee, and each volunteer provided written informed consent. Included were 20 asymptomatic rowers (9 women, 11 men; 15 sweep oar rowers, 5 sculling rowers; mean age, 23.4 ± 3.03 years; age range, 19-30 years) who had a minimum of 5 years of intensive (≥12 h/wk) training. The rowers were recruited from the central German federal rowing base, which has inherent intense training and selection requirements to declare these athletes as elite rowers. The mean body mass index (BMI) was 24.3 ± 1.89 kg/m2 (range, 19.8-27.7 kg/m2). The rowers took part voluntarily and received an expense allowance. We excluded rowers with contraindications to MRI, known disorders of the vertebral column, any history of spinal surgery, or chronic back pain in their history.
Before undergoing MRI, all the rowers completed a thorough physical examination conducted by an attending orthopaedic consultant (M.K.). This physical examination included an investigation of pain, discomfort, tenderness, and range of movement. Rowers who had a BMI >31 kg/m2 or <17 kg/m2 were excluded, as extremely low or high BMI can result in image distortion. 17 All the participants underwent MRI in the afternoon.
The control T2* data for this study were derived from a previous study in which T2* relaxation measurements in the lumbar IVD of asymptomatic volunteers were obtained in various age cohorts using similar MR hardware, imaging sequences, and scan times. 25 All scans were performed in the afternoon. This group included 40 asymptomatic nonrowers who did not practice sports at an elite level and who exercised an average of 3 hours a week. Three were missing T2* data, leaving 37 controls eligible for study inclusion (18 women, 19 men; mean age, 24.4 ± 3 years; age range, 21-34 years). They had no history of spine surgery or spine complaints. The mean BMI was 22.8 ± 2.71 kg/m2 (range, 18.2-30.2 kg/m2).
Magnetic Resonance Imaging
All study participants underwent MRI in the supine position on a 3-T scanner (Prisma; Siemens Medical Solutions). We utilized a spine matrix coil (24-channel, triple mode) that was smoothly integrated into the patient table. The protocol included standard sequences (localizer images; T1- and T2-weighted transversal and sagittal oriented MRI scanss, each with a slice thickness of 4 mm) and a 3-dimensional high-resolution multiecho data image combination (MEDIC) sequence. The MEDIC sequence used the following imaging parameters: repetition time = 43 ms; echo time = 5, 10, 15, 20, 25, and 30 ms; field of view = 192 × 216 mm2; slice thickness = 1 mm; voxel size = 1 × 1 × 1 mm3; slice gap = 1.2 mm; receiver bandwidth = 260 Hz per pixel; flip angle = 25°; number of excitations = 1; and scan time = 11 minutes 10 seconds. The T2* maps were automatically processed inline (SyngoMapIT; Siemens Medical Solutions) utilizing a nonlinear, squared, curve-fitting algorithm.
Morphological Analysis and Postprocessing
Morphological assessment was performed by an independent orthopaedic surgeon (M.K.; 11 years of spine surgery experience) and a radiologist (D.B.A.; 5 years of practice) and included gathering Pfirrmann grades for each IVD from the morphological T2*-weighted images. Image processing and T2* assessment were performed on a Leonardo working station by 1 expert (B.B.) in biochemical MRI (13 years of experience). Midsagittal planes with a slice thickness of 4 mm were generated using multiplanar reformatting (Figure 1).

Multiplanar reconstruction of the T2* mapping data set depicting the (A) sagittal, (B) coronal, (C) transversal, and (D) reformatted midsagittal planes. The T2* values are illustrated on a color scale whereas blue indicates low T2* values and red indicates high values.
Back Pain: Oswestry Disability Questionnaire
All the rowers who participated in the MRI examinations completed a questionnaire regarding functional impairments, according to Fairbank et al, 14 at both examination times. The Oswestry Disability Questionnaire provides a subjective score of performance in daily activities. The questionnaire is composed of 10 questions, each answered with a score from 0 to 5 (5 = most significant disability). Overall scores are presented as percentages (0%-20% indicates minimal disability, 81%-100% indicates severe disability). This questionnaire has been used in several studies that included athletes. 3,36,45
IVD Assessment
Four disks of the lumbar spine (segments L2-L3, L3-L4, L4-L5, and L5-S1) were examined. The IVD between the first and second lumbar vertebrae was excluded because T2* assessment in the thoracolumbar region is affected by motion artifacts due to respiratory motion and vascular pulsations from the heart and aorta.
Within the group of elite rowers, we also assessed for any variations in IVD T2* data between the preparational phase in April (t 1) and the competitive phase in October (t 2).
Regions of Interest for Midsagittal T2* Values
T2* values were obtained in 5 regions of interest (ROIs). These ROIs were manually drawn into the sagittal morphological T2*-weighted images and the T2* maps and subdivided the IVD into 5 zones: the anterior annulus fibrosus (AF), anterior nucleus pulposus (NP), central NP, posterior NP, and posterior AF. The ROIs in the morphological T2*-weighted images served as the basis for positioning the ROIs in the T2* maps. The T2*-weighted images and corresponding T2* maps were displayed on a 2-screen layout image area. T2*-weighted images and the corresponding T2* maps were displayed large enough with optimal image contrast and brightness to see details. The ROIs were then delineated on the T2*-weighted image using a freehand drawing tool. The ROIs drawn in the T2*-weighted image were automatically transferred to the T2* map, which reflects in some ways a copy-and-paste approach by selecting both images. Afterward, the ROI outlines were reevaluated in the T2* map and, if necessary, only minimally shifted to correct for any ROI offset (Figure 2). The intra- and interrater reliability for this method have previously been reported, with a substantial agreement for the T2* measurement. 6 –8,18,25 Hence, the T2* measurement was performed by a single reader (B.B.).

(A) Midsagittal T2*-weighted morphological magnetic resonance imaging reformat and (B) corresponding midsagittal T2* map. Five regions of interest were placed in the sagittal direction: annulus fibrosus (AF) anterior, nucleus pulposus (NP) anterior, NP central, NP posterior, and AF posterior.
The observer did his best to create 5 zones that both reflected the anatomy of the IVD and were roughly proportioned in the sagittal plane. However, the ROIs were not equal in size, neither between nor within a single IVD level, as the subdivisions were created manually. Furthermore, the disk shape is not rectangular and reveals differences in height in the sagittal course. To measure tissue with a significant amount of certainty in the IVD, the ROIs did not follow the IVD contour to the exact border. Hence, a few pixels of potential IVD tissue may not have been included within the ROIs.
Statistical Analysis
A biostatistician conducted the statistical analysis in this study. The study and control groups were compared regarding sex, age, and BMI using the Student t test to reveal any significant differences. Intra- and interrater reliability regarding the Pfirrmann grading were assessed for consistent agreement using Spearman rank correlation (r). A strong relationship between values is given when r > 0.7, moderate when 0.5 < r < 0.7, mild when 0.3 < r < 0.5, and very weak when r < 0.3. The T2* values are reported as mean values with standard deviation and the 95% CI. The T2* comparison between the study and the control cohort was made using the Mann-Whitney U test. The T2* comparison between the 2 training points (t 1 vs t 2) was completed using the Wilcoxon matched-pairs test. These T2* comparisons were made overall, per segment, and per zone. The correlation between the T2* values and the Pfirrmann grades was calculated utilizing Spearman rank correlation. The collected data were entered into an Excel spreadsheet (Version 14, Microsoft Office Professional; Microsoft) and later transferred to SPSS Software (Version 25; IBM). P < .05 was considered statistically significant.
Results
A total of 148 IVDs (37 volunteers, 4 disks from L2 to S1; 590 IVD zones) were included as control data, based on a complete T2* data set with complete imaging and accurate IVD delineation and no artifacts. Of 80 IVDs in 20 rowers, 2 IVDs and 2 other zones revealed artifacts and were excluded. Therefore, 78 rower IVDs, including 388 zones, were compared against 148 control IVDs, including 590 zones (Figure 3).
Because of scheduling difficulties, only 17 of the 20 rowers participated in the spine analysis at t 2 (8 women, 9 men; 12 sweep oar rowers, 5 sculling rowers; mean age, 24 ± 3.2 years; age range, 20-31 years; mean BMI, 24.2 ± 1.86 kg/m2; BMI range, 19.8-27.2 kg/m2). Therefore, 68 IVDs were assessed before (t 1) and after (t 2) the competitive training phase. A total of 5 IVDs and 9 further zones were excluded because of artifacts or inaccurate delineation, leaving 63 IVDs including 306 zones for comparative analysis. Figure 3 shows the sample sizes within the rower group for the t 1 and t 2 analyses.

Flowchart of inclusion and exclusion criteria of rowers and T2* data. IVD, intervertebral disk; LBP, low back pain; MRI, magnetic resonance imaging.
Both the control and rower groups were similar regarding sex and age; however, BMI was significantly higher in the cohort of elite rowers (24.3 ± 1.89 vs 22.8 ± 2.71 kg/m2; P = .03) (Table 1). The Spearman coefficient demonstrated a strong correlation (r = 0.71; P < .001) for the intrareader Pfirrmann grade comparison and moderate correlation (r = 0.52; P < .001) for the interreader Pfirrmann grade comparison. All of the rowers responded to the Oswestry Disability Questionnaire, with the mean score being 0.88% at t 1 and 0.85% at t 2.
Characteristics of the Study Groups a

a Data are presented as n (%) or mean ± SD (range). Bolding indicates a statistically significant difference between groups (P < .05). BMI, body mass index.
The mean T2* values were significantly lower in the rower group compared with controls, both overall (37.08 ± 33.63 vs 45.59 ± 35.73 ms, respectively; P < .001) and in the intersegmental comparison (Table 2). The interzonal comparison exposed lower mean T2* measures in all zones except for the anterior NP (Table 3). The segment-and-zone combined pair comparison revealed no T2* differences between the two groups.
Comparison of Mean T2* Times (in ms) Between Groups by Segment a
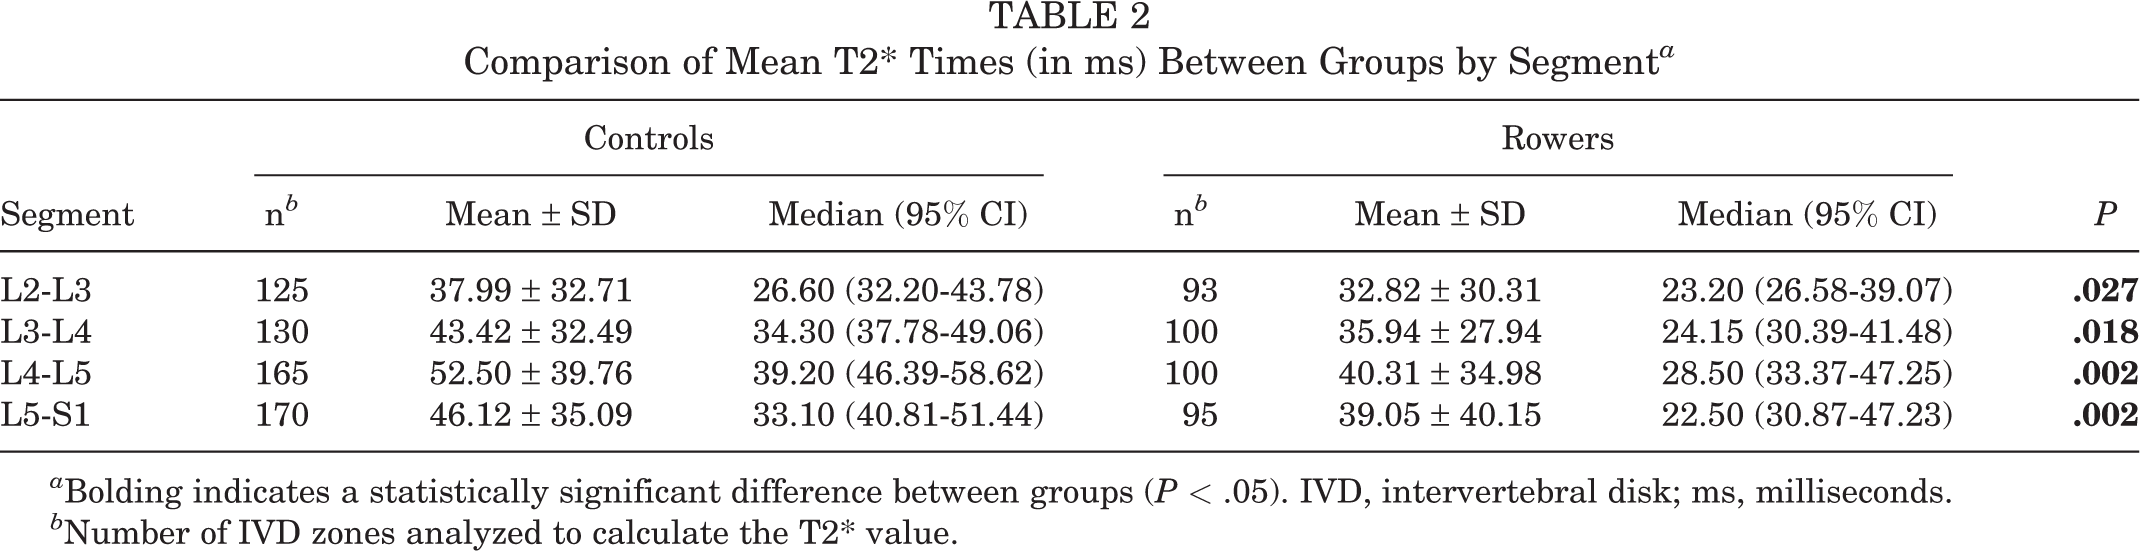
a Bolding indicates a statistically significant difference between groups (P < .05). IVD, intervertebral disk; ms, milliseconds.
b Number of IVD zones analyzed to calculate the T2* value.
Comparison of Mean T2* Times (in ms) Between Groups by IVD Zone a

a Bolding indicates a statistically significant difference between groups (P < .05). IVD, intervertebral disk; ms, milliseconds.
b Number of IVD zones analyzed to calculate the T2* value.
In the elite rowers, the mean T2* values were slightly higher after the competitive rowing phase (t 1 vs t 2: 39.25 ± 36.19 vs 43.97 ± 38.67 ms; r = 0.15; P = .008). Significant differences in T2* values were noted in segments L2-L3 (36.47 ± 34.06 vs 46.52 ± 40.21 ms; P = .025) and L3-L4 (36.05 ± 28.78 vs 42.67 ± 37.46 ms; P = .038) (Table 4). The interzonal comparison demonstrated no significant T2* differences.
Mean T2* Times (in ms) in Rowers Before (t 1) and After (t 2) the Competitive Phase by Segment a

a Bolding indicates a statistically significant difference between groups (P < .05). IVD, intervertebral disk; ms, milliseconds.
b Because of scheduling difficulties, only 17 of the 20 rowers participated in the second spine analysis.
c Number of IVD zones analyzed to calculate the T2* value.
The Pfirrmann grading of the rower cohort revealed a higher level of IVD damage compared with controls (P < .001) (Table 5). We noted a negative correlation between T2* values and Pfirrmann grades at t 1 (r =–0.48; P < .001) and t 2 (r =–0.71; P < .001).
Pfirrmann Grade Distribution in Controls and Rowers a

a Data are presented as No. of intervertebral disks (IVDs) (%).
b Grade 1 = homogeneous, bright white, IVD height normal; grade 2 = inhomogeneous with or without horizontal bands, IVD height normal; grade 3 = inhomogeneous, gray, unclear distinction of nucleus and annulus, normal to slightly decreased IVD height; grade 4 = inhomogeneous, gray to black, no distinction of nucleus and annulus, IVD height normal to moderately decreased; grade 5 = inhomogeneous, black, no distinction of nucleus and annulus, IVD collapsed. 31
We obtained the Pfirrmann grades in IVDs of elite rowers at both study times and compared them with those of controls. While control IVDs were classified as Pfirrmann 1 to 3, our cohort of rowers revealed Pfirrmann grades from 1 to 5, with a higher frequency of higher gradings (Figure 4). The correlation between T2* and Pfirrmann grading in rowers proved to be mild at t 1 (r =–0.48; P < .001) and strong at t 2 (r =–0.71; P < .001). The T2* values by Pfirrmann grades are depicted in Figure 5. There was a very weak negative correlation between T2* values and BMI (r =–0.10; P = .048).

Pfirrmann grade distribution in controls and rowers by segment.
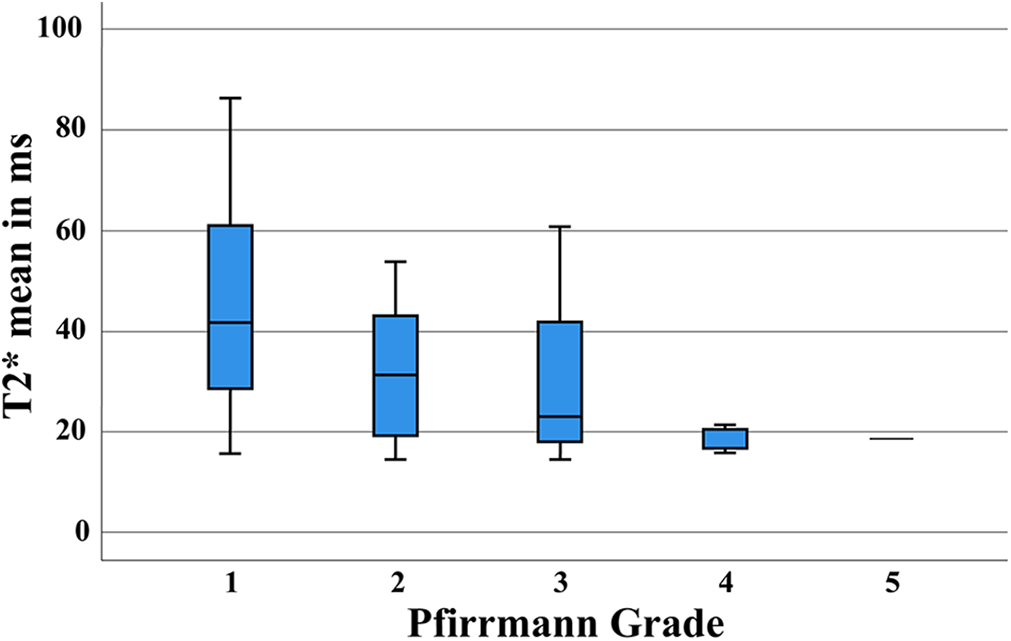
Mean T2* times by Pfirrmann grade in rowers. The boxes indicate the median and interquartile range, and the whiskers indicate the minimum and maximum values. ms, milliseconds.
Discussion
In the current study, the cohort of asymptomatic rowers had significantly lower mean T2* values than asymptomatic, nonrowing controls (37.08 ± 33.63 vs 45.59 ± 35.73 ms, respectively; P < .001). Moreover, we noted significant differences in T2* values between 2 different training times (39.25 ± 36.19 ms [t 1] vs 43.97 ± 38.67 ms [t 2]; P = .008), which implies that training composition may significantly affect IVD health.
Even at the elite level, rowing is among the sports with the lowest injury incidence. 13 However, if an injury occurs, its nature is often chronic and from overuse 32 –34 and may lead to loss of training time. 37,39
The rowing movement is cyclical and leads to repetitive loading of the back in flexion and, in sweep rowing, rotation, 9,43 combined with high compressive and shear forces. 28 This mechanism, combined with the previous history of low back pain (LBP), high training loads, especially in ergometer training, and poor technique, 29,42 may lead to the high incidence of injuries to the spine. In Wilson et al’s 42 12-month prospective cohort study of injury in international rowers, half of the injuries reported were located in the spine, of which 31.82% were found in the lumbar spine. Physical examination and personal assessment remain key points in athletes’ diagnostics.
However, MRI techniques have proven to be valuable tools for damage assessment in the spines of elite athletes. 1,4,36,45 A short-term study with soldiers training for Special Forces compared MRI of the spine before and after a 14-week training, which involved loading of their spines far beyond the levels recommended by the US National Institute for Occupational Safety and Health. In the standard T2-weighted images, soldiers did not sustain irreversible damage to their spines. 2 Biochemically sensitive MRI techniques may lead to a more sensitive detection of changes of the IVD and to a new age of diagnostics and therapeutic management in elite sports. The comparison of quantitative MRI techniques conducted by Belavy et al 5 demonstrated that T2 mapping was the most sensitive technique to detect IVD changes compared with T2-weighted and Dixon imaging. T2 mapping detected differences associated with physical activity history in different sports.
Moreover, T2 mapping consistently distinguished between Pfirrmann grades 1 and 2. 5 While there are similarities between T2 and T2* mapping and correlation between their values, there are significant differences between the 2 imaging modalities, which leads to diverging T2 and T2* values. 17 T2* mapping includes shorter echo times and reflects a wider range of T2 relaxation occurring in cartilage tissue, making it more sensitive to microscopic changes of articular cartilage.
To our knowledge, no study has assessed the spines of elite rowers during a rowing season through T2* mapping. The advantages are an examiner-independent, quantitative measurement of the IVD integrity, in which even early alteration is uncovered. We hope that conclusions concerning the training and therapy of elite rowers will be made possible and might prevent permanent damage to the IVD and its consequences in the future.
Specific injuries to the low back in rowers include disk damage, protrusion, or herniation. 27 While IVD degeneration does not necessarily lead to changes in muscle synergy during the rowing movement, 32 LBP and a history of LBP have a clear effect on rowing kinematics 26,30 and can be caused by IVD degeneration. T2* values can be an early marker for loss of disk vitality. 11,12,19 T2* values correlate with water content and water molecule mobility. Low T2* values indicate early IVD damage and can be detected earlier than low Pfirrmann grades. Hence, our study aimed to identify early changes in the IVDs of these elite rowers and compare degeneration patterns with a healthy cohort. We noted lower T2* values in all the IVDs and a zonal T2* drop in the anterior AF, central NP, posterior NP, and posterior AF. Only the anterior NP showed no significant alteration. We noted no specific pattern in the IVD damage of our study group. The damage to the IVDs was global. However, this could be because of our small number of participants and would need to be clarified in more extensive studies. There was a mild correlation between T2* values and Pfirrmann grading. The distribution of T2* values had a higher variance in Pfirrmann grades 1 and 2. These results imply that T2* mapping detects structural changes and loss of disk vitality earlier than conventional scans.
The intensity and composition of training programs differ during a rowing season. The winter phase is often characterized by intense strength and indoor ergometer training, followed by specific preparational training to conclude with the regatta or competition season in the spring and summer. 15 This training prepares the physical and mental endurance of the rowers for on-water competition. Physical parameters, such as VO2, lactate, and ergometer times, are fundamental performance-monitoring measures necessary for boat placement during the racing season. The rowers’ primary regatta season implies more on-water activity and, above all, high-intensity sprints. The overall training time slightly diminishes, whereas on-water training time increases. 15 A higher incidence of injury can be observed during the winter phase, 38 with a high correlation with the time spent on the ergometer and training volumes. 38,43,44 We assessed T2* values before and after the summer, noting that T2* values were significantly higher after the summer within the L2-L3 and L3-L4 IVDs. This observation may imply that winter training composition with high ergometer training loads has a higher strain on the IVDs than on-water rowing. Nevertheless, there are certainly more training and personal factors to consider.
Limitations
This study has several limitations. We chose to include only rowers with an elite training status to have a homogeneous group considering training time and spine loading. The results of this study may not apply to recreational rowers. Further studies assessing the differences between elite and recreational rowing are necessary. This study’s generalizability might be limited even among elite rowers because of our limited number of participants, leading to statistical power issues. Statistical power issues might also be accountable for the missing difference between the interzonal comparison of T2* zones of the anterior NP. Different rowing techniques may influence the loading on the lumbar spine. We included sweep oar rowers and sculling rowers. Because of additional torsional and lateral bending stress, sweep rowing is very likely to have a different effect on the IVDs of rowers. We plan to conduct future studies to differentiate the impact of these 2 techniques, including thoracic IVDs.
The BMI of the rowers was significantly higher than that of the controls. The BMI has a weak negative correlation with T2* values. Actual values might be slightly higher. Future studies involving lightweight and heavyweight rowers should further evaluate the correlation between the BMI and T2* values of rowers. Imaging limitations include the susceptibility for motion artifacts, as in respiration or pulsation of the aorta. To reduce the influence of these artifacts, the L1-L2 IVD was excluded.
This study used midsagittal reformats of 4-mm slice thickness to address the loading and unloading effect within the IVD in the anterior-posterior direction. An additional lateral shift of water is expected and should be investigated in future studies. The ROIs of the IVD were drawn manually by the 2 independent observers. Although the observers are experienced with the T2* mapping analysis, given the need to include border IVD tissue in the investigation, an inclusion of bone or soft tissue other than IVD tissue in the ROI cannot be excluded.
An increase in T2/T2* relaxation, when collagen fibers are oriented at an angle of nearly 55° to the main magnetic field, needs to be considered and is referred to as the magic angle effect. 46
The ROIs were manually drawn on sagittal images and then read by only 1 reader. This offers potential for introducing error, particularly when combined with 4-mm slice thicknesses and the variation of the scan slices’ alignment relative to the participant’s anatomy. Repeat scans or measures by a different individual might have resulted in different results.
Another limitation of this study is the possibility of interfering variables of both the rowers and the control group. We tried to ensure the same conditions for each examination and performed all the MRI scans in the afternoon with an identical sequence protocol on the same MR scanner. The patient and coil positionings were conducted identical by 1 experienced medical-technical radiology assistant who has been responsible for all the MRI measurements. The study was conducted on asymptomatic athletes. Future studies should include these athletes and evaluate the clinical relevance and development of these MRI findings.
Conclusion
Although rowing is a sport with the lowest frequency of injury among Olympic sports disciplines, 13,22 this study again outlines the risk of chronic damages and degeneration caused by repetitive joint overuse and misuse. We aimed to apply T2* mapping to a healthy cohort of elite rowers to observe possible patterns of T2* changes that may be characteristic in the IVDs of this population. We found that the elite rowers who took part in our study had significantly lower T2* values than healthy controls, with no recognizable pattern. These lower T2* values correlated with higher Pfirrmann grades. T2* values differed during a rowing season, with higher T2* values in L2-L3 and L3-L4. This effect could be attributed to seasonal changes in training plans. Considering the dynamics of T2* values in our study, personal changes to training and rest plans could facilitate the regeneration of the IVDs of rowers and even help prevent injury. T2* mapping has proven itself as a valuable research tool. We plan to conduct further studies to investigate T2* values and the clinical progression of these rowers. This study offers a baseline of T2* data for future studies with elite rowers or athletes and can give an insight into how sports affect IVD health.
Footnotes
Acknowledgment
The authors thank Mrs. Erika Raedisch for helping perform the MRI and Mr. Sebastian Ullrich, who conducted the statistical analysis in this study. Sincere thanks also go to the athletes who took the time and effort to participate in this study despite tight training schedules.
Final revision submitted October 14, 2021; accepted January 10, 2022.
One or more of the authors has declared the following potential conflict of interest or source of funding: M.K. has received personal fees from Globus Medical. AOSSM checks author disclosures against the Open Payments Database (OPD). AOSSM has not conducted an independent investigation on the OPD and disclaims any liability or responsibility relating thereto.
Ethical approval for this study was obtained from the University of Düsseldorf (reference No. 6238 R).