
Abstract
Background:
Current return-to-sport (RTS) criteria after anterior cruciate ligament (ACL) reconstruction (ACLR) include demonstrating symmetry in functional and strength tests. It remains unknown if at the time that athletes are cleared to RTS, they exhibit between-limb symmetry in ACL and tibiofemoral contact forces or if these forces are comparable with those in uninjured athletes.
Purposes:
To (1) examine ACL and tibiofemoral contact forces in athletes who underwent ACLR and were cleared to RTS and (2) compare the involved leg to the healthy contralateral leg and healthy controls during functional tasks.
Study Design:
Cross-sectional study; Level of evidence, 3.
Methods:
A total of 26 male athletes who underwent ACLR were tested at the time of RTS during tasks that included single-leg vertical, horizontal, and side jumps; cutting maneuvers; and high-intensity running. We used an electromyography-constrained musculoskeletal modeling workflow to estimate ACL and tibiofemoral contact forces and compared the results with those of 23 healthy male participants.
Results:
The ACLR group presented no differences in peak tibiofemoral contact forces in the involved limb compared with the control group. However, there were significant between-limb differences mainly due to higher contact forces in the uninvolved (healthy) limb of the ACLR group compared with the control group. In the ACLR group, ACL forces were significantly higher in the uninvolved limb compared with the involved limb during cutting and running. Lateral contact forces were lower in the involved compared with the uninvolved limb, with large effect sizes during cutting (d = 1.14; P < .001) and running (d = 1.10; P < .001).
Conclusion:
Current discharge criteria for clearance to RTS after ACLR did not ensure the restoration of symmetric loading in our cohort of male athletes. ACL force asymmetry was observed during cutting and running, in addition to knee loading asymmetries on several tasks tested.
An anterior cruciate ligament (ACL) injury imparts a high disease burden on an athlete. 2 ACL reconstruction (ACLR) is often recommended to restore knee stability, return to preinjury function, and protect against further knee injuries; 3,37 however, there is no evidence that reconstruction prevents future knee osteoarthritis (OA). 40 Although functional stability of the knee can be restored, more than one-third of those who undergo surgery are unable to return to preinjury levels of activity. 1 In addition, the reinjury rate after ACLR is high; up to 19% of patients sustain graft ruptures, and up to 22% experience ACL ruptures in the contralateral (healthy) knee after return to sport (RTS). 41,59,65 In the long term, the prevalence of symptomatic knee OA is up to 35% in the tibiofemoral joint and 15% in the patellofemoral joint at >10 years after the ACL injury. 35
To prevent secondary ACL injuries and OA, objective discharge criteria to test readiness to RTS were introduced instead of relying only on the time since surgery. The clinical criteria to determine readiness to RTS typically rely on strength and hop testing to assess leg symmetry. 20,34 However, biomechanical asymmetries persist during various tests, despite athletes meeting these discharge criteria, 28,32,50,55 which might contribute to the unacceptably high rate of secondary injuries after RTS.
Common biomechanical markers of knee joint function are knee adduction and flexion moments, which have been reported to be lower in the injured limb after ACLR. 31,62,68 Although these external moments reflect the resulting joint function, they are less representative of articular contact loading. 45 Additionally, altered muscle activation has been documented in patients after ACLR. 21,47 Muscle activity should therefore be incorporated when estimating knee joint contact forces using musculoskeletal simulations. Electromyography (EMG)-constrained neuromusculoskeletal simulations provide a comprehensive understanding of the knee’s loading environment after an ACL injury compared to the simpler measurements of joint moments. Computer modeling allows us to supplement the effect of ligament and muscle forces to the external forces due to foot-ground contact and thus to estimate tibiofemoral contact forces noninvasively. 44,66 Knowledge of ACL and tibiofemoral contact forces during dynamic tasks may lead to better understanding of the reinjury risk or the onset of knee cartilage degenerative changes as well as help guide exercise prescription and progression, but these data are limited.
It is unknown whether patients who are cleared to RTS after ACLR have restored symmetry in ACL and contact forces after the long rehabilitation period. Moreover, understanding how ACL and contact forces vary among different dynamic tasks will better inform exercise prescription during rehabilitation after ACLR to improve reinjury outcomes.
The main goal of this study was to evaluate if current RTS criteria in athletes after ACLR are indicative of the restoration of symmetrical knee loading and to compare these data with those of a group of healthy control participants. Given the high secondary ACL injury risk, we hypothesized that patients would still display loading asymmetries, despite having passed current discharge criteria. Our secondary goal was to identify functional tasks sensitive to musculoskeletal loading asymmetries that should be included in the test battery for RTS in patients after ACLR.
Methods
Participants
Participants were recruited at a single institution (Aspetar Orthopaedic and Sports Medicine Hospital) between November 2018 and March 2020. All participants had undergone ACLR and completed a standardized rehabilitation protocol, and they were enrolled within 1 week after receiving clearance to RTS. 34 The RTS process employs a shared decision-making strategy 15 that includes the consideration of key criteria: (1) clearance by both the surgeon and physical therapist, (2) completion of a sport-specific on-field rehabilitation program, (3) quadriceps strength limb symmetry index >90%, and (4) hop testing limb symmetry index >90%. 34
A total of 49 male participants were included in this study, comprising 26 patients who had undergone primary ACLR and 23 healthy controls (Figure 1 and Table 1). The patients who had undergone ACLR were athletes (Tegner score ≥7) aged between 18 and 35 years with a complete unilateral ACL injury, reconstructed using either an autologous ipsilateral bone–patellar tendon–bone or hamstring tendon graft (semitendinosus and gracilis) as clinically decided by the treating surgeon and athlete. A femoral tunnel was created using an anteromedial knee portal. Patients with a concomitant meniscal injury that did not significantly impede the rehabilitation course were also included in the study. Participants were excluded if they had a concomitant grade 3 knee ligament injury (other than the ACL), a full-thickness articular cartilage lesion (identified during surgery), a history of other lower extremity surgery (in either leg), back pain, or a lower extremity injury (other than the ACL) in the previous 3 months. The participants in the control group, recruited by contacting health care providers, were aged 18 to 35 years (Tegner score ≥7) and had no history of musculoskeletal injuries of the lower limb in the 3 months before testing. The study protocol was approved by our institutional ethics committee, and all participants provided informed consent.
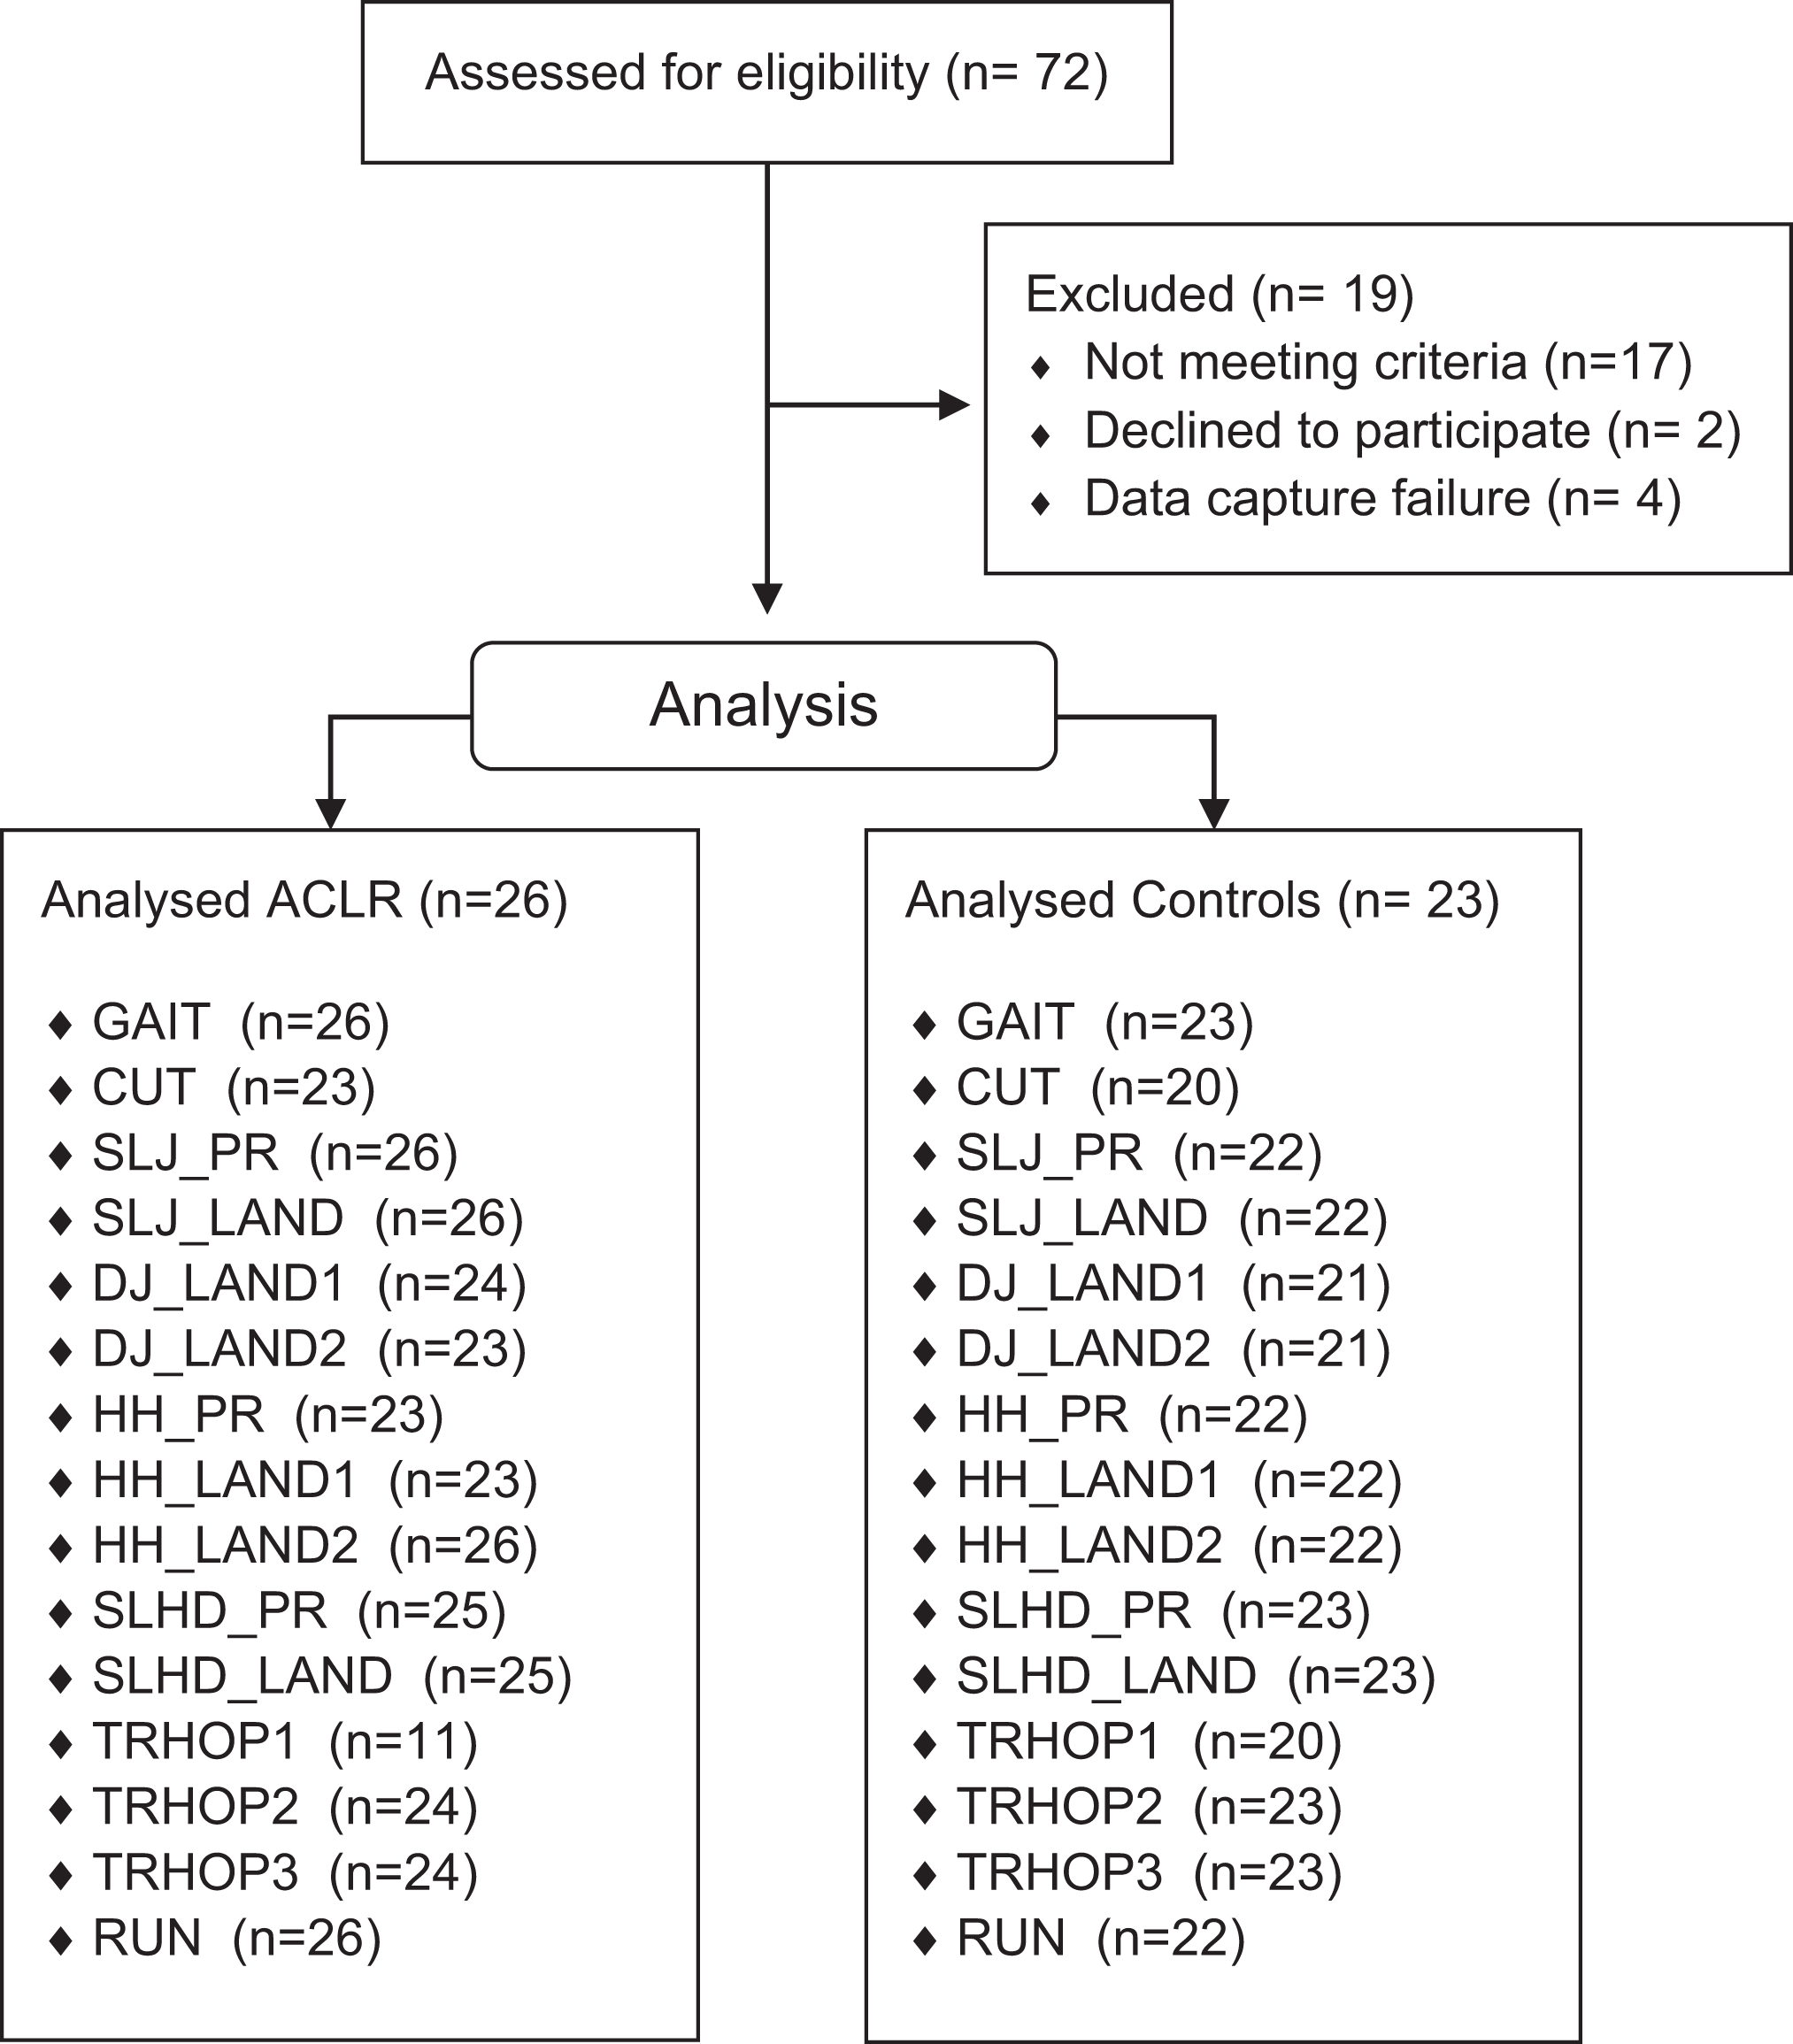
Study flow diagram. ACLR, anterior cruciate ligament reconstruction; CUT, side cutting 45°; DJ_LAND1, single-leg drop jump first landing; DJ_LAND2, single-leg drop jump final landing; GAIT, walking at self-selected speed; HH_LAND1, single-leg side hurdle hop first landing; HH_LAND2, single-leg side hurdle hop final landing; HH_PR, single-leg side hurdle hop propulsion; RUN, running maximum speed; SLHD_LAND, single-leg hop for distance landing; SLHD_PR, single-leg hop for distance propulsion; SLJ_LAND, single-leg vertical jump landing; SLJ_PR, single-leg vertical jump propulsion; TRHOP1, triple hop for distance first landing; TRHOP2, triple hop for distance second landing; TRHOP3, triple hop for distance final landing.
Patient Data a

a Data are reported as mean ± SD or No. of patients. Bold values indicate a statistically significant difference between groups (P < .05; independent-samples t test). ACL, anterior cruciate ligament; ACLR, anterior cruciate ligament reconstruction; ACL-RSI, Anterior Cruciate Ligament–Return to Sport after Injury; IKDC, International Knee Documentation Committee; NA, not applicable; RTS, return to sport.
Subjective knee function was evaluated using the International Knee Documentation Committee (IKDC) questionnaire, 26 and psychological readiness to RTS was measured by using the Anterior Cruciate Ligament–Return to Sport after Injury (ACL-RSI) scale. 60
Data Collection
Participants were asked to complete 8 dynamic tasks commonly used in the final stage of rehabilitation or as discharge tests. All participants wore athletic shorts and standard shoes during testing and were evaluated at the same site by the same examiner (A.K.). The participants initially completed a 7-minute warm-up session including running, side running, deep squats, and double-leg jumps. After a standing calibration trial, the participants performed 4 repetitions of the following tests (Figure 2): gait at self-selected speed, side cutting 45°, single-leg vertical jump, single-leg drop jump, single-leg side hurdle hop, single-leg hop for distance, single-leg triple hop for distance, and running at maximum effort. A detailed description of each phase analyzed is provided in Appendix Figure A1. Limb dominance was determined by asking the participants with which limb they would prefer to kick a ball. 57 The order in which limbs were tested was randomized using a coin toss. Overall, 42 reflective markers were placed according to a full-body Plug-in-Gait marker set, extended with additional anatomic markers on the sacrum, medial knee, and ankle. 12 A total of 3 marker clusters replaced the single marker laterally on each thigh and shank. 17 The markers’ motion was captured using a 14-camera motion capture system (250 Hz; Vicon). Ground-reaction forces were collected synchronously with marker trajectories using 5 ground-embedded force plates (1000 Hz; Kistler). Marker and ground-reaction force data were low pass filtered at 6 Hz for gait and 15 Hz for all other dynamic movements. Muscle activity was collected simultaneously via EMG (2000 Hz; Myomonitor IV [Delsys]) from the vastus lateralis and medialis, rectus femoris, biceps femoris, semitendinosus, medial and lateral gastrocnemius, and tensor fasciae latae. 24
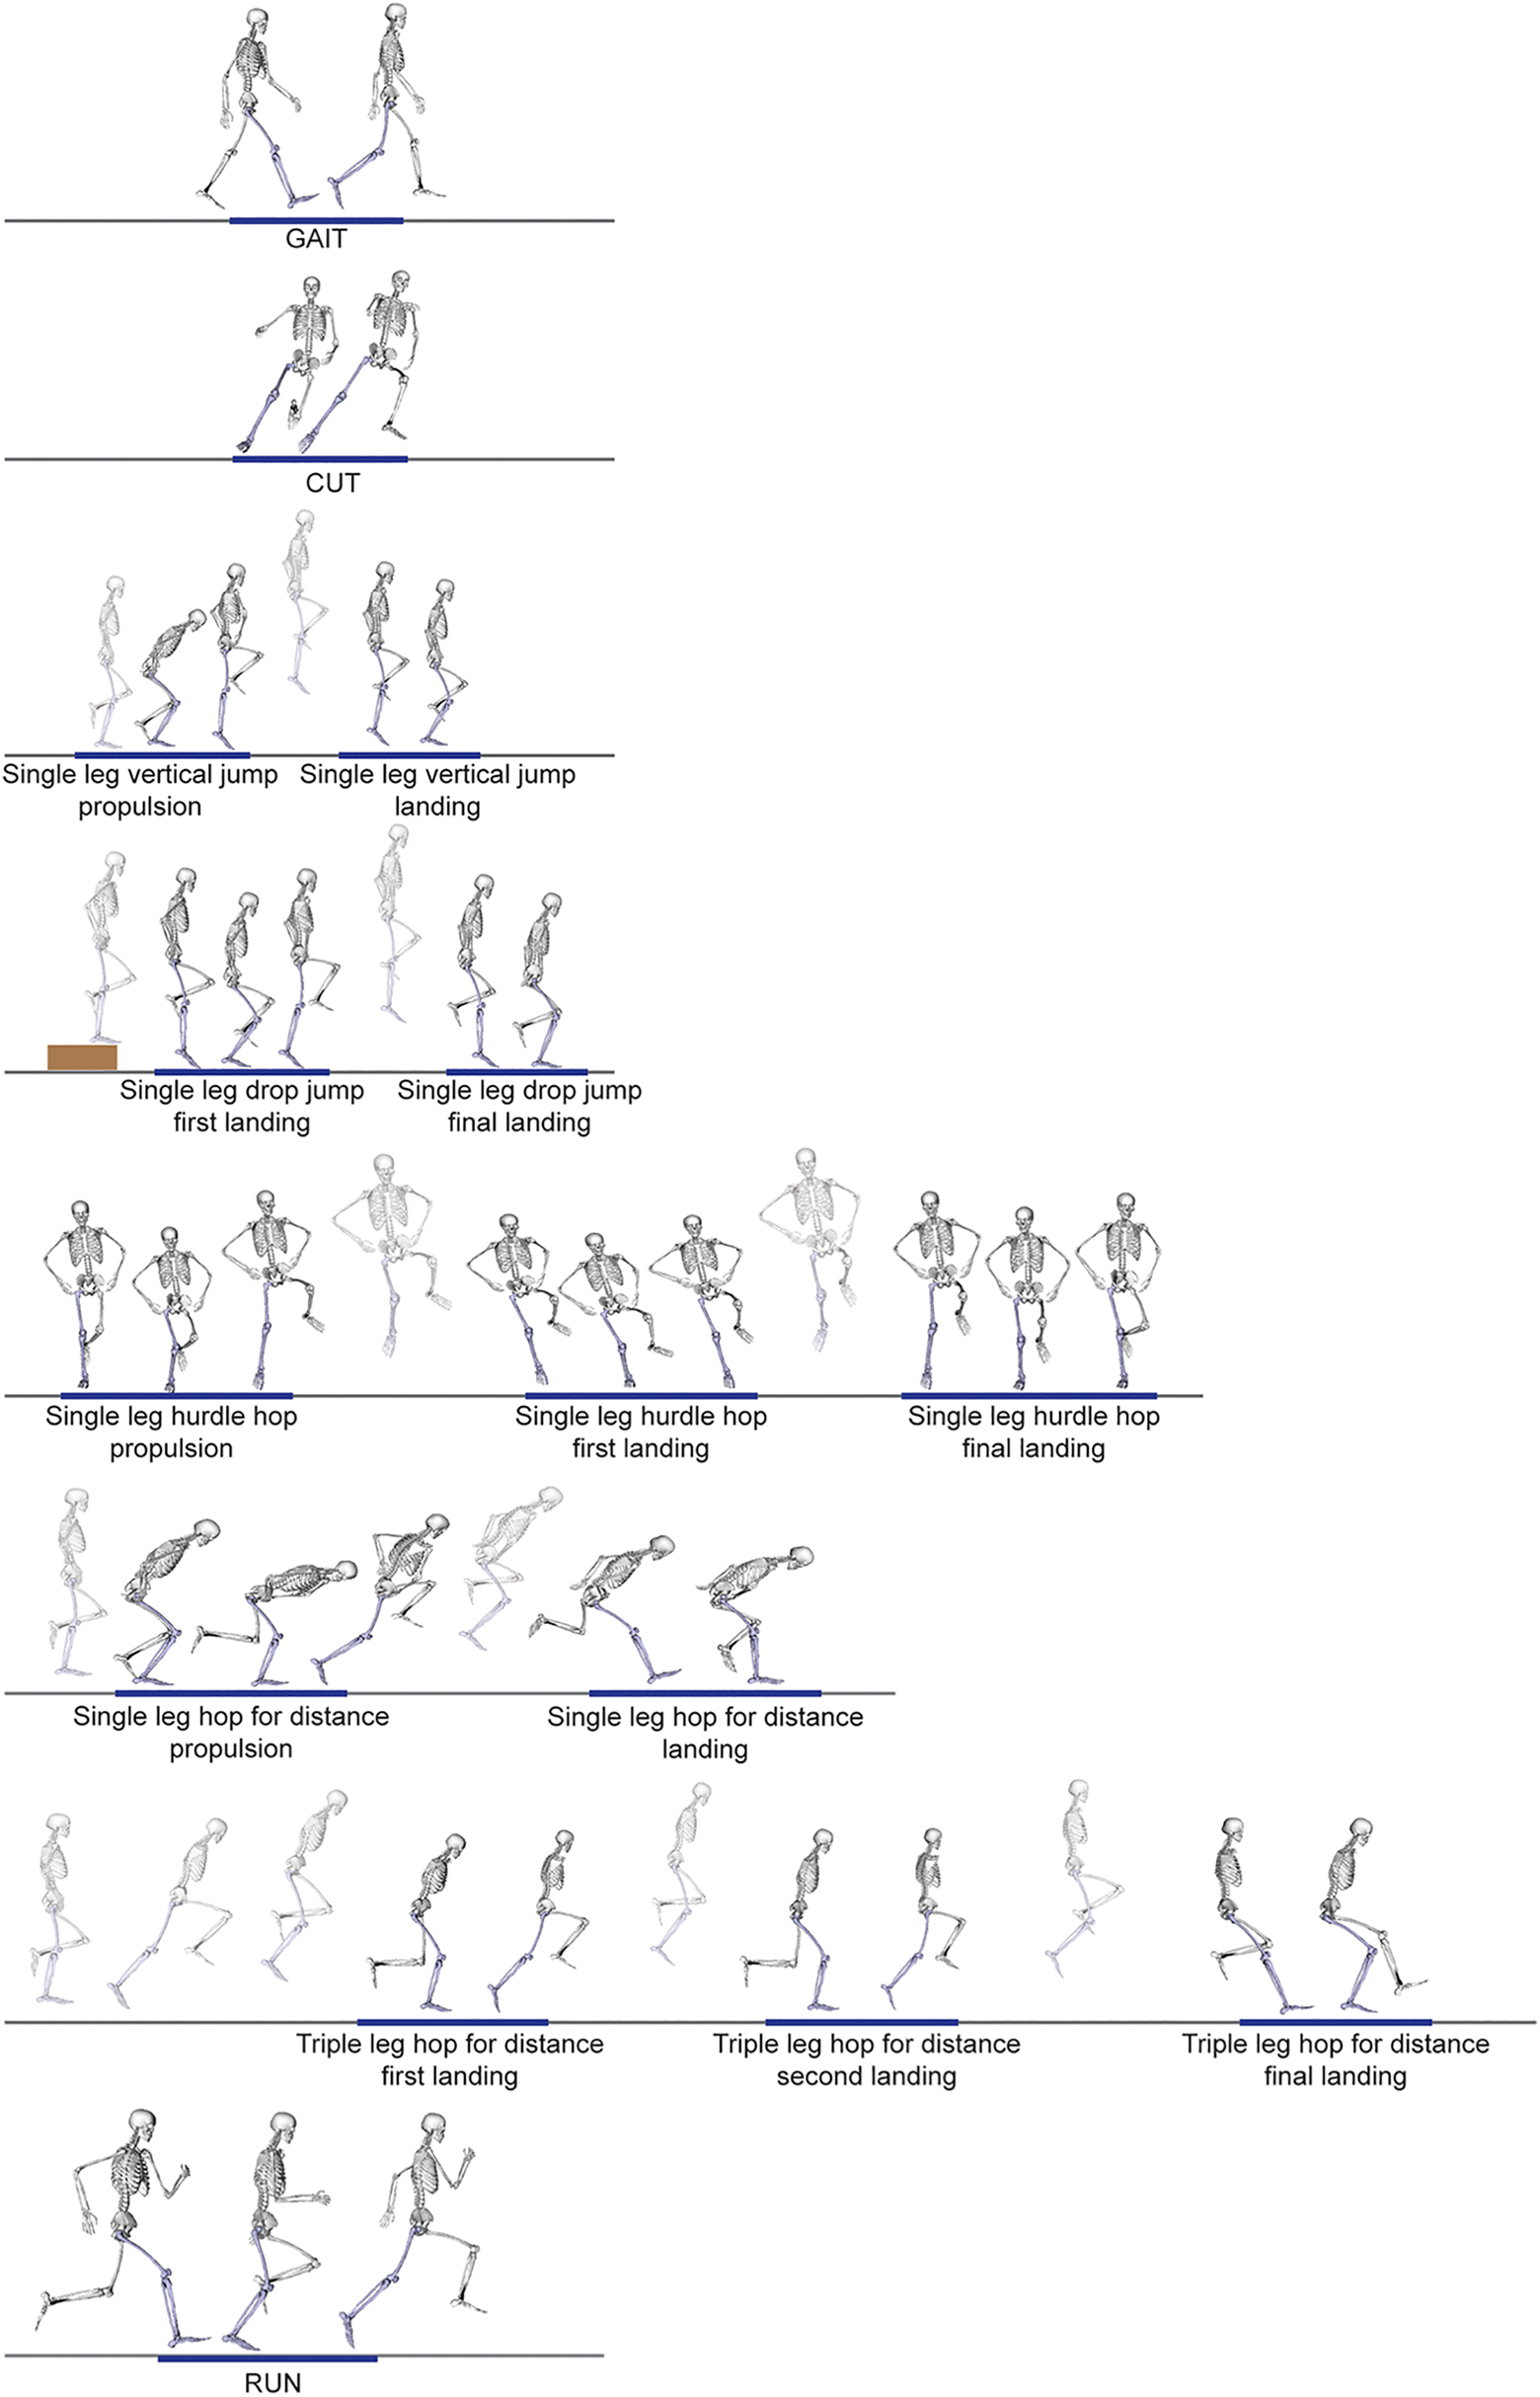
Description of the tasks and phases tested in athletes after anterior cruciate ligament reconstruction and the control group in order of task execution. CUT, side cutting 45°; GAIT, walking at self-selected speed; RUN, running maximum speed.
Musculoskeletal Model
We used a generic musculoskeletal model for deep squatting 7 and followed a musculoskeletal modeling workflow implemented in OpenSim 3.3 14 to calculate muscle and contact forces. While keeping the translational degrees of freedom as a function of the knee flexion angle, we extended the 1 degree of freedom knee with knee varus-valgus and knee internal-external rotation and added the knee ligaments. Ligament origin and insertion points, described in the model of Xu et al, 67 were registered in the Catelli model using host mesh fitting, 27 and ligament properties were the same as described by Xu et al. 67 We assumed that graft properties after reconstruction were similar to those of the native ligament and that the ligaments produced passive forces during elongation, given joint kinematics. The maximum isometric force of each muscle was tripled to allow the generation of high forces required to perform the dynamic movements. 30,39 The foot was modeled as 1 rigid segment.
First, the generic model was scaled to the participants’ anthropometric data. Subsequently, we used inverse kinematics to infer joint kinematics from the measured marker trajectories, while joint moments were determined using inverse dynamics implemented in OpenSim. An EMG-constrained static optimization approach that omitted force-length and force-velocity behavior 64 was used to determine the muscle forces required to balance the external joint moments while first accounting for the contribution of passive ligament forces. For this, EMG signals were filtered using a fourth-order Butterworth band-pass filter with a 20- to 400-Hz threshold and then rectified and filtered using a second-order low-pass Butterworth filter at 10 Hz; finally, filtered signals were normalized to the peak EMG value measured for the participant across all activities performed during data collection, which included maximum voluntary contractions, running, jumping, cutting, and hopping for maximum distance. 53
For the load-bearing phase of each task, we determined the maximum ACL forces, the resultant knee contact forces, 52 and the medial and lateral tibiofemoral contact forces (Appendix Figure A1). To account for participant-specific weight, ACL and contact forces were normalized to body weight.
Statistical Analysis
All data were coded and analyzed using SPSS Version 26.0 (IBM Corp). Descriptive statistics were used to summarize the participants’ characteristics and measurements. The outcome variables in each task were screened for outliers. The outcome variables were assessed for normality using the Shapiro-Wilk test. 46 For nonnormally distributed data, natural log transformations were applied before statistical analysis. Performance on the different tasks was compared between groups and between limbs by conducting linear mixed models for repeated observations, as this approach better handles missing data. 33 We used the Akaike information criterion and Bayesian information criterion in which a smaller number indicates a better fit to determine the appropriate error structure. The compound symmetry error structure always yielded the smallest Akaike information criterion and Bayesian information criterion values compared to other covariance patterns. 36 Post hoc comparisons were performed after adjusting for multiple comparisons. The parameters’ estimates were adjusted by including age and Tegner (activity) score in the model. Effect sizes were calculated using the pooled 9 (between-limb) and pooled weighted 22 (between-group) standard deviation. Values of 0.2, 0.5, and 0.8 were identified as the thresholds for small, moderate, and large effect sizes, respectively, 9 and a P value <.05 was considered the cutoff for statistical significance.
Results
The mean gait speed was 1.7 ± 0.1 m/s and 1.7 ± 0.2 m/s for the ACLR and control groups, respectively (P = .13). The mean running speed was 6.3 ± 0.4 m/s and 7.0 ± 0.4 m/s for the ACLR and control groups, respectively (P = .04). The mean approach speed during the change of direction task (cutting) was 4.1 ± 0.6 m/s for the involved limb, 4.1 ± 0.5 m/s for the uninvolved limb, and 4.6 ± 0.6 m/s for the control group (P < .001 between groups). Results are presented for the cutting and running tasks and include gait as the reference. Results for each phase of every task investigated are provided in the Appendix Table A1.
Total Contact Forces
For maximum total tibiofemoral contact forces, significant main effects for task (P < .001), group (P < .001), and task-by-group interaction (P < .001) were observed. In the ACLR group, the involved leg displayed significantly lower contact forces than the uninvolved leg during cutting (P < .001), running (P = .001), side hop propulsion (P < .001) and first landing (P = .011), and second landing of the triple hop (P = .004) (Figure 3 and Appendix Table A1).

Maximum total tibiofemoral contact forces for the involved leg, uninvolved leg, and controls. **P < .01. ***P < .001. BW, body weight; CUT, side cutting 45°; GAIT, walking at self-selected speed; RUN, running maximum speed.
Medial and Lateral Contact Forces
For maximum medial tibiofemoral contact forces, significant main effects for task (P < .001), group (P < .001), and task-by-group interaction (P < .001) were observed. The involved leg presented significantly lower medial contact forces than the uninvolved leg during cutting (P = .002), running (P = .037), side hop propulsion (P = .006) and first landing (P = .007), and first landing of the drop jump (P = .002) (Figure 4 and Appendix Figure A1 and Appendix Table A1). No difference between the involved leg and healthy controls was observed.
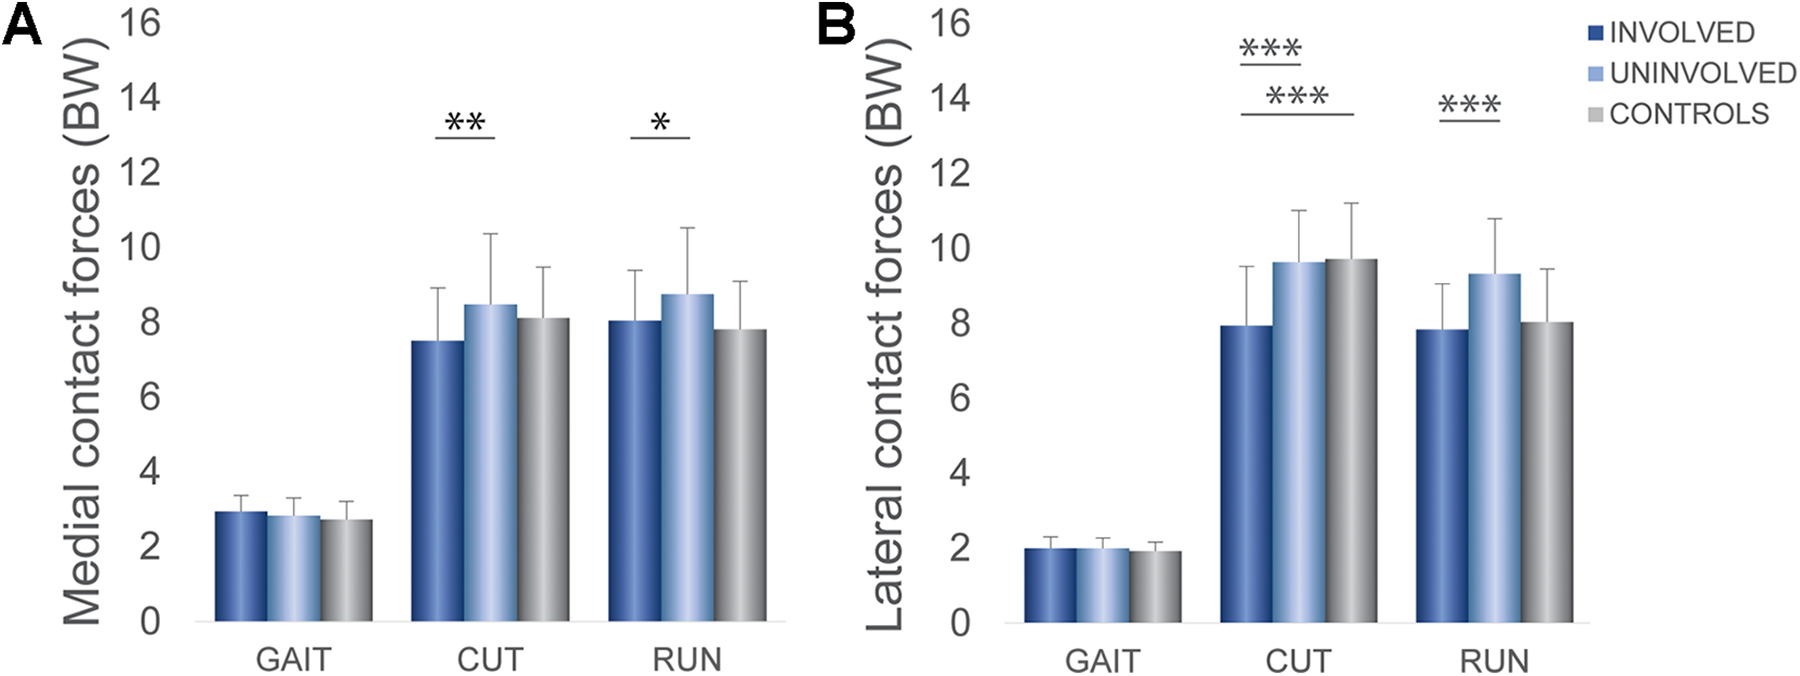
Maximum (A) medial and (B) lateral tibiofemoral contact forces for the involved leg, uninvolved leg, and controls. *P < .05. **P < .01. ***P < .001. BW, body weight; CUT, side cutting 45°; GAIT, walking at self-selected speed; RUN, running maximum speed.
Compared with the uninvolved limb, the involved limb showed significantly lower lateral contact forces during cutting (P < .001), running (P < .001), side hop propulsion (P < .001) and first landing (P = .014), first landing of the drop jump (P = .022), and second (P = .027) and third landings (P = .014) of the triple hop. Compared with the controls, the involved limb displayed significantly lower lateral contact forces during cutting (P < .001) and significantly higher forces during vertical jump propulsion (P = .026). Compared with the controls, the uninvolved limb displayed significantly higher lateral contact forces during propulsion of the vertical jump (P = .004) and propulsion of the side hop (P = .027) (Figure 4 and Appendix Table A1).
ACL Forces
For ACL forces, a significant main effect for tasks and groups was observed (P < .001), but there was no significant interaction effect for task by group (P = .78). In both groups, peak ACL forces were lowest during gait and highest during cutting compared to those during all other tasks (P < .001). Peak ACL forces during the side hop were higher than during the other tasks (P < .001), except for cutting, and were not significantly different from those during running or propulsion of the single hop for distance. In the ACLR group, the involved leg displayed significantly less ACL forces than the uninvolved leg during cutting (P = .025) and running (P = .004) (Figure 5 and Appendix Table A1).

Anterior cruciate ligament (ACL) forces for the involved leg, uninvolved leg, and controls. *P < .05. **P < .01. BW, body weight; CUT, side cutting 45°; GAIT, walking at self-selected speed; RUN, running maximum speed.
Discussion
Despite successfully meeting RTS criteria, athletes in the ACLR group displayed residual asymmetry in ACL and tibiofemoral contact forces. Tibiofemoral contact forces were lower in the involved limb compared with the uninvolved limb across several tasks. Lateral contact forces differed between limbs in the ACLR group as well as between groups during cutting. Cutting, running, and second landing of the triple hop resulted in the highest loads in the tibiofemoral joint. The tasks with the highest loads for the ACL were cutting and the side hop.
Contact Forces
Contact forces in the involved knee did not differ from those in the control group, and the observed asymmetries between limbs in total, medial, and lateral contact forces were mainly caused by the tendency for higher contact forces in the uninvolved knee compared with the controls. Given that after ACLR there is a higher OA prevalence in the contralateral knee (2%-38%) 35 compared with the global age-standardized prevalence (3.8%), 11 loading of the uninvolved limb should be carefully monitored during rehabilitation and at the time of RTS in the same way as for the involved knee.
In patients undergoing ACLR, musculoskeletal modeling has been used to determine contact forces mainly during gait, 18,44,63 revealing lower total contact forces of the involved knee compared with the uninvolved knee 18,63 and compared with a control group. 44 There are some substantial differences in the modeling methods (EMG driven vs EMG constrained vs specific implementations of mechanical optimization) that do make direct study-to-study comparisons of knee contact forces challenging. However, the differences observed between groups using an identical modeling workflow remain valid. In our cohort, we did not find differences in any outcome of interest during gait. Previous research has reported higher tibiofemoral contact forces during a drop landing task 56 and lower contact forces during a horizontal hop task 51 in the involved knee compared with those in uninjured controls. We did not detect differences in contact forces between the ACLR and control groups during the gait, drop jump, or horizontal hop tasks possibly because of sample, sex, and task differences between studies. It seems likely that the high-performance level in our cohort and the completion of a comprehensive rehabilitation protocol ensured the restoration of loading symmetry during these tasks at the time of RTS. However, we did find significantly lower tibiofemoral contact forces in the involved knee compared with the uninvolved knee and controls during more dynamic tasks such as cutting and running, in alignment with previous research. 6,44
Differences between limbs were more prominent for lateral tibiofemoral contact forces. During running, the ACLR group displayed lower lateral contact forces in the involved knee compared with the uninvolved knee but no difference compared with the control group. During cutting, the ACLR group had lower lateral contact forces in the involved knee compared with the uninvolved knee and controls. In contrast to Saxby et al, 44 who found significantly lower medial contact forces during gait, cutting, and running in patients at 2 to 3 years after ACLR compared with controls, we only observed differences laterally. Lateral contact forces were lower in the involved leg, independent of the fact that some of our patients underwent lateral external tenodesis, similar with previous research. 25,48
Total and compartmental (medial and lateral) contact forces were task and phase dependent. Compared to gait, the maximum total tibiofemoral contact forces were approximately 4 times higher during the 3 landings of the triple hop, cutting, running, and reactive phases of the drop jump and the side hop, which aligns with previous research. 44 High contact forces were observed during cutting, running, reactive phases of the vertical jump and the triple hop, and landings of the single hop and triple hop for distance. During the reactive phase of the vertical jump, contact forces were higher than those during landing of the vertical jump. These results can be used clinically to design a staged rehabilitation protocol with progressive ACL and knee loading.
ACL Forces
In contrast to tibiofemoral contact forces in which differences between limbs were found across several tasks, we found differences in ACL forces only during cutting and running. Our findings for greater ACL forces in the uninvolved knee after ACLR during cutting and running could potentially explain the higher incidence of ACL injuries in the contralateral leg that is reported in the literature upon RTS, especially in younger athletes. 65 The main dynamic maneuvers of elite male soccer players are running and change of direction, 4,54 similar to other multidirectional team sports, such as basketball, handball, and volleyball, which are also characterized by a high frequency of lateral movements and jumps. 54 Given that asymmetric ACL forces are only apparent during cutting and running, it seems important to include and biomechanically evaluate sport-specific activities, such as running and cutting in RTS testing procedures.
The second observation, that ACL forces were higher during cutting and the side hop compared to other tasks, is probably because of the knee position during these phases. The literature has reported that the mechanism of ACL injuries includes a combination of axial loading with the knee in shallow flexion, knee valgus, and tibial external rotation. 13,29,58 The tasks evaluated in the current study were mostly performed in the sagittal plane, with the exception of cutting and the side hop. We evaluated ACL loading because of the risk of excessive loading of the ACL graft and to inform clinicians on exercise selection during rehabilitation. Knowledge of these forces allows the progressive, safe reintroduction of higher load tasks in a graded manner.
Loading Asymmetry
It is unknown if and how long the observed loading asymmetries during dynamic tasks at the time of RTS persist. More importantly, we do not know if these asymmetries can be related to future injuries, abnormalities of the knee such as meniscal or chondral failure, or early OA. Lower knee loading has been linked to the risk of a second ACL injury, 42 knee joint cartilage degeneration, 49 and the development of tibiofemoral OA within 5 years after ACLR. 63 On the other hand, researchers have also associated overloading of articular tissue with cartilage damage 8 and consequently with OA development. 10,38 How OA is initiated and what factors trigger the disease process remain unclear, although the mechanical environment is accepted to be an important contributor. 23 While moderate mechanical loading appears necessary for maintaining healthy cartilage, abnormal joint loading (either insufficient loading or high-intensity joint loading) increases the risk of OA. 19
Clinical Implications
Our results showed that restoring performance symmetry in RTS criteria was not associated with symmetry in ACL or knee joint loading patterns. These differences were most pronounced for the higher loading tasks (cutting and running). Cutting was the most sensitive task to reveal asymmetries after ACLR and should be included in the testing battery at the time of RTS. Estimated ACL forces and loading of the tibiofemoral joint can be used to grade and stage different exercises during rehabilitation programs. For example, the vertical jump with a reactive phase (which has higher contact forces) should be commenced after the single hop for distance has been mastered. Loading of the uninvolved limb should be monitored during rehabilitation and at the time of RTS. Real-time biofeedback of tibiofemoral contact forces using visual, verbal, and tactile cueing has demonstrated short-term improvements in gait asymmetries. 43 Caution must be taken in the clinical evaluation of patients after ACLR in preparation for RTS. Currently, discharge criteria are based on performance (eg, height, distance) during functional tests; however, these are unable to detect tibiofemoral loading asymmetries. The restoration of symmetrical joint loading might protect against a second ACL injury or future knee degeneration changes. Further work is needed to evaluate the longitudinal changes in loading symmetry, not only during gait but also during sport-specific dynamic tasks, and their relationships with early postoperative cartilage changes in patients undergoing ACLR. Because monitoring knee loading requires advanced biomechanical equipment and skills, it is important to find proxies to measure knee loading in a clinical setting.
Limitations
There are several limitations to consider when interpreting our results. The recruitment of only male participants suggests caution in the extrapolation of these results to female patients. Prior studies have shown differences in movement patterns between men and women,16,61 and controversy remains in the literature regarding differences in the mechanisms by which men and women sustain ACL injuries. 5 Although musculoskeletal modeling allows for the prediction of in vivo contact forces without invasive methods, it is not without limitations. The omission of the force-length and force-velocity relationship and the assumption of rigid tendon behavior may be considered a limitation in these dynamic motions, as plyometric force augmentation is not accounted for. The ACL strain is dependent on knee kinematics, and the generic attachment points might be a limiting factor. Also, the ACL force length curve was a generic curve. Many factors can affect the tensile properties of a graft. Our assumption that the stiffness of the graft is the same as that of the native ligament is a limitation. We used a generic model and not a participant-specific modeling approach that incorporates each participant’s lower limb anatomy. Finally, a cross-sectional design was used, which provides only a single time point to evaluate loading asymmetries.
Conclusion
Clearance to RTS with the current discharge criteria did not ensure symmetrical knee loading in patients after ACLR. Specifically, athletes who underwent ACLR appeared to present knee loading asymmetries in several dynamic sport-relevant tasks tested and higher ACL forces in their uninvolved leg during cutting and running. The uninvolved limb should be monitored during rehabilitation and at the time of RTS in the same way as the involved limb. Cutting and running were the most sensitive tasks to reveal loading asymmetries in athletes after ACLR and should be included in the testing battery at the time of RTS.
Footnotes
Acknowledgment
The authors thank the physical therapists (ACL Group) of Aspetar’s Rehabilitation Department for assisting with participant recruitment.
Final revision submitted November 15, 2021; accepted January 6, 2022.
The authors have declared that there are no conflicts of interest in the authorship and publication of this contribution. AOSSM checks author disclosures against the Open Payments Database (OPD). AOSSM has not conducted an independent investigation on the OPD and disclaims any liability or responsibility relating thereto.
Ethical approval for this study was obtained from the Anti-Doping Laboratory Qatar Institutional Review Board (No. F2017000227).
Appendix
ACL and Tibiofemoral Contact Forces During All Phases of the Tasks Tested a

| INVOLVED | UNINVOLVED | CONTROLS | INV-UNINV | INV-CONTROLS | UNINV-CONTROLS | ||||
|---|---|---|---|---|---|---|---|---|---|
| Mean ± SD | Mean ± SD | Mean ± SD | P Value | ES | P Value | ES | P Value | ES | |
| ACL force | |||||||||
| GAIT | 0.26±0.05 | 0.26±0.05 | 0.25±0.04 | 0.99 | 1.00 | 1.00 | |||
| CUT | 0.36±0.08 | 0.39±0.08 | 0.34±0.08 |
|
|
1.00 | 0.78 | ||
| RUN | 0.32±0.06 | 0.34±0.07 | 0.32±0.06 |
|
|
0.82 | 0.96 | ||
| SLJ PR | 0.30±0.06 | 0.32±0.06 | 0.29±0.05 | 0.08 | 1.00 | 0.91 | |||
| SLJ LAND | 0.30±0.06 | 0.31±0.06 | 0.29±0.05 | 0.21 | 0.99 | 0.98 | |||
| DJ LAND1 | 0.32±0.06 | 0.34±0.07 | 0.30±0.05 | 0.18 | 0.99 | 0.74 | |||
| DJ LAND2 | 0.30±0.06 | 0.34±0.07 | 0.30±0.05 | 0.12 | 1.00 | 0.92 | |||
| HH PR | 0.34±0.07 | 0.36±0.06 | 0.33±0.06 | 0.07 | 1.00 | 0.87 | |||
| HH LAND1 | 0.30±0.06 | 0.32±0.06 | 0.30±0.06 | 0.06 | 0.99 | 0.94 | |||
| HH LAND2 | 0.32±0.06 | 0.33±0.06 | 0.30±0.05 | 0.14 | 1.00 | 0.81 | |||
| SLHD PR | 0.32±0.06 | 0.34±0.07 | 0.31±0.06 | 0.31 | 1.00 | 0.95 | |||
| SLHD LAND | 0.31±0.07 | 0.31±0.06 | 0.29±0.05 | 0.62 | 0.96 | 0.92 | |||
| TRHOP1 | 0.31±0.07 | 0.32±0.29 | 0.29±0.06 | 0.63 | 0.95 | 0.71 | |||
| TRHOP2 | 0.32±0.07 | 0.33±0.07 | 0.29±0.06 | 0.53 | 0.93 | 0.73 | |||
| TRHOP3 | 0.31±0.06 | 0.32±0.06 | 0.30±0.05 | 0.50 | 0.99 | 1.00 | |||
| Total TF force | |||||||||
| GAIT | 5.03±0.71 | 4.96±0.72 | 4.70±0.76 | 0.89 | 0.99 | 1.00 | |||
| CUT | 14.89±2.66 | 16.88±3.46 | 15.86±2.18 |
|
|
0.07 | 1.00 | ||
| RUN | 15.38±2.37 | 16.93±2.96 | 15.09±2.34 |
|
|
0.95 | 0.52 | ||
| SLJ PR | 14.95±2.89 | 15.20±2.94 | 12.63±2.01 | 0.90 | 0.14 | 0.07 | |||
| SLJ LAND | 11.24±1.95 | 11.77±1.98 | 11.02±1.88 | 0.17 | 0.87 | 0.99 | |||
| DJ LAND1 | 15.61±2.35 | 16.59±2.29 | 14.70±2.51 |
|
|
0.99 | 0.51 | ||
| DJ LAND2 | 11.93±1.88 | 12.10±1.47 | 11.48±1.52 | 0.88 | 0.94 | 0.99 | |||
| HH PR | 12.56±2.34 | 14.11±2.09 | 11.77±2.10 |
|
|
1.00 | 0.08 | ||
| HH LAND1 | 14.48±2.14 | 15.71±2.81 | 14.32±2.48 |
|
|
0.83 | 0.91 | ||
| HH LAND2 | 11.90±1.98 | 11.17±1.16 | 10.69±1.33 | 0.18 | 0.86 | 0.99 | |||
| SLHD PR | 15.12±2.67 | 15.59±2.12 | 13.43±2.58 | 0.40 | 0.46 | 0.14 | |||
| SLHD LAND | 15.22±2.50 | 14.97±2.52 | 13.64±1.54 | 0.89 | 0.72 | 0.89 | |||
| TRHOP1 | 15.60±2.16 | 16.79±2.55 | 14.52±2.54 | 0.18 | 0.99 | 0.40 | |||
| TRHOP2 | 16.02±2.53 | 17.39±2.38 | 15.08±1.89 |
|
|
1.00 | 0.34 | ||
| TRHOP3 | 16.15±2.25 | 16.75±2.73 | 14.94±1.31 | 0.51 | 0.99 | 0.78 | |||
| Medial TF force | |||||||||
| GAIT | 2.93±0.44 | 2.89±0.47 | 2.72±0.49 | 0.94 | 0.99 | 1.00 | |||
| CUT | 7.51±1.41 | 8.47±1.90 | 8.12±1.35 |
|
|
0.15 | 0.97 | ||
| RUN | 8.04±1.35 | 8.75±1.78 | 7.81±1.29 |
|
|
0.99 | 0.81 | ||
| SLJ PR | 10.02±2.59 | 10.63±2.95 | 8.35±2.22 | 0.25 | 0.27 | 0.06 | |||
| SLJ LAND | 5.60±1.09 | 5.84±1.17 | 5.52±1.10 | 0.47 | 0.86 | 0.99 | |||
| DJ LAND1 | 9.42±2.21 | 10.53±2.42 | 8.65±2.11 |
|
|
0.98 | 0.18 | ||
| DJ LAND2 | 5.87±1.25 | 5.94±1.03 | 5.69±1.02 | 0.95 | 0.90 | 0.97 | |||
| HH PR | 6.84±2.15 | 7.47±1.53 | 5.97±1.15 |
|
|
0.89 | 0.12 | ||
| HH LAND1 | 7.83±1.43 | 8.70±1.90 | 7.54±1.58 |
|
|
0.99 | 0.66 | ||
| HH LAND2 | 5.84±1.32 | 5.48±0.70 | 5.05±0.91 | 0.40 | 0.72 | 0.99 | |||
| SLHD PR | 8.36±1.96 | 8.75±1.84 | 7.63±2.15 | 0.29 | 0.90 | 0.46 | |||
| SLHD LAND | 7.59±1.53 | 7.59±1.44 | 6.82±1.01 | 1.00 | 0.92 | 0.91 | |||
| TRHOP1 | 8.06±1.40 | 8.74±2.10 | 7.60±1.62 | 0.42 | 1.00 | 0.81 | |||
| TRHOP2 | 8.44±2.41 | 8.74±1.48 | 7.72±1.33 | 0.27 | 1.00 | 0.81 | |||
| TRHOP3 | 8.27±1.35 | 8.53±1.53 | 7.54±0.97 | 0.79 | 0.99 | 0.86 | |||
| Lateral TF force | |||||||||
| GAIT | 2.00±0.30 | 2.00±0.27 | 1.93±0.24 | 1.00 | 1.00 | 1.00 | |||
| CUT | 7.94±1.58 | 9.63±1.38 | 9.72±1.49 |
|
|
|
|
0.70 | |
| RUN | 7.83±1.23 | 9.32±1.47 | 8.03±1.43 |
|
|
0.56 | 0.07 | ||
| SLJ PR | 7.07±1.22 | 7.27±1.19 | 5.92±0.84 | 0.66 |
|
|
|
|
|
| SLJ LAND | 5.98±1.32 | 6.36±1.22 | 6.07±1.15 | 0.06 | 0.58 | 1.00 | |||
| DJ LAND1 | 8.89±1.07 | 9.63±1.22 | 6.07±1.15 |
|
|
0.99 | 0.22 | ||
| DJ LAND2 | 6.40±1.06 | 6.51±0.89 | 6.21±1.24 | 0.85 | 0.99 | 0.99 | |||
| HH PR | 6.21±1.03 | 7.15±1.05 | 5.98±0.97 |
|
|
1.00 |
|
|
|
| HH LAND1 | 7.50±1.34 | 8.20±1.58 | 7.64±0.99 |
|
|
0.48 | 0.98 | ||
| HH LAND2 | 6.13±1.07 | 5.75±0.68 | 5.70±1.04 | 0.19 | 0.93 | 0.93 | |||
| SLHD PR | 7.40±1.20 | 7.59±0.92 | 6.62±1.15 | 0.67 | 0.33 | 0.10 | |||
| SLHD LAND | 8.03±1.25 | 8.38±1.11 | 7.93±0.94 | 0.32 | 0.93 | 0.98 | |||
| TRHOP1 | 8.35±1.31 | 8.93±1.03 | 8.23±1.03 | 0.28 | 0.97 | 0.81 | |||
| TRHOP2 | 8.90±1.44 | 9.60±1.31 | 8.74±1.06 |
|
|
0.91 | 0.70 | ||
| TRHOP3 | 8.36±1.16 | 9.09±1.18 | 8.81±1.02 |
|
|
0.16 | 0.96 | ||
a Bold indicates statistically significant differences and their respective effect sizes. Values are presented as mean ± SD. ACL, anterior cruciate ligament; ES, effect sizes.