
Abstract
Background:
The mechanism for traumatic ruptures of the native anterior cruciate ligament (ACL) is frequently a noncontact injury involving a valgus moment with internal rotation of the tibia. The abnormal rotation and translation of the lateral femoral condyle posteroinferiorly relative to the lateral tibial plateau is thought to be related to the geometry of the tibial plateau.
Purpose/Hypothesis:
The purpose of the study was to mathematically model the posterior tibial plateau geometry in patients with ACL injuries and compare it with that of matched controls. The hypothesis was that increased convexity and steepness of the posterior aspect of the lateral plateau would subject knees to higher forces, leading to a potentially higher risk of ACL injury.
Study Design:
Cross-sectional study; Level of evidence, 3.
Methods:
We mathematically modeled the posterior curvature of the lateral tibial plateau in 64 patients with ACL injuries and 68 matched controls. Using sagittal magnetic resonance imaging scans of the knee, points on the articular cartilage of the posterolateral tibial plateau were selected and curve-fitted to a power function (y = a × xn ). For coefficient a and coefficient n, both variables modulated the shape of the curve, where a larger magnitude represented an increase in slope steepness. Groups were compared using a Mann-Whitney test and α < .05.
Results:
There was a significant difference in surface geometry between the patients with ACL injuries and matched controls. The equation coefficients were significantly larger in the patients with ACL injuries: coefficient a (ACL injury, 0.9 vs control, 0.68; P < .0001) and coefficient n (ACL injury, 0.34 vs control, 0.30; P = .07). For coefficient a, there was a 78.9% sensitivity, 77.5% specificity, and odds ratio of 12.6 (95% CI, 5.5-29.0) for ACL injury using a cutoff coefficient a = .78.
Conclusion:
Patients with ACL injuries had a significantly greater posterolateral plateau slope. The steeper drop off may play a role in higher anterior translation forces, coupled with internal rotation torques on the knee in noncontact injury, which could increase ACL strain and predispose to ACL injury.
Anterior cruciate ligament (ACL) injuries are frequent among athletes and a leading cause of time away from competition. 14 Although ACL tears can occur in many sports, they are exceedingly prevalent in cutting sports, such as soccer. Female athletes are particularly prone to these injuries and, in fact, tear their ACL 2 to 8 times more frequently than do male athletes. 22 The consequences of injury have significant long-term implications for patients. Despite generally good outcomes after ACL reconstruction (ACLR), a number of patients have persistent instability, and many are not able to return to their preinjury level of competition. 7,18 Graft failure can even be more devastating to patients than is the original injury. 8 Thus, ACL injury prevention and new research focusing on a better understanding of risk factors has garnered more attention over the past several years.
The mechanism for traumatic ruptures of the native ACL is frequently a noncontact injury involving a valgus moment with internal rotation of the tibia. 22 The abnormal rotation and translation of the distal lateral femoral condyle occurs in the posteroinferior direction (relative to the lateral tibial plateau). These findings are confirmed by the locations of the bony contusions frequently present after a native ACL injury. Bony contusions are typically noted at the distal lateral femoral condyle and the posterior aspect of the lateral tibial plateau, suggesting mutual contact of both anatomic landmarks at the time of injury. 19,25,28 This has led to a new research focus investigating the role of tibial plateau geometry in the tibiofemoral mechanics of ACL injury.
A number of benchmark studies have indicated a strong correlation between increased tibial slope and a higher risk for native ACL injuries. 2,9 –12,16,23,28,29 These studies have approximated the tibial slope using subchondral bone, the lateral meniscus, and/or the entire cartilaginous surface of the tibial plateau. Despite these differences, patients at risk of noncontact ACL injury appear to consistently demonstrate increased posteroinferior-directed slopes on the posterolateral tibial plateau compared with uninjured controls. During sports-related movements, such as jump landing, the magnitude of ACL strain values has been directly related to the posteroinferior-directed slope of the subchondral bone of the proximal tibia. 13,15 Thus, the posterior tibial plateau has important implications for loading the knee, particularly in the context of the ACL to limit anterior tibial translation, and the anterolateral ligament (ALL) acts as a secondary restraint for internal rotation of the tibia. 6
The purpose of the study was to mathematically model the posterior tibial plateau geometry in patients with ACL injuries compared with matched controls to identify patients at risk of ACL injury. To our knowledge, no previous study has specifically focused on the potential correlation between ACL injury and the posterolateral plateau geometry, specifically, the cartilaginous surface of the posteroinferior slope of the lateral tibial plateau’s convexity. The current study moves away from a 1-dimensional description of mean tibial slope (linear, subchondral bone) to a 2-dimensional (nonlinear) characterization of the cartilaginous surface. We think this better represents the biomechanics of the tibiofemoral joint. Therefore, our hypothesis was that patients with knees with increased convexity and steepness of the posterior aspect of the lateral plateau would be at higher risk of ACL injury.
Methods
The study was approved by the ethical review board at our university. The study design was a case-control study involving patients undergoing primary ACLR at our institution between 2008 and 2015. Magnetic resonance imaging (MRI) scans of the knee were used in 68 patients with ACL injuries and 68 controls matched by sex for the mathematical modeling of the posterior tibial plateau (Table 1). All participants were aged >18 years and <40 years. Patients with missing data and/or MRI scans, infections, associated fractures, or multiligament knee injuries were excluded from the study. Four cases of ACL reconstruction could not be analyzed and were removed from the data set because of technical issues with the MRI scan (eg, image artifact that made the scan unreliable).
Characteristics of the Study Groups a

a Data are reported as n or mean ± SD. ACL, anterior cruciate ligament.
Preoperative MRI scans were used for patients with ACL injuries. The MRI studies were performed using a magnetic field of 1.5 T (Signa HDxT; General Electric Medical Systems) with an 8-channel knee coil (HD TR Knee Array) and processed in an IntelePACS system (Intelerad Medical Systems Inc). Images were collected according to standard departmental protocols for knee MRI, which included sagittal fat-suppressed spin-echo proton-density images (repetition time/echo time [TR/TE], 2000-3000/42 milliseconds), sagittal fat-suppressed fast spin-echo T2-weighted images (TR/TE, 4000/70 milliseconds) and coronal fat-suppressed proton density sequence (TR/TE, 2000-3000/42 milliseconds), axial fat-suppressed spin-echo proton density images (TR/TE, 2000/42 milliseconds), and a sagittal proton density sequence (TR/TE, 2000-3000/42 milliseconds). A slice thickness of 4 mm with 0.4-mm interslice gap was used.
A 2-dimensional approach was taken to analyze the tibial convexity on a specific sagittal slice of a participant’s knee MRI scans. We began with an axial slice of the tibial plateau in axial T2 reconstruction. The epicondylar axis was drawn, and the midpoint was identified along the axis (or center of the entire tibial plateau from medial to lateral) (Figure 1). Then, the center of the lateral tibial plateau was identified as the point midway between the center point and the lateral aspect of the tibial plateau. The MRI sagittal slice transecting the latter point in the center of the lateral tibial plateau was the image we used to analyze the lateral tibial plateau’s convexity.
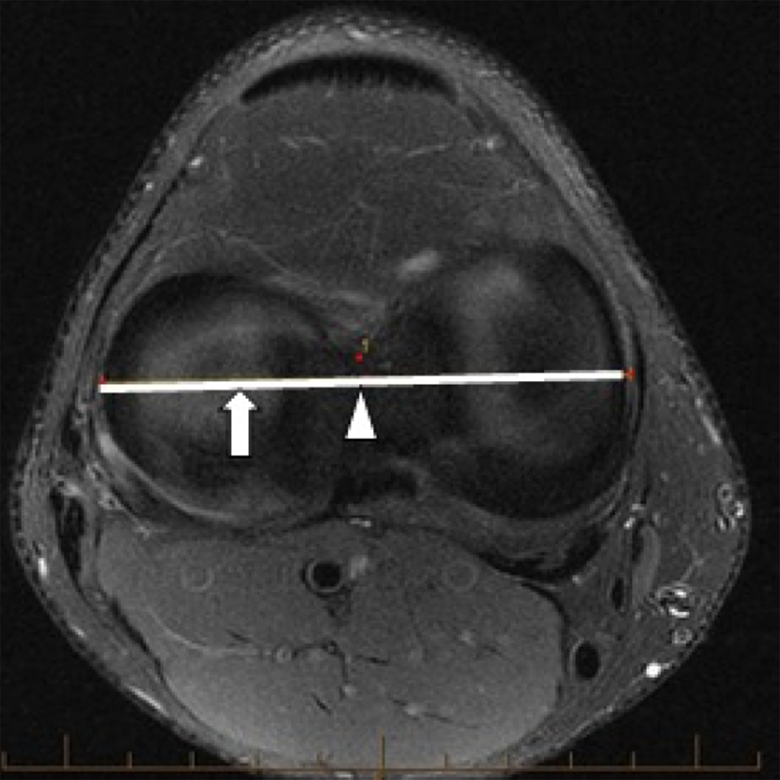
Magnetic resonance imaging axial slice of the tibial plateau. The solid horizontal line represents the epicondylar axis. The arrowhead is the center of the epicondylar axis. The arrow is the midpoint between the lateral epicondyle and center of the epicondylar axis. This arrow demarcates the intersecting point for the sagittal image to be used for subsequent analysis. (The red dots are cursors that were automatically created in the PACS measuring system and do not represent any additional findings.)
Postprocessing of these images was performed using a custom code in open-source software Python 2.7.0 (Python Software Foundation). MRI scans were anonymized, and all authors were blinded to the patient group (ACL injury vs control). Ten points were manually plotted along the cartilaginous surface of the posterior tibial plateau. The starting point was defined as the superiormost aspect of the convexity. We standardized this starting point by using the longitudinal tibial axis and a corresponding perpendicular line; the point where the perpendicular line intersected the cartilaginous surface of the tibial plateau at a tangent was the starting point. The longitudinal axis of the tibia was determined according to the technique described by Hashemi et al 9 (Figure 2). In brief, a sagittal slice transecting the center of the epicondylar axis was used. The midpoint of the tibial diaphysis was found using sets of 2 points placed along the anterior and posterior cortex of the tibia. A vertical line drawn to connect multiple midpoints made up the longitudinal axis. For the remaining points along the convexity, we continued in the posterior direction from the starting point along the cartilaginous surface until the posteriormost aspect of the convexity (where the tibial plateau slopes inferiorly until becoming vertical and just proximal to the tibial metaphysis) (Figure 3). The first and last points were standardized, and the remaining points were manually placed approximately equal distances between the first and last points.

Sagittal magnetic resonance imaging (MRI) scan of the knee located at the center of the epicondylar axis. The longitudinal axis (blue line) of the tibia was identified using the technique previously described by Hashemi et al. 9 Briefly, 2 points were placed at the level of the tibial tuberosity: 1 point along the anterior cortex of the tibia and the second point on the posterior cortex. Another set of 2 points was placed approximately 5 cm inferior to the tibial tuberosity (or if the MRI scan did not permit, we selected the most distal aspect of the tibia), again along the anterior and posterior cortex of the tibia. Next, the midpoints for each set of 2 points were identified, and a vertical line was drawn to connect the midpoints to form the longitudinal axis (blue line). The yellow line represents the corresponding perpendicular line.
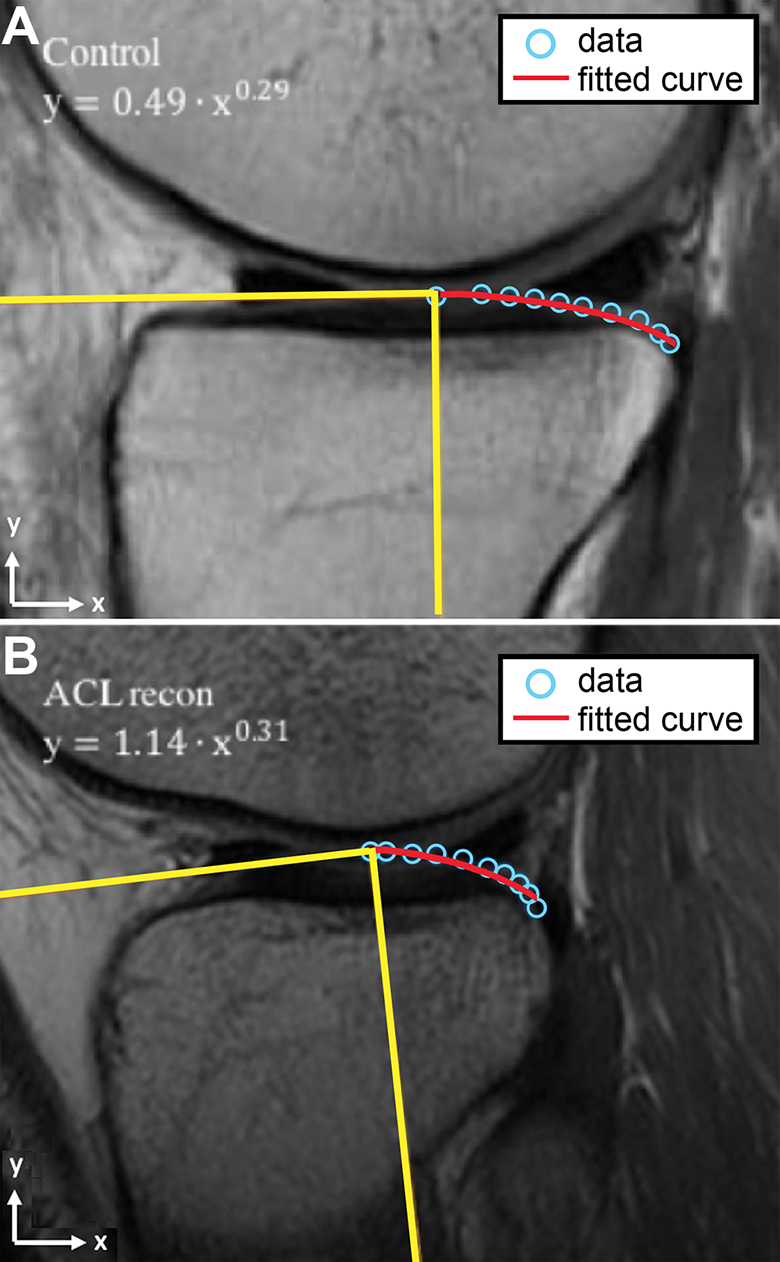
Sagittal magnetic resonance imaging scan of the knee located at the midpoint of the lateral tibial plateau in the mediolateral direction for the (A) controls and (B) patients with anterior cruciate ligament (ACL) injuries. We superimposed the longitudinal axis of the tibia (vertical yellow line) and its corresponding perpendicular line (horizontal yellow line). Ten points were manually plotted (blue dots) along the cartilaginous surface of the posterior apex of the convexity. The starting point was the point where the perpendicular line formed a tangent to the cartilaginous surface. The remaining points were plotted along the cartilaginous surface until the posterior aspect of the posterior convexity. The red line represents the fitted curve.
We calculated the coefficients using a custom computer program created in Python software (Python 2.7.0; Python Software Foundation). Python has a curve-fitting toolbox that allowed us to perform nonlinear least-squares regression. In our program, we input our x and y coordinates and applied the nonlinear curve-fitting function to fit the 10 points to a power function (y = a · xn ). The least-squares regression then created a curve with the least amount of error compared with the 10 points. The program outputs values that allowed us to understand the shape of the equation (with coefficient a and coefficient n) and the goodness of fit of the equation with root-mean-square error (RMSE).
The curve was meant to represent the posterolateral articular cartilage geometry, which is different and independent from the meniscal slope and bony slope. 11 We did not encounter any patients with significant cartilage defects and were able to place the 10 points along the articular cartilage surface. For coefficient a and coefficient n, both variables modulate the shape of the curve, where a larger magnitude represented an increase in slope steepness. Figure 3 demonstrates the shape of a power curve fit in a participant with ACL injury and a matched control. No intercept was included because the articular cartilage height was normalized to the starting point for each individual.
Statistical Analysis
We compared all data between our controls and patients with ACL injuries, including population-defined characteristics and curve-fit coefficients a and n, using the Mann-Whitney U test for parametric variables and chi-square test for nonparametric variables. A subgroup analysis for men and women was also performed for the curve-fit coefficients. The predictive validity of the curve-fit coefficients was determined using receiver operating characteristic (ROC) curve statistics. The cutoff coefficient was determined using the coordinate points of the ROC curve. We selected the cutoff point with the highest statistical accuracy in our analysis. Statistical significance was set to α = .05. All statistical analysis was performed using SPSS Statistics Version 16.0 (SPSS Inc).
Results
We observed a significant difference in the tibial surface geometry between our patients with ACL injuries and controls (Table 2). All of the data for the posterolateral tibial plateau geometry profile plots are shown in Figure 4 for women, men, and all pooled participants. Figure 5 highlights the comparison between patients with ACL injuries and controls with the average curve for all pooled participants. Graphically, posteroinferior-directed slopes were greater in patients with ACL injuries for all pooled participants. This was also seen in our modeled power equation, where our patients with ACL injuries demonstrated larger coefficients overall compared with controls (Table 2). For example, for all pooled participants, coefficient a was larger in patients with ACL injuries compared with controls (0.90 vs 0.68; P < .0001). Likewise, coefficient n was also larger in patients with ACL injuries versus controls (0.34 vs 0.30), although not statistically significant (P = .07). The average RMSE was <0.02 for all groups, indicating a goodness of fit. There was also no difference in RMSE between patients with ACL injuries and controls (P > .05) in these group comparisons.
Nonlinear Modeling of the Posterolateral Tibial Plateau in the Study Groups a

a Data are reported as mean ± SD. Coefficients model a nonlinear equation: y = a · xn . Bolded P values indicate statistical significance. ACL, anterior cruciate ligament; RMSE, root mean square error.

Posterolateral tibial geometry profiles (raw data set before curve fitting) for patients with anterior cruciate ligament (ACL) injuries and normal controls in (A) all participants combined, (B) women, and (C) men. The figure shows the curvature of the posterolateral tibial plateau in the sagittal plane, where the y-axis is aligned with the long axis of the tibia and the x-axis is aligned with the anteroposterior direction of the tibia.

Average curve for the posterolateral tibial geometry in patients with anterior cruciate ligament (ACL) injuries versus uninjured controls shown in all participants combined. The curve shows the posterolateral tibial plateau in the sagittal plane, where the y-axis is aligned with the long axis of the tibia and the x-axis is aligned with the anteroposterior direction of the tibia. The x-axis in each participant was normalized to the maximum value for comparison. The y-axis represents the height (in centimeters).
The ROC curve was performed only for statistically significant coefficient a. We found coefficient a had a sensitivity of 78.9% and specificity of 77.5% for predicting ACL injury, using a cutoff coefficient a = .78. The odds ratio was 12.6 (95% CI, 5.5-29.0).
Discussion
We present a new technique to mathematically quantify the posterolateral cartilaginous geometry of slope. Patients with ACL injuries demonstrated greater slopes in the posterolateral tibia using our curve-fit power function to characterize the geometry. This abnormally steep slope may play a role in greater forces on the knee that could predispose to ACL injury. These findings are in line with what is known about the biomechanics of noncontact ACL injury. Based on previous in vitro testing, we know that greater posterior tibial slopes are correlated with larger anterior tibial acceleration profiles and ACL strain values during simulated impulsive landing movements. 13,15 The anterior translation of the tibia occurs in combination with internal and external rotation moments, whereby the tibiofemoral joint pivots about the long axis of the medial compartment during flexion-extension cycle of the knee. 4 These coupled movements and the geometry may encourage excessive internal rotation and translation of the lateral femoral condyle in the posteroinferior direction until the distal lateral femoral condyle slides off the posterior aspect of the lateral tibial plateau, producing the characteristic bony contusion we typically see in these structures for ACL injuries.
While many studies have modeled the tibial plateau surface, our study adds novelty by focusing on the actual functional anatomy. Thus, we examined the cartilage (rather than bone contour) and described only the posterolateral aspect of the cartilaginous surface using a nonlinear power function model. A noteworthy study by Beynnon et al 1 was conducted in which the entire tibial plateau surface was modeled using a fifth-order polynomial equation and demonstrated a unique surface geometry profile that may predispose to noncontact ACL injuries. Given that the objective for Beynnon et al was to implicate morphologic subtleties (eg, cartilaginous incongruities secondary to injury, the concavity located centrally within the larger lateral compartment’s convexity), it was necessary to have higher order polynomials for greater precision. However, in the context of our study objectives, we have a more focused area of interest that we think is implicated in ACL mechanism of injury: the posterior tibial plateau’s convexity in the lateral compartment. Thus, we chose an approach using simple applied mathematics (a power curve function) to precisely and quantitatively model the posterior curvature of the lateral tibial plateau’s convexity.
We found that the coefficients used to model a patient’s tibial plateau geometry had good predictive value for determining ACL injury in patients with ACL injuries compared with controls, showing a sensitivity of 78.9% and specificity of 77.5% for coefficient a. Therefore, this new methodology has the potential to permit orthopaedic surgeons to effectively and efficiently distinguish patients who were at high risk of sustaining an ACL injury based on an element of their anatomy increasing anterior translation forces sustained by their knee joint. In subsequent work, we are attempting to further simplify and automate the process and make the calculation and program available for general use by the orthopaedic community. We envision the simplified version stratifying patients into the “low coefficient a” group and the “high coefficient a” group. In the clinical setting, patients in the low coefficient a group would represent “unlucky” patients who sustained an ACL tear without an anatomic predisposition to ACL injury. On the other hand, patients in the high coefficient a group would represent “predestined” or “ticking time bomb” patients who were at higher risk of sustaining an ACL injury based on their specific anatomic predisposition. Patients considered unlucky or in the low coefficient a group would potentially just need an anatomic ACLR to recreate their normal anatomy. Patients considered predestined or in the high coefficient a group would potentially benefit from surgery with an additional ability to control rotational instability or slope reducing osteotomy. However, this is still in the early phases, and it is still unclear how to best translate these findings to make surgical corrections on the tibial slope.
We also theorize that this high convexity and steep drop-off of the posterior plateau is an important element contributing to high-grade pivot shifts seen in some patients. 3 High-grade pivot shifts, although mostly a subjective physical examination assessment, are thought to be a relative indication for adding an associated ALL reconstruction. 5,24,26 The ALL acts as a secondary stabilizer during internal rotation torque and simulated pivot-shift test, particularly in patients with ACL deficiency. 17,20,21 In a subset of patients, after ACLR there is continued rotational stability, and 1 factor thought to be related is concomitant ALL injury. 27 However, at this time, there is no consensus on indications for performing an associated ALL reconstruction. This further supports that our equation could add objectivity to the identification of high-risk patients who require more rotational control. The mathematical model we described deserves further investigation, and evaluating concurrent ALL and ACL injury in patients is the next step in our future research. We proposed that tibial plateau geometry may help to elucidate treatment indications for ALL reconstruction, but ALL injury was not an inclusion criterion for our participants. Thus, the clinical implications applied to ALL injury are only theoretical and should not be used to determine if ALL reconstruction is indicated. Further research will be needed for this.
There were a few limitations to our current study. We can only infer that greater slopes in the posterolateral tibia are associated with greater ACL strain given that we did not directly measure forces transmitted across the knee in patients. However, a number of studies have established a relationship between larger magnitudes of posterior tibial slopes and greater ACL strain with movement of the knee. 13,15 We also recognize that our findings identified a correlation, rather than causation, between slope and risk of ACL tear. It is possible that an increased slope may be a consequence of ACL injury pathomechanics and the traumatic depression of the posterolateral tibial plateau may actually change bony geometry. This remains unclear and could be further investigated by comparing MRI scans of the injured knee and the contralateral knee. Last, our standard departmental protocol involved performing MRI of the knee in a nonweightbearing position, and this provides only an approximation of the true anatomy between the proximal tibia and distal femur during a noncontact injury. Emerging new techniques such as weightbearing MRI of the knee may more closely reflect physiologic thickness and contours of the tibial cartilage when the knee joint is loaded; however, even this is only an approximation of the conditions during ACL rupture. Additionally, weightbearing MRI scans are still limited in availability and pose challenges with image collection by necessitating that patients bear weight after injury.
Conclusion
The posterolateral cartilaginous slope of the tibial plateau was mathematically modeled in patients with ACL injury. A correlation was identified between slope and ACL injury, whereby an abnormally steep slope appeared to predispose to ACL injury, likely by increasing anterior translation forces sustained by the knee joint. Our findings are promising for adding more objectivity to surgical decision making, especially with identifying high-risk patients who may be candidates for procedures such as combined ACL-ALL reconstruction or slope-reducing osteotomy.
Footnotes
Final revision submitted September 7, 2020; accepted November 5, 2020.
One or more of the authors has declared the following potential conflict of interest or source of funding: P.A.M. receives support from the Fonds de Recherche du Québec–Santé and Consultation Semperform Inc. AOSSM checks author disclosures against the Open Payments Database (OPD). AOSSM has not conducted an independent investigation on the OPD and disclaims any liability or responsibility relating thereto.
Ethical approval for this study was obtained from McGill University Health Centre.