
Abstract
Background:
Local complications after total knee arthroplasty (TKA) significantly affect the patient’s prognosis. Nomograms can be a useful tool for predicting such complications.
Purpose:
To compare the preoperative and intraoperative factors of patients who underwent TKA with and without complications and to construct and validate a nomogram based on selective predictors of local complications within 90 days postoperatively.
Study Design:
Case-control study; Level of evidence, 3.
Methods:
The nomogram was developed in a primary cohort that consisted of 410 patients who underwent primary TKA at the authors’ institution between January 2015 and September 2018. Predictor variables included 4 major local complications that can occur within 90 days: reoperation (including implant revision or removal for any reason and manipulation under anesthesia), infection, bleeding requiring ≥4 unit transfusion of red blood cells within 72 hours of surgery, and peripheral nerve injury. The authors used least absolute shrinkage and selection operator (LASSO) regression analysis for data dimension reduction and feature selection. Multivariable logistic regression analysis was used to develop the nomogram. Performance of the nomogram was assessed using C-index, calibration plot, area under the receiver operating characteristic curve (AUC), and decision curve analysis (DCA). The model was subjected to bootstrap validation and external validation using a prospective cohort of 249 patients.
Results:
Four significantly prognostic factors were incorporated into the nomogram: age-adjusted Charlson Comorbidity Index, American Society of Anesthesiologists score, tourniquet time, and estimated intraoperative blood loss. The model displayed good discrimination, with a C-index of 0.819 and an AUC of 0.819. The calibration curves showed optimal agreement between nomogram prediction and actual observation. A high C-index value of 0.801 could still be reached in bootstrap validation. Application of the nomogram in the validation cohort showed good discrimination (C-index, 0.731) and good calibration. DCA demonstrated that the nomogram was clinically useful.
Conclusion:
The authors developed and validated a novel nomogram that can provide individual prediction of local complications within 90 days for patients after TKA. This practical tool may be conveniently used to estimate individual risk and help clinicians take measures to minimize or prevent the incidence of complications.
Total knee arthroplasty (TKA) is a procedure for the treatment of severe end-stage knee disorders. 18 It has been established as a safe, standard treatment and can dramatically restore function and improve the quality of life for patients. 18,32 The overall demand for TKAs has been steadily increasing. 24,33 With prosthesis survival now >90% at 15 years, TKA is considered a cost-effective procedure. 32 Nevertheless, local complications within 90 days after surgery, such as postoperative infection and peripheral nerve complications, can occur. 27 Such complications after TKA can dramatically prolong hospitalization, increase health care costs, and affect prognosis, even resulting in disability or death. 3,16 The control of local complications is important for evaluating surgical outcomes and health care quality.
Nomograms have been accepted as a reliable tool to quantify risk by incorporating statistical factors to predict treatment prognosis. 2,19,39 As an intuitive graph of a statistical predictive model, a nomogram gives rise to the numerical probability of a clinical event such as postoperative complication risk or overall survival. 2 The application of nomograms into postoperative patient management could assist orthopaedic surgeons in determining patients’ expected outcome risk based on results of similar patients.
Nomograms for predicting early local complications in patients after TKA are scarce at present. In a previous study, 39 we constructed a nomogram to predict the likelihood of complications within 30 days after TKA; the purpose of the current study was to build on our previous research by extending the predictive nomogram to 90 days. Further, we used a separate cohort to externally validate the model.
Methods
Patient Population and Data Processing
Research approval was obtained from the ethics committee of our institution. To recruit the patients of the primary cohort, we used our institution’s electronic medical records to retrospectively identify all TKAs performed between January 1, 2015, and September 30, 2018. A total of 464 consecutive surgeries were identified. During the study period, there was no significant change in the management of surgery and anesthesia in patients undergoing TKAs at our institution, and the brands of joint prostheses that were used were unchanged. All participants fully understood and signed the informed consent.
Exclusion criteria were as follows: age <18 years, patellectomy, revision surgery, surgery performed for oncologic indications, incomplete baseline data, missing data on the eligible variables, and bilateral surgery. To ensure consistent outcomes across patients, operations performed by surgeons who performed <30 TKA cases per year were also excluded.
Data such as patient characteristics, preoperative diagnosis, comorbid condition, laboratory results, imaging manifestations, immediate outcomes during hospitalization, and treatment characteristics of the patients were collected from medical records. The 90-day follow-up data were obtained from the outpatient records in the electronic clinical data system, with further information obtained from the medical record and telephone follow-up if needed. Data were extracted manually by 2 researchers separately (C.X., S.O.). Where these data sources conflicted, the operative report took precedence.
Table 1 shows the preoperative variables that were recorded. These variables have been confirmed to be statistically significant predictors of local complications. 3 –5,29,35,37,40 Primary diagnoses were categorized as either osteoarthritis (including dysplasia) or rheumatoid arthritis and others (including inflammatory causes such as hemophilic, infection-related joint arthroplasty and villonodular arthritis, and posttraumatic changes). Osteoporosis was diagnosed using radiographs and bone mineral density examination.
Recorded Patient Variables a

a ACCI, age-adjusted Charlson Comorbidity Index; ASA, American Society of Anesthesiologists; BMI, body mass index; BSA, body surface area; EIBL, estimated intraoperative blood loss; Hb, hemoglobin.
In addition to the 12 preoperative variables, we recorded data for 5 intraoperative variables (Table 1). We included lowest heart rate and lowest mean arterial pressure because numerous studies have confirmed that the Surgical Apgar Score accurately predicts the development of serious complications. 23,30 The intraoperative data were available in the anesthesia records, which included diastolic blood pressure, systolic blood pressure, and heart rate recorded every 5 minutes. We therefore calculated mean arterial pressure and chose the relative minimum from the mean arterial pressure and heart rate. 39 The estimated intraoperative blood loss (EIBL) was also calculated from the anesthesia records.
Outcome Assessment
As done in previous studies, 15,21,27 we defined our primary outcome, 90-day local morbidities, as any of the following: reoperation (including implant revision or removal for any reason and manipulation under anesthesia), infection (superficial or deep wound, organ space), bleeding requiring ≥4 unit transfusion of red blood cells within 72 hours of surgery, and peripheral nerve injury.
Construction of the Nomogram
In the primary cohort, standardized clinical data expressed in terms of patient attributes and variables were entered into an independent central database. We consulted an experienced biostatistician at the clinical research center at our institution and an independent researcher to manage and maintain the data. The least absolute shrinkage and selection operator (LASSO) regression analysis, which could avoid overfitting and is suitable for the reduction in high-dimensional data, 9,36 was used to select the optimal predictive features from the 17 preoperative and intraoperative risk factors. 6 To avoid missing the predictor, we performed univariable logistic regression analysis.
Based on the risk factors selected in the LASSO and univariable logistic regression, we performed multivariable logistic regression analysis to identify independent prognostic factors using a stepwise forward elimination of nonsignificant variables to derive a final variable formula. All features that were eventually identified and selected were interaction terms in the final multivariable model based on statistical significance (P < .05). Associations were summarized using odds ratios (ORs) and 95% CIs from the logistic regression models. 14 Finally, all statistically significant predictors were applied to develop a prediction model for the risk of 90-day complications. 2,32
Calibration and Validation of the Nomogram
The model performance for predicting outcomes was evaluated by calculating the Harrell concordance index (C-index), 12 a measure for assessing the accuracy of a nomogram. The value of the C-index ranges from 0.5 to 1.0; the closer to 1, the higher the accuracy to discriminate the outcome with the model. 12 We also calculated a relatively corrected C-index using a method of internal validation based on 1000 sets of full bootstrap samples and compared the C-indices between the 2 models based on previously described methods. 31 The area under the receiver operating characteristic (ROC) curve (AUC) was also calculated to predict the accuracy of the model. 11 Calibration curves were plotted to assess the calibration of the 90-day local complication nomogram. 22 To assess the clinical usefulness of the nomogram by quantifying the net benefit under different threshold probabilities in the cohort, we performed a decision curve analysis (DCA). 8,20
We examined the generalizability of the model in an external validation cohort provided by a validated database. The validated data set was collected prospectively from consecutive patients treated between October 2018 and May 2020 in our institution. During the external validation, the total points of each patient were calculated according to the established nomogram; then multiple logistic regression in this cohort was performed using the total points as a factor; and finally, the C-index, DCA, and calibration curve were calculated based on the regression analysis.
Power analysis and sample size (PASS) 12 software (NCSS) was used to determine sample size. The sample size calculation was performed using a significance level of .05 and a power of 0.80, in which the results indicated minimum sample sizes of 221 in the no-complications group and 17 in the complications group. After evaluation, the sample sizes of the primary and validation cohorts were acceptable for power analysis. Statistical analyses were performed using the R software (version 4.0.3; http://www.r-project.org/).
Results
Screening Process and Characteristics of the Primary Cohort
A total of 410 patients with TKA representing patients throughout China were included in the primary cohort (Figure 1). All the surgeries were performed by 1 of 4 orthopaedic surgeons, and there was no statistical difference in the incidence of local complications among them (Q.L., L.L.). Overall, 24 patients (5.9%) in the primary cohort experienced at least 1 local complication within 90 days. There was 1 mortality event noted over the 90-day postoperative period (1 patient died because of septic shock; the overall mortality rate was 0.24%). The clinical characteristics of the patients in the primary cohort are shown in Table 2, and the complications are listed in Appendix Table A1.

Enrollment of the study participants in the primary cohort. TKA, total knee arthroplasty.
Patient and Clinicopathologic Characteristics of the Primary and Validation Cohorts a

a Data are presented as mean ± SD or number (%) of patients. Dashes indicate data not recorded. ACCI, age-adjusted Charlson Comorbidity Index; ASA, American Society of Anesthesiologists; BMI, body mass index; BSA, body surface area; EIBL, estimated intraoperative blood loss; Hb, hemoglobin; MAP, mean arterial pressure; OA, osteoarthritis; RA, rheumatoid arthritis.
Independent Prognostic Factors in the Primary Cohort
Using the LASSO method, the 17 collected risk factors were reduced to 4 potential predictors with nonzero coefficients: tourniquet time, American Society of Anesthesiologists (ASA) class, serum albumin, and EIBL (Figure 2). The univariable logistic analysis showed that higher age-adjusted Charlson Comorbidity Index (ACCI) score (P = .001) and operation time ≥150 minutes (P < .001) were indications for early complications (Appendix Table A2). Thus, these 6 total features were incorporated into the multiple logistic regression analysis (Table 3).

Feature selection using the least absolute shrinkage and selection operator (LASSO) binary logistic regression model. (A) LASSO coefficient profiles of all signatures. Optimal parameter (lambda) selection in the LASSO model via minimum criteria. The vertical line indicates the value (log(λ) = –4.2) chosen by the 10-fold cross-validation where the optimum lambda gave rise to 4 features with nonzero coefficients. (B) LASSO coefficient profiles of the 17 risk factors. A coefficient profile plot was produced against the log(λ) sequence; the vertical line on the left indicates the value where the optimal lambda resulted in the 4 features with nonzero coefficients. ACCI, age-adjusted Charlson Comorbidity Index; ASA, American Society of Anesthesiologists; BMI, body mass index; EIBL, estimated intraoperative blood loss; Hb, hemoglobin.
Results of Multivariable Logistic Regression for Prediction of 90-Day Local Complications a
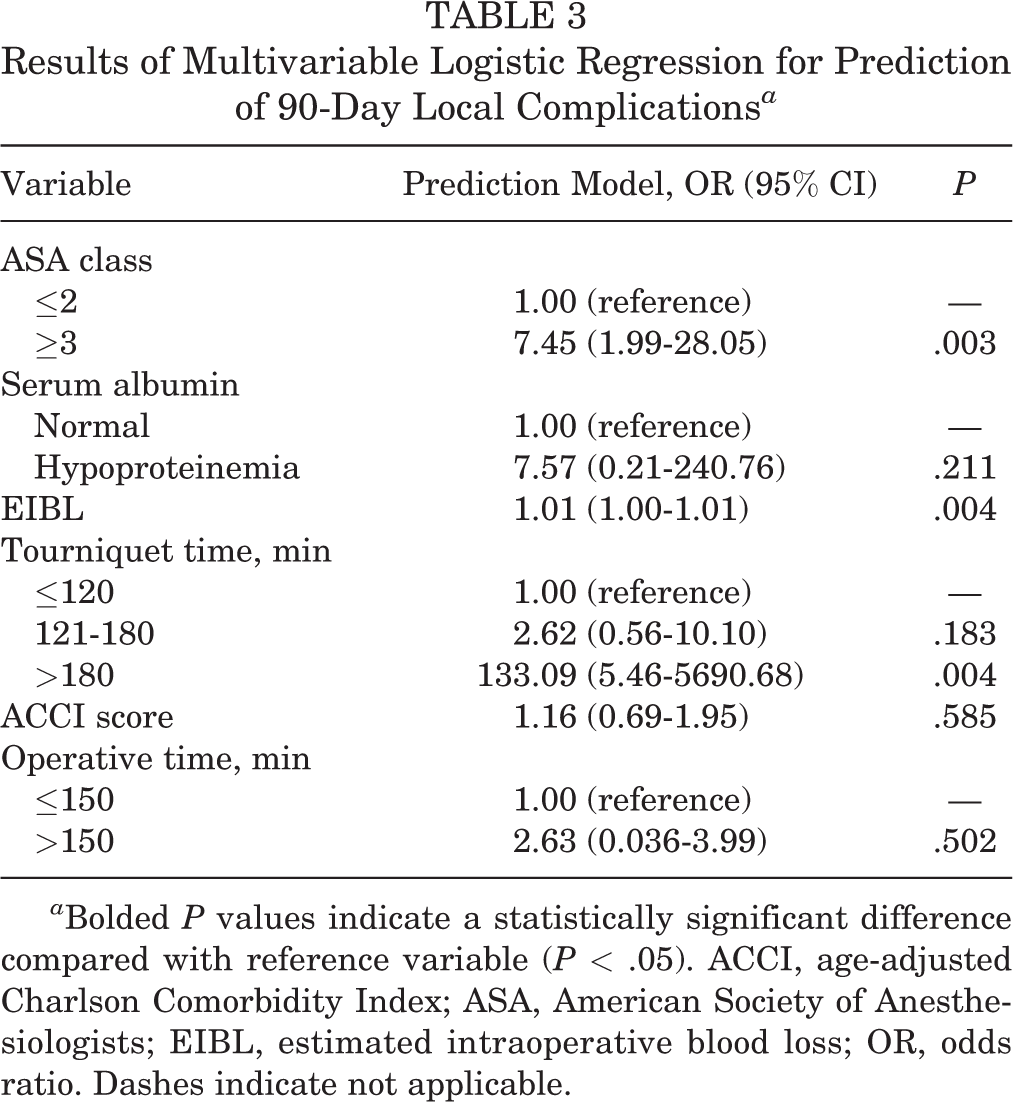
a Bolded P values indicate a statistically significant difference compared with reference variable (P < .05). ACCI, age-adjusted Charlson Comorbidity Index; ASA, American Society of Anesthesiologists; EIBL, estimated intraoperative blood loss; OR, odds ratio. Dashes indicate not applicable.
Construction of the Nomogram
The results of multivariable logistic regression model indicated that ASA class ≥3 (P = .003), increasing EIBL (P = .004), and tourniquet time ≥180 minutes (P = .004) were all statistically associated with complications within 90 days. Since a previous study 4 suggested that ACCI was significantly correlated with postoperative local complications, we decided to test the performance of the nomogram with and without adding ACCI to the model. Thus, the following preoperative and intraoperative predictors were incorporated into the nomogram: ACCI score, tourniquet time, ASA class, and EIBL.
The nomogram illustrated EIBL and tourniquet time shared the largest contribution, followed by the ASA class and ACCI score. In the nomogram, each subtype of these variables was assigned scores to the point scale. Figure 3A shows the constructed nomogram, and a sample application of the nomogram is illustrated in Figure 3B.

(A) Nomogram for predicting 90-day local complications after total knee arthroplasty based on preoperative and interoperative variables. The patient’s age-adjusted Charlson Comorbidity Index (ACCI) score, American Society of Anesthesiologists (ASA) class, tourniquet time, and estimated intraoperative blood loss (EIBL) are located on the respective axis, then a straight line is drawn from each location upward to the “points” axis, and the sum of points for each variable is calculated. This number is then located on the “total points” axis, and a straight line is drawn down to the “risk of complications” axis. (B) In this example, the patient’s ASA class was 3 (40 points) and ACCI score was 3 (12 points). During the operation, the EIBL was about 150 mL (18 points), and the tourniquet time was <120 minutes (0 points). This patient had a total point value of 70, which corresponds to an 11.8% risk of local complications within 90 days.
External Validation of the Nomogram
The external validation cohort consisted of 249 patients who underwent TKA between October 1, 2018, and May 30, 2020. The 90-day mortality rate was zero, and 22 patients (8.8%) had at least 1 local complication. Patient characteristics and data regarding chosen predictors are shown in Table 2, and complications are detailed in Appendix Table A1.
In the primary cohort, the C-index for the nomogram was 0.819 (95% CI, 0.726-0.912), and the C-index by bootstrap validation (1000 bootstrap samples) was 0.801. In the external validation cohort, the C-index was still as high as 0.731 (95% CI, 0.587-0.875). The AUC of the primary cohort was 0.819, and in the validation cohort, the AUC was as high as 0.731, as displayed in Figure 4. Further, the calibration curves illustrated excellent agreement in the primary cohort and acceptable agreement in the validation cohort between the nomogram and actual observation (Figure 5).

Receiver operating characteristic (ROC) curve for the prediction nomogram for the (A) primary and (B) validation cohorts. An area under the ROC curve (AUC) of 0.5 represents a test with no discriminating ability (ie, no better than chance), while an AUC of 1.0 represents a test with perfect discrimination.

Calibration plots for the prediction nomogram with internal validation using the bootstrapping technique with 1000 repetitions for the (A) primary and (B) validation cohorts. The x-axis represents the predicted probability of complications, and the y-axis represents the actual diagnosed complications as a proportion of overall cases. The diagonal dashed line represents a perfect prediction by an ideal model. The solid line represents the performance of the nomogram; a closer fit to the diagonal dashed line represents a better prediction. The estimated concordance index of the primary cohort was 0.819 (95% CI, 0.726-0.912), and it was identified using bootstrap validation (1000 bootstrap samples) as 0.801.
Clinical Usefulness of the Nomogram
To explore the implications of using the nomogram in clinical practice, decision analyses were conducted along with a graphical decision curve. The results are shown in Figure 6. DCAs show the performance of a risk model in a population in which every patient has the same expected benefit and cost of intervention. The results of the DCA suggested that the nomogram in both the primary and validation cohorts was clinically useful within a probability threshold ranging from 2% to 100%.

Decision curve analysis for the prediction nomogram for the (A) primary and (B) validation cohorts. The y-axis measures the net benefit. The blue line represents the prediction nomogram, the thin gray line represents the assumption that complications occurred in all patients after surgery, and the thick gray line represents the assumption that no complications occurred in any patient after surgery. The decision curve for both the primary and the validation sets showed that if the probability threshold was in the 2% to 100% range, then using this nonadherence nomogram in the current study to predict complication risk added more benefit than either the treat-all-patients scheme or the treat-none scheme.
Discussion
Our research found that ASA class, ACCI score, EIBL, and tourniquet time were associated with early local complications in patients with TKA. Despite several previously reported prognostic models, 1,7,38 including our previous study, 39 a nomogram has not been developed for 90-day local complications in patients with TKA. Thus, we sought to develop a nomogram to predict the risk of complications for these patients.
Although the primary cohort was obtained from a single institutional registry, the wide geographic distribution of patients and relatively large sample size guaranteed its representativeness and generalizability for Chinese patients with TKA. Based on the LASSO model, univariable logistic analysis, and subsequent multivariable logistic analysis, we identified tourniquet time, ASA class, and EIBL as independent prognostic factors. These methods not only are superior to the method of choosing predictors based on the strength of their univariable association with outcome but also enable the panel of selected features to be combined into a predictive signature of complications. 13 Further, these findings were in high concordance with previous reports on risk factors for early local complications after TKA. 3,16
The ACCI has been used to predict the risk of complications in previous studies, 10,25,34 which have demonstrated an association between ACCI score and adverse clinical outcomes after arthroplasty. After adding ACCI score to the model, we found that the C-index improved greatly, from 0.796 to 0.819. One of the possible reasons is that age and a few comorbid conditions have been identified as crucial risk factors for complications. 28 Thus, we decided to keep ACCI score as one of the predictive factors in the final nomogram. Although it has been confirmed that age is a significant prognostic factor, we cautiously decided not to include this signature in the final nomogram because the C-index improved by only 0.02 after adding it to the current model. Furthermore, we evaluated an altered model by putting type of anesthesia and hemoglobin concentration count into the nomogram as categorical variables, which were found to be statistically significant in our previous study, 39 but we found that discrimination was slightly impaired (C-index, 0.791).
When the prediction result and the follow-up time are different, the predictive factors selected by the model are also different. In the nomogram by Wuerz et al, 38 the probability of major complications after TKA was lower when patient characteristics included lower heart rate, EIBL, blood urea nitrogen, and ASA class; fewer comorbidities; primary procedure; non-White race; and no fracture. The nomogram of Babazade et al 1 showed that patients were less likely to need sciatic nerve block after TKA with the predictor variables of older age, longer operation time, higher body mass index, White race, use of chronic pain medications, previous knee surgery, no depression, peripheral vascular disease, no intraspinal anesthesia, and joint infiltration. In the study by Dowsey et al, 7 a better probability of clinical response was seen when patients had lower body mass index, lower Short Form–12 mental component score, lower Kellgren-Lawrence grade, and higher preoperative Western Ontario and McMaster Universities Osteoarthritis Index score.
Validation of the nomogram is essential to avoid overfitting of the model and to determine generalizability. 17 In the current study, calibration plots showed optimal agreement between prediction and actual observation, which guaranteed the repeatability and reliability of the established nomogram. Compared with similar studies using TKA, our study revealed discrimination via the significantly higher C-index (current study, 0.819 vs Wuerz et al, 38 0.68 vs Babazade et al, 1 0.64). In the validation cohort, the C-index was 0.731, indicating an excellent level of predictive discriminative ability. However, the risk prediction’s discrimination and calibration could not capture the clinical consequences of a particular level of discrimination or degree of miscalibration. 2,26 Therefore, to justify the clinical usefulness, we applied DCA in this research. The decision curve in both the primary cohort and validation set showed that if the threshold probability was in the range of 2% to 100%, then using the nomogram added more benefit than either the treat-all-patients scheme or the treat-none scheme.
To the best of our knowledge, our study was the first to use a nomogram to predict the probability of postoperative local complications within 90 days of TKA and to validate it externally. However, several limitations of the current study should be noted. First, a relatively small number of patients treated at a single tertiary clinical center in China were included in this study. Nonetheless, as the same preoperative and intraoperative risk factors are shared by all races, our nomogram is usable in all populations. Second, although we recruited study candidates based on strict preset diagnostic, recruiting, and excluding criteria, we retrospectively selected the primary cohort, and the resulting intrinsic biases must be acknowledged.
A third limitation was that patients underwent TKA by multiple surgeons in this study, and the criteria of performing TKA varied among the surgeons; thus, the influence of selection bias might be underestimated. Nevertheless, statistical analysis confirmed that there was no significant difference in the incidence of complications among the surgeons in both the primary and validation cohorts. Fourth, the external verification of this study belongs to temporal validation. By comparison, geographical validation, validating the performance of the model in data from other centers and even other countries, may have better ability to verify the transferability and generalizability of the model. In addition, we did not take into account the influence of patellar replacements and uncemented knee arthroplasties on the prognosis. Further efforts on wider geographic recruitment in other clinical settings and incorporation of some other factors are being taken to perfect this model.
Conclusion
In the current study, we established a novel nomogram for predicting the risk of local complications within 90 days after TKA. It showed good performance and clinical usefulness in both the primary cohort and the external validation cohort. We hope that this user-friendly tool can be beneficial to orthopaedic surgeons and their patients.
Footnotes
Acknowledgment
The authors acknowledge the support of Dr. Peihua Cao, the biostatistician at the clinical research center at Zhujiang Hospital of Southern Medical University. Statistical analyses in this study were guided and approved by Dr. Cao. Author Chao Xie thanks, in particular, Huiwen Lu for the invaluable support over the years.
Final revision submitted September 10, 2021; accepted November 8, 2021.
The authors declared that they have no conflicts of interest in the authorship and publication of this contribution. AOSSM checks author disclosures against the Open Payments Database (OPD). AOSSM has not conducted an independent investigation on the OPD and disclaims any liability or responsibility relating thereto.
Ethical approval for this study was obtained from Zhujiang Hospital of Southern Medical University (approval No. GJGBWK-001).