
Abstract
Background:
Baseball and softball are popular sports in the United States and are responsible for a large number of youth sports injuries each year.
Purpose:
To investigate recent differences in youth baseball and softball injuries evaluated in nationwide emergency departments.
Study Design:
Descriptive epidemiology study.
Methods:
The National Electronic Injury Surveillance System (NEISS) database was examined for softball and baseball injuries in pediatric patients (age, 7-21 years) from 2010 through 2019. Patients were classified as children (age, 7-13 years), adolescents (age, 14-18 years), or young adults (age, 19-21 years). Case narratives were used to categorize injuries as contact injuries (hit by bat or ball), field injuries (sliding into base, collision with another player, catching, or running), throwing injuries, or other.
Results:
An unweighted total of 24,717 baseball injuries and 13,162 softball injuries were recorded. A nationwide estimate of 861,456 baseball injuries and 511,117 softball injuries were sustained during the studied time period, with estimated respective injury rates of 86,146 and 51,112 per year. Injured softball players were most commonly adolescent (47%) and female (92%), while injured baseball players were most commonly children (54%) and male (90%). There was a greater proportion of baseball-related injuries involving the head/neck (41%) as compared with softball-related injuries (30%) (P < .01). Conversely, a greater proportion of softball-related injuries involved the lower extremity (32%) as compared with baseball-related injuries (19%) (P < .01). When comparing diagnosis, softball injuries were more often sprains/strains (28%) than baseball injuries (18%) (P < .01). When comparing mechanisms of injury, baseball athletes were more likely to be evaluated with contact injuries than were softball athletes (49% vs 40%, P < .01).
Conclusion:
Youth baseball athletes were more likely to be injured through contact mechanisms and had a higher proportion of injuries related to the head/neck/face, whereas softball injuries more frequently involved the lower extremity and resulted in a sprain/strain. League guidelines should focus on reducing contact injuries within youth baseball, and injury-prevention programs should focus on reducing lower extremity injuries in youth softball.
Baseball and softball are a large source of youth sports injuries every year, with studies estimating an injury rate of 0.61 to 1.47 per 1000 athlete-exposures (AEs) and 0.61 to 1.42 per 1000 AEs for youth participating in baseball and softball, respectively. 7 Youth athletes are particularly susceptible to injury because of the vulnerability of growing cartilage, differences in body proportions, and ongoing development of musculoskeletal strength and coordination. 1,39 Moreover, the annual cost of pediatric baseball and softball injuries in the United States is estimated to be between $1 billion and $4 billion when accounting for psychosocial impact, presenting a significant burden on health care expenditures. 6 More than 120,000 baseball and softball injuries are seen in hospital emergency departments (EDs) annually within the United States. 4,20 It is important to assess, characterize, and compare the types of youth baseball and softball injuries evaluated in the ED to reduce avoidable health care expenses and prevent injuries with long-lasting effects on pediatric athletes.
Youth baseball and softball injuries can be broadly categorized as acute or overuse injuries. Overuse injuries are due to repetitive muscle use and can result in tendonitis, strains, and sprains. 19,33,41 Overuse injuries are most often caused by noncontact mechanisms of injury. For example, repetitive throwing without rest can result in proximal humeral epiphysiolysis, otherwise known as Little League shoulder. 11 In contrast, acute injuries are due to a sudden force or change in direction of motion and can result in concussions, fractures, and dislocations. 10,30,35 Contact mechanisms of injury, such as being hit by a bat or ball, are most likely to result in an acute injury. 13,22,23,40
Although baseball and softball share several similarities, there are important differences that lead to distinct rates and types of injury. For example, the underarm technique of softball pitching places more load on the shoulder than the elbow, 14 resulting in a higher rate of pitching-related shoulder injuries in youth softball and a higher rate of pitching-related elbow injuries among youth baseball. 29,41 As a result, baseball-specific and softball-specific pitch count limits and regulations were established across Little League Baseball and Softball. 31
However, the impact of other differences between baseball and softball, such as athlete characteristics and playing techniques, is not as well understood. Softball players are mostly female and may be at risk for different injuries than baseball players are, who are mostly male. For example, previous studies have shown that female youth athletes are at greater risk for severe injuries that often require surgery. 5,37 Other important differences include field size, frequency of Little League games, and ball design, which may all contribute to specific patterns of injury for softball and baseball. It is important to characterize these injury differences in order to establish more sport-specific safety guidelines and guide the development of sport-specific injury prevention programs.
Here, we compare the presentation of recent youth baseball and softball injuries evaluated in the ED and examine differences in site of injury, diagnoses, and mechanisms of injury. We hypothesized that baseball players would have more contact and upper extremity injuries, whereas softball players would have more noncontact and lower extremity injuries. These possible differences could lead to the implementation of more protective equipment or lower extremity injury-prevention programs within these sports.
Methods
The National Electronic Injury Surveillance System (NEISS) is a publicly available database managed by the US Consumer Product Safety Commission (CPSC) that contains data related to sports, recreational activities, and consumer products. 12 It pulls from 100 randomly selected EDs that represent a stratified probability sample of all US hospitals with a 24-hour ED and at least 6 beds. Each entry contains date of admission, disposition from the ED, patient age, race, ethnicity, sex, diagnosis, injured body part(s), activity involved, location where injury occurred, and a brief case narrative describing the circumstances of the injury.
The NEISS database was examined for all softball (activity code 5034) and baseball (activity code 5041) injuries involving patients aged 7 to 21 years from 2010 through 2019. This age range was chosen because many children begin engaging with softball and baseball at 7 years of age, which has been used as the lower age limit in other studies. 4 The upper limit was 21 years because it represents the final year of college for athletes who choose to compete at the collegiate level. Inclusion criteria included injuries received during competition, practice, or other practice-related activities, resulting in 40,256 unweighted cases. Exclusion criteria were cases that had unrelated diagnoses, unrelated injured body parts, and injuries that occurred at locations unrelated to practice or competition (n = 2337) (Appendix Table A1).
Patients were classified by age as children (age, 7-13 years), adolescents (age, 14-18 years), and young adults (age, 19-21 years). Cases were classified into 4 mechanisms of injury using the case narrative: (1) contact injuries: those received by being hit by the bat or ball; (2) field injuries: those received while sliding into base, from player-on-player collision, during catching, or during running; (3) throwing injuries: those received while throwing or pitching the ball; and (4) unknown/other. These categories were chosen because they represent distinct aspects of play that may differ between softball and baseball. An algorithm developed by one of the authors (A.L.) was used to search the case narrative of each injury to determine the mechanism of injury. The algorithm was compared with the manual classification of 1000 cases to verify accuracy. Details of the injury-mechanism analysis based on case narrative are found in Appendix Table A2. Injured body part was classified as head/neck/face, trunk, lower extremity, or upper extremity. In cases in which there was more than 1 injured body part, only the injured body part most relevant to the injury, as defined by the CPSC coding manual, was included for analysis. Diagnoses were grouped as fractures/dislocations, concussions, superficial injuries (contusion, laceration, puncture), internal injuries, sprains/strains, and other. Severe cases were defined as cases that required hospitalization, transfer, admission to the hospital for observation, or death. 16
Injury proportions were compared between baseball and softball with respect to the mechanism of injury, affected body part, diagnosis, and severity. Subsequently, injuries that occurred because of contact, field, or throwing were specifically compared with respect to affected body part, diagnosis, and severity. Data were analyzed using Stata Version 16 (StataCorp). Statistical weights provided by the CPSC were used to calculate national injury estimates. Results for all analyses were reported as overall national estimates, estimated percentages, and estimated 95% confidence intervals (CIs). Statistical comparisons included uncorrected Pearson χ2 tests with 95% CIs. The significance for all analyses was set at P <.05.
Results
Population Characteristics
A nationwide estimate of 1,372,573 injuries were sustained during the time period, with 861,456 injuries resulting from baseball and 511,117 injuries resulting from softball, with respective injury rates of 86,146 and 51,112 injuries per year (P < .01) (Table 1). The combined population had a mean age of 13.6 years (95% CI, 13.5-13.8 years), was 59.7% (95% CI, 57.4%-61.9%) male, and was 81.5% (95% CI, 74.7%-86.7%) White. A majority of baseball cases were children (53.7%; 95% CI, 51.5-56.0), as opposed to softball cases, which were most often adolescent (47.5%; 95% CI, 45.6-49.4) (P < .01). A vast majority of baseball cases were male (90.1%; 95% CI, 88.8-91.3), whereas softball cases were mostly female (91.5%; 95% CI, 89.9-92.9) (P < .01). There was no significant difference when evaluating race, and White patients made up the majority of baseball cases (80.2%; 95% CI, 72.8-85.9) and softball cases (83.6%; 95% CI, 77.3-88.4).
Sport-Specific Characteristics of Pediatric Athlete Injuries Evaluated in the ED, as Surveyed by NEISS a
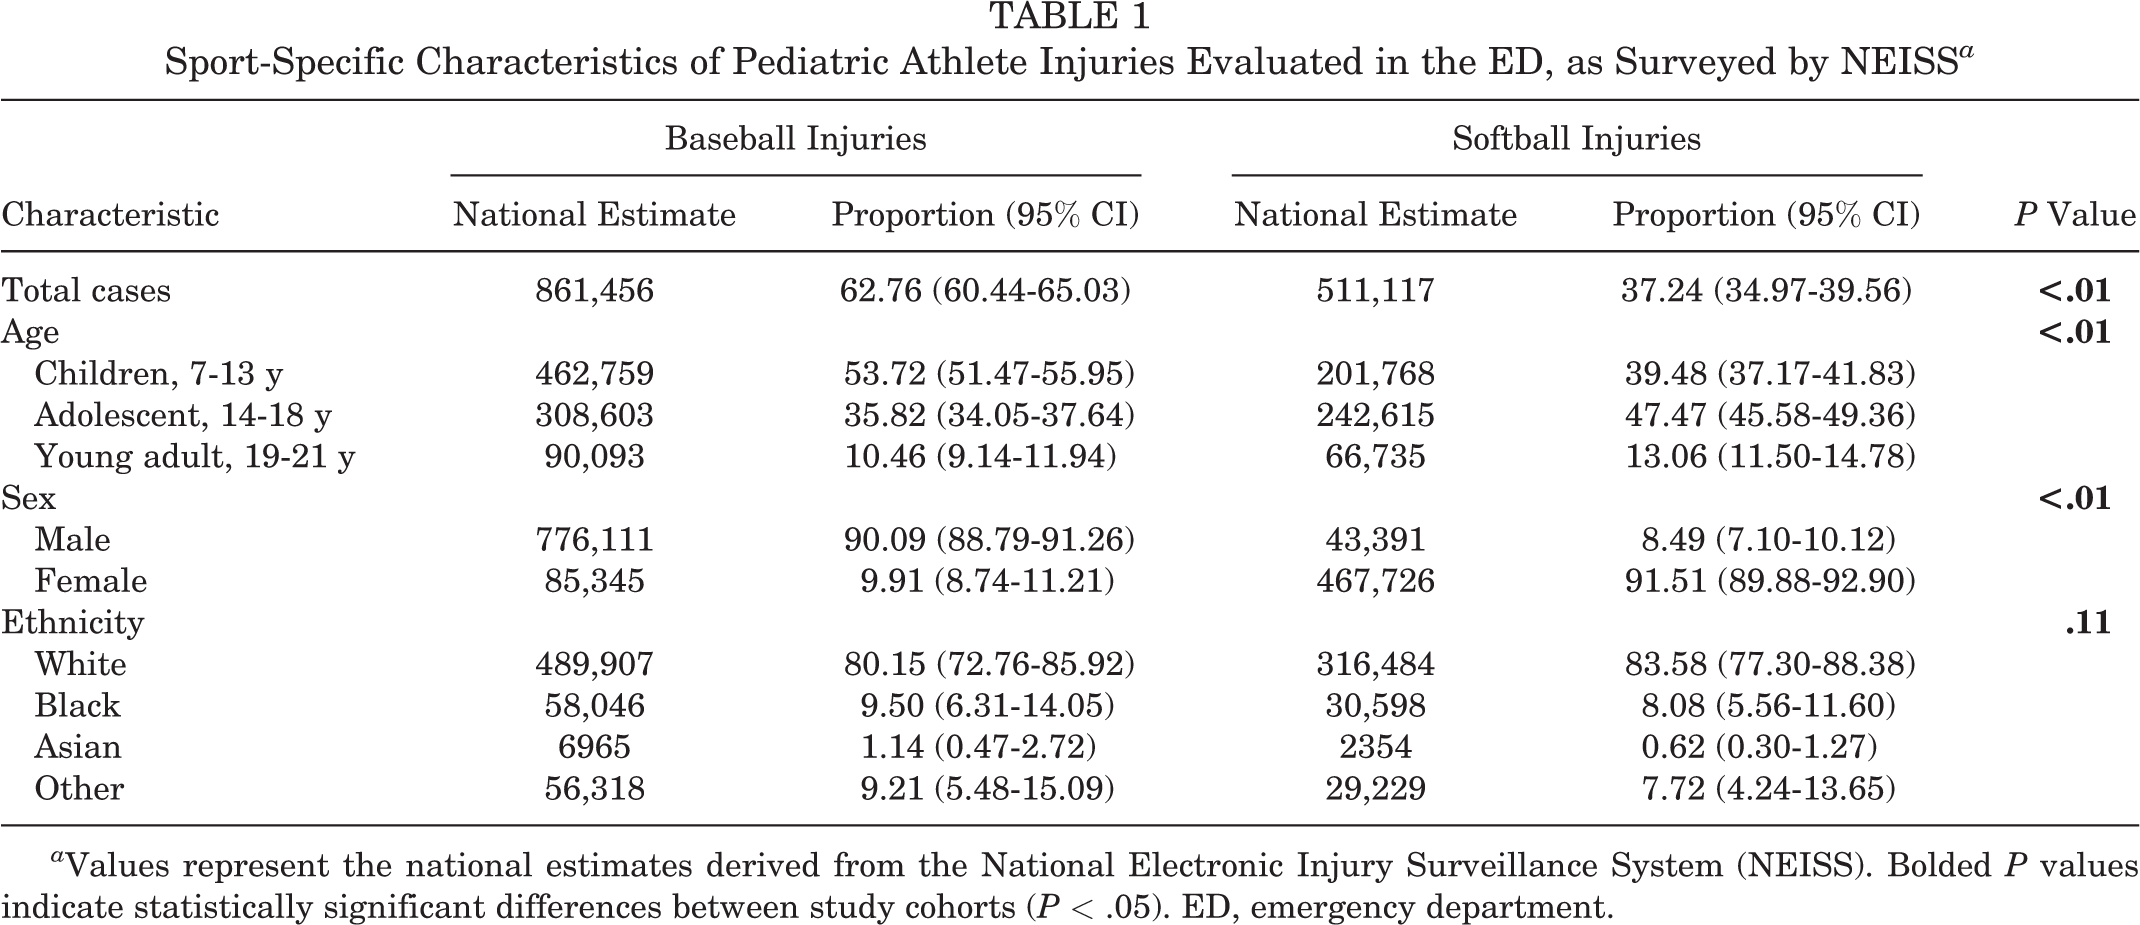
a Values represent the national estimates derived from the National Electronic Injury Surveillance System (NEISS). Bolded P values indicate statistically significant differences between study cohorts (P < .05). ED, emergency department.
Overall Injuries
Table 2 details the injury characteristics by sport. When evaluating injury mechanisms, most baseball (49.2%) and softball (39.7%) cases were caused by contact. Other baseball cases included 25.3% field injuries, 3.0% throwing injuries, and 22.5% other injuries. In comparison, softball cases were 27.0% field injuries, 2.0% throwing injuries, and 31.3% other injuries (P < .01).
Characterization of Sport-Specific Injuries Evaluated in the ED, as Surveyed by NEISS a

a Values represent the national estimates derived from National Electronic Injury Surveillance System (NEISS) cases. ED, emergency department.
b Rows with important differences between baseball and softball.
The distribution of the affected body region also differed significantly between baseball and softball (P < .01). The head/neck/face was the most commonly injured body part among baseball cases, representing 40.8% of injuries. In comparison, the upper extremity was the most commonly injured body part for softball cases, representing 32.6% of injuries. Baseball cases also had a much lower proportion of lower extremity injuries (19.2%) as compared with softball injuries (31.7%).
There was a significant difference with respect to diagnoses between baseball and softball injuries (P < .01). Superficial injury was most common among both baseball (33.7%) and softball (29.3%), and there was a similar prevalence of fracture/dislocation (21.5% and 16.3%), concussion (4.1% and 4.9%), and internal injury (8.9% and 6.7%) among both sports. However, sprain/strain was more prevalent among softball (28.5%) than baseball (18.2%). Baseball had more severe injuries (2.11%) than softball (1.26%) (P < .01), and similarly, baseball had more cases that were treated and admitted (1.97%) than softball (1.17%) (P < .01).
Contact Injuries
Comparisons of contact injuries according to sport are shown in Figures 1A and 2A. Contact injuries evaluated in the ED were most likely to affect the head/neck/face region in both baseball cases (66%) and softball cases (57%). However, contact injuries were more likely to affect the lower extremity in softball cases (11%) as compared with baseball cases (5.3%) (P < .01). Contact injuries were similarly likely to affect the trunk (5% and 3%) and upper extremity (23% and 28%) in baseball and softball cases. When considering diagnosis, contact injuries were most likely to result in superficial injury among both sports (49% and 48%). Contact injuries also resulted in similar proportions of internal injury (14% and 12%) and fracture/dislocation (17% and 15%). However, softball contact injuries were slightly more likely to result in sprain/strain (5% vs 3%) and concussion (8% vs 6%) as compared with baseball injuries (P < .01). Baseball contact injuries were more often severe (2.1%) than contact injuries in softball (0.9%) (P < .01), and patients evaluated with baseball contact injuries were more likely to be treated and admitted (2.0%) than those evaluated with softball contact injuries (0.8%) (P < .01).
Field Injuries
Comparisons of field injuries by sport are shown in Figures 1B and 2B. Field injuries were most likely to affect the upper extremity in baseball cases (39%) but were most likely to affect the lower extremity in softball cases (46%) (P < .01). However, field injuries affected the head/neck/face (21% and 19%) and trunk (7% and 5%) similarly in baseball and softball. Additionally, the most common diagnosis for field injuries was fracture/dislocation among baseball cases (31%) and sprain/strain among softball cases (36%) (P < .01). Otherwise, field injuries were similarly likely to result in concussion (4% and 5%), superficial injury (22% and 19%), internal injury (6% and 6%), and other injuries (12% and 12%) in baseball and softball cases. There was no significant difference in injury disposition (P = .19) or severity (P = .16) between field injuries in either sport, with 3.1% and 2.5% of injuries found to be severe and 2.8% and 2.4% of injuries being treated and admitted among baseball and softball cases, respectively.
Throwing Injuries
Comparisons of throwing injuries by sport are shown in Figures 1C and 2C. Throwing injuries among baseball and softball cases were most likely to affect the upper extremity (82% and 76%), but softball cases had a higher proportion of lower extremity injuries (12%) as compared with baseball (4%) (P = .007). Otherwise, throwing injuries were similarly likely to affect the head/neck/face (3% and 3%) and trunk (10% and 9%) in both sports. There was no significant difference in injury diagnosis (P = .12), and most throwing injuries resulted in sprain/strain (51% and 52%), fracture/dislocation (13% and 7%), or other diagnoses (33% and 36%). Baseball throwing injuries were more likely to be severe (0.9%) than softball throwing injuries (0.2%) (P = .014), but were not more likely to be treated and admitted (P = .35).

Comparison of diagnosis and injured body part between baseball and softball. (A) When comparing contact injuries, there was a significant difference in diagnosis (P < .01) and injured body part (P < .01). (B) There was also a difference among field injury diagnosis (P < .01) and injured body part (P < .01). (C) When comparing throwing injuries, there was a difference among injured body part (P < .01) but not diagnosis (P = .12).

Comparison of disposition and severity between baseball and softball. (A) When comparing contact injuries, there was a significant difference in disposition (P < .01) and severity (P < .01). (B) There was no difference among field injury disposition (P = .19) or severity (P = .16). (C) When comparing throwing injuries, there was a difference among severity (P = .014) but not disposition (P = .35).
Discussion
Here, we investigated whether there were differences between youth baseball and softball injuries with respect to mechanism of injury, affected body part, or diagnosis. Baseball injuries were more severe and more likely to affect the head/neck/face region, whereas softball injuries were more likely to affect the lower extremity. Baseball injuries had a greater proportion of fractures/dislocations as compared with softball injuries, which had a greater proportion of sprains/strains. Contact injuries were most common among both sports, but baseball had a higher proportion of contact injuries and an increased severity of contact injuries. Moreover, field injuries more commonly resulted in fractures/dislocations and affected the upper extremity in baseball cases, but more often, they resulted in sprains/strains and affected the lower extremity in softball cases. Throwing injuries were also more likely to affect the lower extremity in softball cases as compared with baseball cases.
Previous studies have also shown that the majority of youth baseball injuries evaluated in the ED most commonly affect the head/neck/face and most often result in soft tissue injuries. 20,38 Moreover, these studies found that being hit by the ball was the most common mechanism of injury for baseball cases. 20,38 Similar studies of softball players have found a more even distribution of injuries in the lower extremity, upper extremity, and head/neck/face region among pediatric cases. 4 Birchak et al 4 also found that pediatric softball players were more likely to be evaluated after being hit by a ball as compared with adult cases. Our results are largely consistent with these previous findings and demonstrate that youth baseball and softball players have differences in injury presentation, such as a higher proportion of head/neck/face injuries among baseball players and a higher proportion of lower extremity injuries among softball players.
The increased incidence of head/neck/face injuries and superficial injury diagnoses among baseball cases is likely reflective of the fact that baseball players were more likely to be injured because of contact mechanisms than were softball players. The results of this study show that the head/neck/face is the most common site of contact injuries and that superficial injuries, such as contusions and lacerations, are the most common diagnoses. This observation is also consistent with other studies that have reported higher rates of oral and maxillofacial injuries due to contact sports. 28
The prevalence and severity of baseball and softball injuries evaluated in the ED, underscored by annual pediatric baseball injury rates of more than 100,000 in previous decades, call for increased safety measures and protective equipment. 20 This is especially important with regard to youth baseball players, who were found to have more severe contact injuries in this study. Previous safety efforts to reduce impact injuries within baseball have shown mixed results. The use of softer-core baseballs and chest protectors composed of various materials has shown inconsistent results in reducing impact injury to the chest. 18,26 However, Marshall et al 21 demonstrated that the use of face guards and a safety ball called the reduced-impact ball reduced the risk of ball-related injury and facial injury. Fewer studies have assessed the efficacy of softer balls and face guards within softball, but some studies have shown that fielder’s masks could reduce the impact of being struck by the ball and reduce the risk of facial fracture. 24,36 Although baseball had a higher rate of contact injuries, the majority of softball injuries within softball were also due to contact. Further research into protective equipment, such as reduced-impact balls and face guards and face shields, is needed for youth softball injury prevention.
The increased prevalence of injuries affecting the lower extremity, including throwing injuries and field injuries, among softball players can be due to a variety of reasons. One of the most significant reasons is the dramatic sex gap that exists between the sports, as reflected by youth baseball cases being 90% male and youth softball cases being 92% female in this study. Female athletes are at increased risk for lower extremity injuries, such as anterior cruciate ligament and meniscal injuries, for a variety of proposed reasons, including increased joint laxity, decreased neuromuscular control, and other anatomic differences. 2,3,25,32 The increased prevalence of throwing injuries affecting the lower extremity is likely due to differences in throwing mechanics, which can affect the kinetic chain. For example, softball players demonstrate increased glenohumeral range of motion and bilateral symmetry as compared with baseball players. 34 Moreover, softball players rely more on hip complex stability, as shown by a concomitant decrease in hip range of motion and strength when experiencing upper extremity pain. 15,27 Studies have shown that injury-prevention programs can improve core stability among athletes and reduce the risk of ankle sprains and lower extremity injury among female athletes by improving neuromuscular control through a variety of strength, balance, plyometric, and core exercise training. 8,17 As such, there should be greater implementation of injury-prevention programs within youth softball to improve throwing mechanics and lower extremity neuromuscular control. There should also be a greater emphasis on teaching better techniques for base sliding, which can be a source of lower extremity field injuries. 9
Limitations
This study acquired data using the NEISS database, which utilizes a representative sample of 100 US EDs to estimate nationwide injury patterns and injury rates. As a result, data from the NEISS database are subject to sampling bias, and some types of injury may have been disproportionately over- or underrepresented. Moreover, the NEISS database only records a brief case narrative for each injury, and mechanisms of injury could not always be determined based on the lack of granular information in the case narratives. The NEISS database contains anonymous patient data and consequently does not report if patients have been evaluated multiple times, potentially leading to another source of error.
Additionally, not all softball and baseball injuries are evaluated in the ED. Many players may bring their injuries to urgent care centers or their athletic trainer, primary care physician, and orthopaedic surgeon without visiting the ED. In this way, visits to the ED are not completely representative of all injuries affecting baseball and softball players.
Conclusion
Differences in player characteristics and athletic technique predispose youth baseball and softball players to different patterns of injury. Youth baseball players are more likely to have injuries affecting the head/neck/face region, whereas youth softball players are at greater risk for sprains/strains and lower extremity injuries. Youth baseball players are more likely to have severe injuries, although the majority of all baseball and softball injuries are nonsevere. Injury-prevention programs to improve lower extremity neuromuscular control should be used more widely among youth softball players, and league guidelines should be improved to reduce the rate of contact injuries among both sports. Further studies should evaluate youth baseball and softball injury trends and the pattern of injury in other clinical contexts, such as sports medicine and urgent care visits.
Footnotes
Final revision submitted July 3, 2021; accepted August 6, 2021.
One or more of the authors has declared the following potential conflict of interest or source of funding: K.J.M. has received education payments from Smith & Nephew. AOSSM checks author disclosures against the Open Payments Database (OPD). AOSSM has not conducted an independent investigation on the OPD and disclaims any liability or responsibility relating thereto.
Ethical approval was not sought for the present study.
APPENDIX
Algorithm for Determining Injury Mechanism From Case Narratives

| Mechanism: Contact Injury (n = 17,193 cases) |
| 1 AND 2 AND 3 AND 4 |
| 1. Contains “hit” or “struck” or “blow” or “ricochet” |
| 2. Does not contain “fell” or “slid” or “trip” or “slip” or “throwing” or “colli” or “ran into” or “catch” or “caught” |
| 3. Does not contain “dove” or “diving” followed by “ball” |
| 4. Does not contain “dove” followed by “base” |
| Mechanism: Throwing Injury (n = 1048 cases) |
| 1 AND 2 |
| 1. Contains “pitch” or throwing” |
| 2. Does not contain “pitching machine” or “hit” or “struck” or “at bat” or “colli” or “slid” |
| Mechanism: Field Injury (n = 9944 cases) |
| [1 OR 2 OR (3 AND 4 AND 5) OR (6 AND 7 AND 8 AND 9) OR 10] AND 11 |
| 1. Contains “slid” |
| 2. Contains “dove” then “base” |
| 3. Contains “colli” |
| 4. Contains “ran into” |
| 5. Contains “player” or “catcher” or “someone” |
| 6. Contains “catch” or “caught” |
| 7. Contains “dove” then “ball” |
| 8. Contains “diving” then “ball” |
| 9. Does not contain “batting cage” |
| 10. Contains “slip” or “ran into” or “fell” or “trip” or “running” |
| 11. Not included in “unintended contact” or “throwing” mechanisms |
| Mechanism: Unknown/Other |
| 1. Not included in the “contact injuries,” “throwing injuries,” or “outfield injuries” mechanisms |