
Abstract
Background:
There are limited data on the performance or pitching metrics of Major League Baseball (MLB) pitchers who returned to play after ulnar collateral ligament reconstruction (UCLR).
Purpose:
To describe MLB pitcher performance after return from primary UCLR, compare the velocity and pitch characteristics against the preoperative season, and determine if performance analytics can predict successful return to pitching after UCLR.
Study Design:
Case-control study; Level of evidence, 3.
Methods:
This study included 63 pitchers who underwent primary UCLR between 2015 and 2019. Publicly available advanced analytics and pitch metrics from the first 2 postoperative seasons were compared with the preoperative (index) season as well as with an uninjured control group.
Results:
Overall, 57% of the pitchers successfully returned to the MLB level. Although they threw significantly fewer pitches (P = .012) and innings (P = .022) in postoperative year 1 as compared with the index season, there were no significant differences in pitch velocity, release extension, perceived velocity, or performance as measured by advanced analytics. Also, as compared with the index season, returners demonstrated increased postoperative spin rates on curveballs (P = .001) and sliders (P = .010), and curveball horizontal movement was significantly increased (P = .007); however, horizontal movement was significantly decreased for 4-seam fastballs (P = .026), changeups (P = .005), and sinkers (P = .019). The vertical movement on 4-seam fastballs was greater (P < .001) in postoperative year 1, and the vertical movement on curveballs (P = .031) and sinkers (P = .010) was greater in postoperative year 2 when compared with the index season. Pitchers who failed to return to the MLB level had a lower preoperative strikeout percentage (P = .047), fewer strikeouts per 9 innings pitched (P = .046), fewer wins above replacement ([WAR]; P = .026), and lower player value (P = .030) than the pitchers who returned.
Conclusion:
Pitchers returning to the MLB level after UCLR demonstrated changes in pitch movement profiles and spin rates postoperatively, but there were no differences in velocity or many advanced analytics upon return. Pitchers with lower strikeout metrics, fewer WAR, and less player value before surgery may have an elevated risk of failing to return to the MLB level.
Keywords
The anterior bundle of the medial ulnar collateral ligament (UCL) is the primary stabilizer to valgus stress across the elbow, and this ligament plays a critical role in the performance of the overhead athlete. 25,32 Although UCL rupture was previously considered a career-ending injury in the elite pitcher, surgical management with UCL reconstruction (UCLR) has allowed Major League Baseball (MLB) pitchers to return to sport (RTS), with rates commonly reported between 80% and 90%. 9,13,21,26,28 Recent studies 5,7 have noted an increasing rate of UCLR performed in MLB pitchers annually, and up to 25% of MLB pitchers have a history of the surgery.
Although RTS rates have been well described, return to prior performance (RTPP) has been less thoroughly studied. In the initial study by Conway and Jobe, 8 an excellent outcome required the athlete to return to the same level of competition for >12 months. Subsequent articles 13,26 have attempted to use traditional statistics to quantify the effectiveness of a pitcher returning from injury: hits (H), walks (BB), strikeouts (K), hit by pitches (HBP), home runs (HR), batting average against (BAA), innings pitched (IP), earned run average (ERA), and walks and hits per inning pitched (WHIP). Previous systematic reviews 9,36 have indicated that performance, when measured by traditional statistics, may worsen postoperatively. However, traditional statistics are influenced by team and situational factors and may not provide the best measure of an individual player's performance. 31
The introduction and subsequent proliferation of data analytics have changed the game of baseball in the 21st century. 24 Proprietary analyses within organizations can influence player contracts and team roster construction while searching for competitive advantages. 10,24 As a result, newer statistical analyses have been developed to measure the individual performance of a player (Table 1). Fielding independent pitching (FIP) and expected fielding independent pitching (xFIP) are measures that quantify a pitcher’s independent ability to prevent runs, by utilizing formulas that remove the role of the surrounding defense (K, BB, HBP, and HR). Skill-interactive ERA (SIERA) adds complexity by factoring in a pitcher’s ability to influence certain types of contact from the batter. Wins above replacement (WAR) quantifies the contribution of an individual’s performance to the team relative to a replacement-level player. 14 Recent studies 11,12,28 have begun to include advanced analytics while reporting the outcomes of UCLR.
Advanced Analytics Available for Evaluating Pitcher Performance 14 a

a BAA, batting average against; BB, walks; FIP, fielding independent pitching; GB, ground balls; H, hits; HBP, hit by pitches; HR, home runs; IP, innings pitched; K, strikeouts; SIERA, Skill-interactive ERA; WAR, wins above replacement; xFIP, expected fielding independent pitching.
As technology continues to advance, more granular assessments of performance are becoming possible. In 2015, MLB introduced StatCast, a spatiotemporal data-tracking system that uses a standardized camera system and radar technology to optically track player and ball movement to measure and quantify game events. 22 This system allows for the measurement of various pitch delivery metrics to describe ball flight, including release extension, pitch velocity, perceived velocity, ball spin rate, and horizontal and vertical pitch movement (Table 2). These metrics are being increasingly analyzed as the concept of “pitch design” has become popularized within the game of baseball and in the lay media. 3,27 Although studies have previously assessed biomechanics and pitch velocity after UCLR, few studies 15,19,26,28,29,38 have assessed these metrics for successful pitching.
Pitch Delivery Metrics Measured by StatCast System 1

The purpose of this study was to describe the analytical performance of MLB pitchers after returning from primary UCLR, compare the velocity and pitch metrics against the preoperative season, and determine if advanced analytics or pitch metrics can predict a successful return to pitching. We hypothesized that pitchers returning to the MLB level would demonstrate (1) no difference in performance, as measured by the advanced analytics K/9, BB/9, HR/9, K%, BB%, FIP, xFIP, SIERA, WAR, and Value; (2) no difference in pitch metrics, as measured by velocity, movement, spin rate, extension, or perceived velocity; and (3) no difference in preoperative advanced analytics when compared with MLB pitchers who were unable to return to the MLB level.
Methods
Study Cohort
A retrospective case-control study was performed of MLB pitchers who underwent UCLR between January 1, 2015, and December 31, 2019. This date range was selected to capture the seasons in which StatCast data were available. MLB pitchers who underwent UCLR were identified through a publicly available database utilizing public media reports and press releases. 40 Similar to the Portney et al study, 38 pitchers were included who threw 100 pitches in the year leading up to surgery (index year), and those who returned to MLB with at least 100 pitches thrown in a subsequent season were included in the RTPP analysis. Pitchers who underwent revision surgery were excluded. Outcome year 1 (OY1) was the first season upon returning to the MLB level with ≥100 pitches thrown, and outcome year 2 (OY2) was the second season upon returning to the MLB level with ≥100 pitches thrown. Demographic information was collected, such as height, weight, body mass index, handedness, and position (starter vs reliever). Pitchers were classified as starting pitchers for the analysis if they were designated as the starter in ≥50% of the season’s appearances. Pitchers who started in <50% of the season’s appearances were considered relief pitchers.
Control Group
A 1:1 control group was constructed using a methodology similar to that in Portney et al. 38 A random-number generator was used to determine an index year between 2015 and 2019. The generator then selected a number between 1 and 30, corresponding to the 30 MLB teams. Using the historical rosters documented on www.baseball-reference.com, a final random number was generated to select a control pitcher from the list of players who made at least 1 pitching appearance during the selected season. Control pitchers were then cross-referenced from the publicly available database to ensure that they had not previously undergone UCLR. Similar to the case cohort, control pitchers who threw 100 pitches in the index year were then included in the RTPP analysis.
Performance Analytics
Performance data were collected from the statistical website www.fangraphs.com. Season-ending advanced analytics (K/9, BB/9, HR/9, GB%, FIP, xFIP, WAR, SIERA, and Value) were collected for the 2015-2019 seasons for case and control players. Total pitches thrown, IP, K%, and BB% were recorded from the StatCast dashboard (http://baseballsavant.mlb.com). FIP, xFIP, and SIERA are reported on a scale similar to the traditional ERA statistic, while WAR is measured in wins. Value is the amount of money that a player’s production would be worth on the free agent market, measured in millions of US dollars. 14
Pitch Metrics
Using the StatCast dashboard, yearly pitch metrics were recorded for all pitchers. Percentage of total pitches, velocity, spin rate, vertical movement, and horizontal movement were collected for the following pitches: 4-seam fastball (4SFB), curveball (CB), slider (Sld), cut fastball (Cut), changeup (Ch), sinker (Snk), and split-finger fastball (Split). 1 Extension (Ext; the distance from the pitching rubber to the release point), and perceived velocity (the apparent speed of the pitch that the batter experiences as a product of pitch velocity and Ext), were obtained on fastballs (4SFB, Cut, Snk) from StatCast.
Statistical Analysis
Samples were assessed for normality using the Shapiro-Wilk test. For parametric variables, paired and independent t tests were utilized to assess for within- and between-group differences, respectively. For nonparametric samples, the Mann-Whitney U test and the Wilcoxon signed-rank test were used. A 1-way analysis of variance was performed for comparisons of characteristic data across the returning players, nonreturners, and control group, and a chi-square test was performed for categorical characteristic data. All analyses were performed on SPSS Statistics for Windows Version 24 (IBM Corp). A P value <.05 was established as the criterion for reaching statistical significance.
Results
Player Characteristics
Overall, 100 players who underwent UCLR were identified during the study period. Twelve were excluded for throwing <100 pitches in an index year when StatCast data were available. Another 12 were excluded for having a history of UCLR. Thirteen players had undergone UCL after June 2018, were not expected to return to pitching during the study period, and were excluded from the RTS and RTPP analyses. Therefore, 63 players were identified for analysis. A flow diagram of the study cohort is presented in Figure 1.

Flow diagram of the study cohort (left) and control cohort (right). MLB, Major League Baseball; UCLR, ulnar collateral ligament reconstruction.
For the control group, 100 players without a history of UCLR were identified. Two players were excluded because they were traditionally position players but had made unusual pitching appearances for their team. Another player was excluded since he pitched ambidextrously and his pitch movement recordings were thus atypical. This created a control group of 97 players for statistical analysis. Player characteristics are presented in Table 3. There was a significant difference in IP among the 3 cohorts (P = .011). In follow-up analysis, there was no difference in IP between the control group and the returners (P = .104), nor was there a difference between returners and nonreturners (P = .270). However, the nonreturners threw fewer innings compared with the control group (P = .003).
Player Characteristics a

a Data are reported as mean ± SD (range) unless otherwise indicated. Bold P value indicates statistically significant difference among groups (P < .05). LHP, left-handed pitcher; RHP, right-handed pitcher; RP, relief pitcher; SP, starting pitcher; UCLR, ulnar collateral ligament reconstruction.
Return to Play
At a mean of 521 days, 36 MLB pitchers (57.1%) returned to the MLB after undergoing UCLR, while 27 (42.9%) failed to return. Four players had returned to the MLB level but failed to record 100 pitches in any 1 year thereafter and were therefore classified as nonreturners in the RTPP analysis (Figure 1). Fourteen starting pitchers (74%) returned as starters, while 5 (26%) returned as relief pitchers. The 17 relief pitchers in the study all (100%) returned to the MLB level as relief pitchers. The 36 returners averaged 2 active seasons at the MLB level postoperatively (range, 1-4 seasons), and 31 returning pitchers (86%) were still pitching in MLB at the conclusion of the study period.
Pitchers returning from UCLR threw significantly fewer pitches (mean ± SD, 607.8 ± 693.7 vs 882.1 ± 754.2; P = .012) and IP (34.7 ± 41.8 vs 52.3 ± 44.4; P = .022) in OY1 versus the index season, but these changes were not significantly different from the yearly change in the control group for pitches (–274.4 ± 620.2 vs –151.4 ± 666.2; P = .115) and IP (–17.6 ± 40.9 vs –10.1 ± 40.3; P = .186). In OY2, the number of pitches thrown (1328.9 ± 862.0 vs 803.3 ± 684.0; P = .018) and IP (77.9 ± 52.5 vs 47.9 ± 40.1; P = .025) were significantly greater than in the index year, and this increase was significantly different from that in the control group (pitches, 525.6 ± 836.1 vs –354.7 ± 773.5 [P = .003]; IP, 29.9 ± 52.1 vs –23.1 ± 47.7 [P = .005]).
Performance Analytics
There were no significant differences in advanced analytics for the returners in either OY1 or OY2 versus the index year (Table 4). When compared with the year-to-year changes in the control group, there was no significant difference on any performance metric.
Advanced Analytics of UCLR Returners vs Controls a

a Data are reported as mean ± SD. BAA, batting average against; BB, walks; FIP, fielding independent pitching; H, hits; HBP, hit by pitches; HR, home runs; IP, innings pitched; K, strikeouts; OY, outcome year; SIERA, skill-interactive ERA; UCLR, ulnar collateral ligament reconstruction; WAR, wins above replacement; xFIP, expected fielding independent pitching.
b Compared with index year.
c Compared with corresponding Δ value of control group.
d Pitchers who transitioned from starting pitcher to relief pitcher were removed from analysis owing to differences in calculation by position.
Pitch Metrics
Velocity, Extension, and Perceived Velocity
The mean preoperative 4SFB velocity of the returners was 93.0 ± 3.2 mph, and there was no significant difference in 4SFB velocity between the index season and OY1 or OY2, or between the returners and controls. There was no significant difference in the mean velocity for any pitch type during the study period (Table 5). There was no significant difference in extension or perceived velocity during the study period.
Pitch Selection
Postoperatively, pitchers returning to the MLB level did not demonstrate a significant change in any pitch utilization. While neither an increase in curveball utilization (P = .057) nor a decrease in slider utilization (P = .058) was statistically significant when compared with the index season, these changes were significantly different from the yearly decrease in curveball utilization (P = .034) and increase in slider utilization (P = .012) seen in the control group. There was no significant change in fastball utilization throughout the study period (Table 6).
Pitch Velocity, Extension, and Perceived Velocity of UCLR Returners vs Controls a
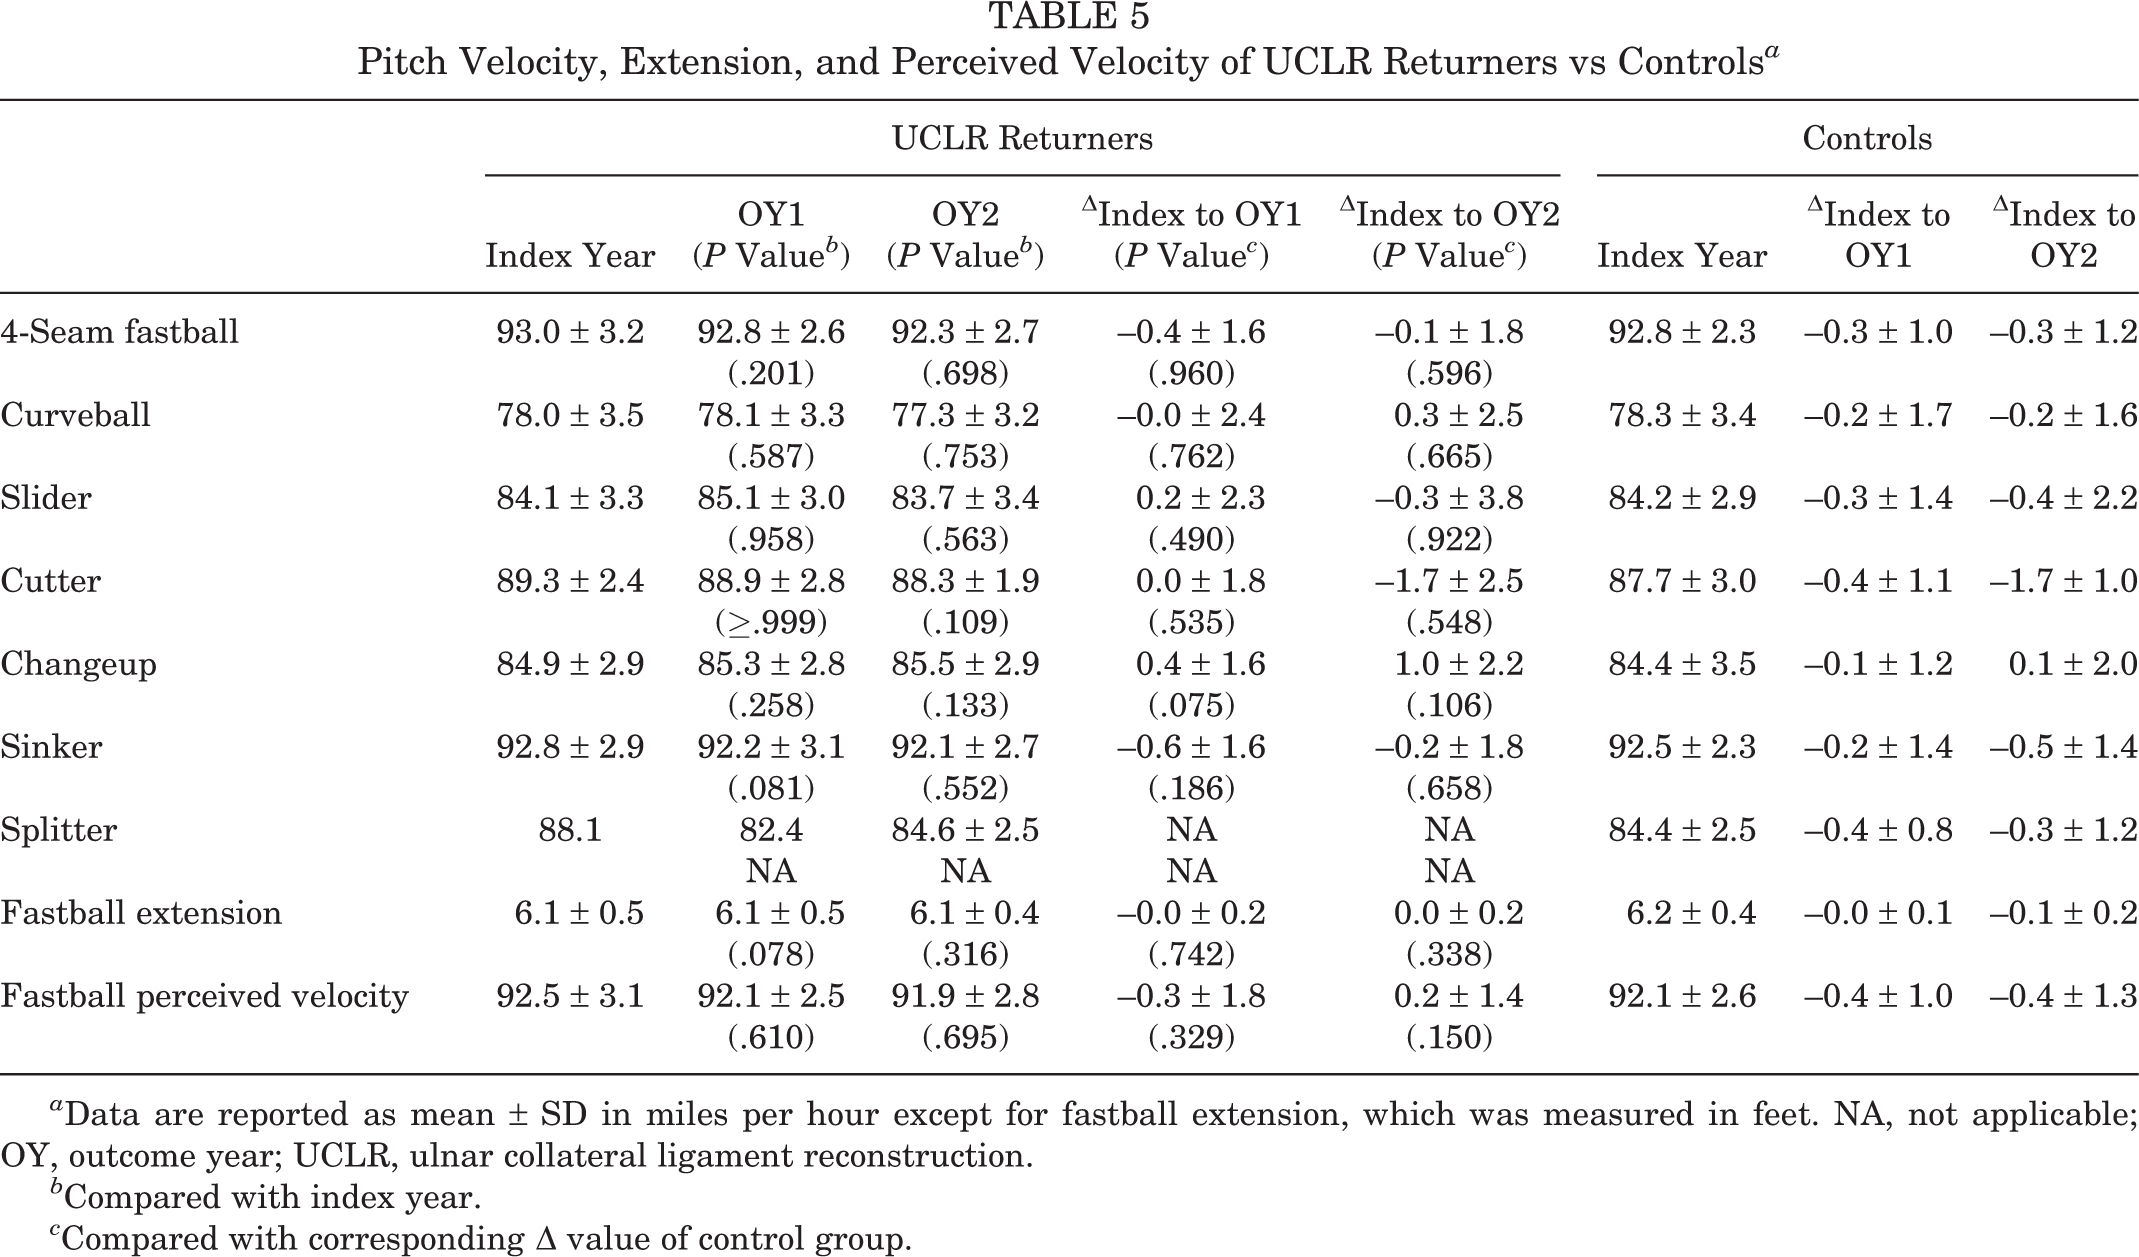
a Data are reported as mean ± SD in miles per hour except for fastball extension, which was measured in feet. NA, not applicable; OY, outcome year; UCLR, ulnar collateral ligament reconstruction.
b Compared with index year.
c Compared with corresponding Δ value of control group.
Pitch Selection of UCLR Returners vs Controls a

a Data are reported as percentage of total pitches thrown for the specified season (mean ± SD). Bold P values indicate statistically significant difference among groups (P < .05). NA, not applicable; OY, outcome year; UCLR, ulnar collateral ligament reconstruction.
b Compared with index year.
c Compared with corresponding Δ value of control group.
Spin Rate and Pitch Movement
The mean preoperative 4SFB spin rate was 2256 rpm, and there was no significant difference in fastball spin rate (4SFB, Cut, Snk) postoperatively (Table 7). The mean curveball and slider spin rates were significantly higher in OY1 (P = .001 and P = .010) and OY2 (P = .041 and P = .003) compared with the index season. The 115.9-rpm increase in curveball spin rate from the index season to OY1 was significantly higher than the yearly increase in the uninjured control group (P = .023).
Pitch Spin Rates of UCLR Returners vs Controls a
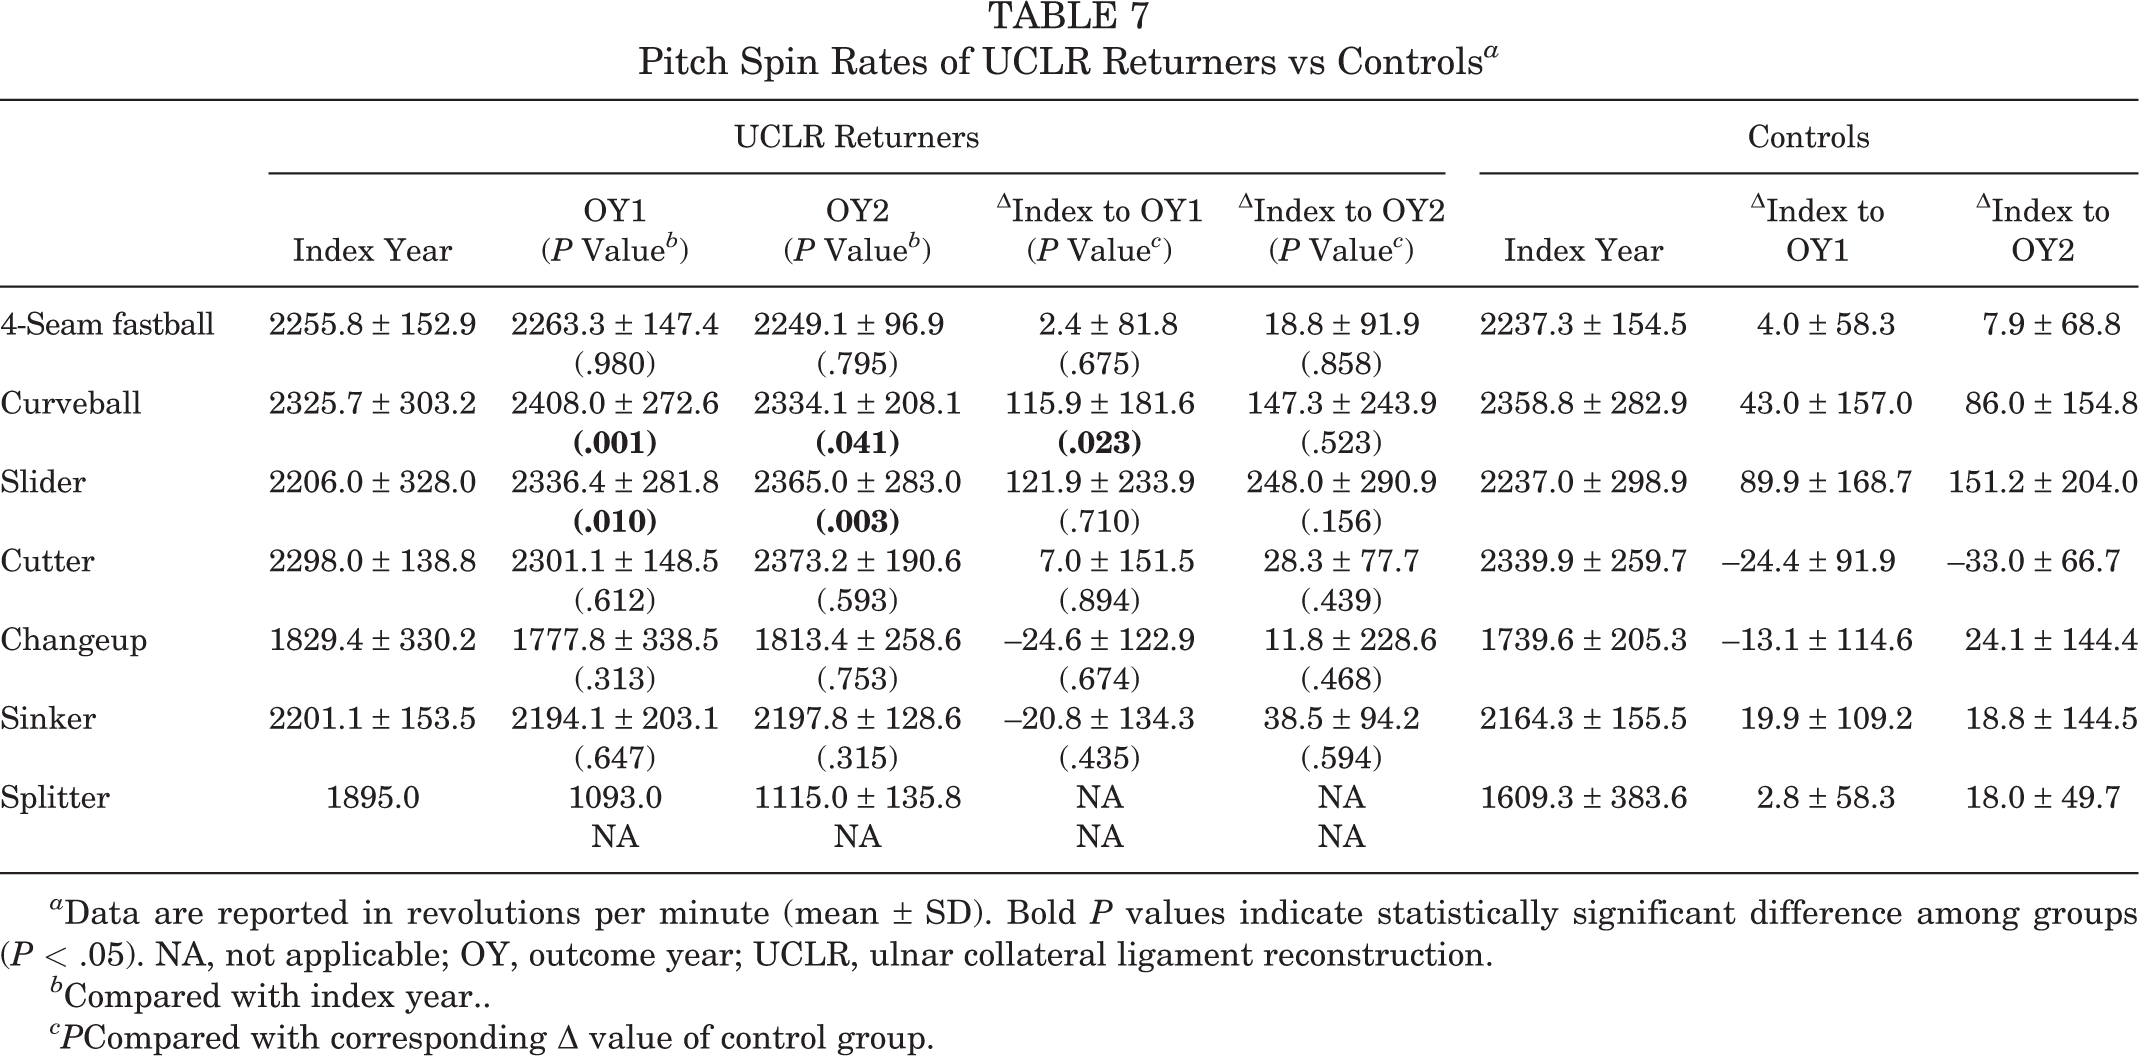
a Data are reported in revolutions per minute (mean ± SD). Bold P values indicate statistically significant difference among groups (P < .05). NA, not applicable; OY, outcome year; UCLR, ulnar collateral ligament reconstruction.
b Compared with index year..
cPCompared with corresponding Δ value of control group.
Horizontal movement was significantly lower in OY1 for 4SFB (P = .026), Ch (P = .005), and Snk (P = .019) when compared with the index season, and CB horizontal movement was significantly greater (P = .007) (Table 8). Only changeup horizontal movement returned to the index measurements in OY2 (P = .052). The changes in horizontal movement profiles of Ch and Snk were statistically different from the yearly changes in the uninjured control group (P = .024 and P = .026). Vertical movement was significantly greater in OY1 for 4SFB (P < .001) than in the index season, and vertical movement of CB (P = .031) and Snk (P = .010) was greater in OY2 versus the index season. The change in vertical movement of 4SFB from the index season to OY1 was greater than the yearly increase in the uninjured control group (P = .005).
Horizontal and Vertical Pitch Movement of UCLR Returners vs Controls a

a Data are reported in inches (mean ± SD). Bold P values indicate statistically significant difference among groups (P < .05). NA, not applicable; OY, outcome year; UCLR, ulnar collateral ligament reconstruction.
b Compared with index year.
c Compared with corresponding Δ value of control group.
Returners Versus Nonreturners
MLB pitchers who failed to successfully return to MLB competition did not differ from the returners or the control group in age, height, weight, or body mass index (Table 3). The nonreturners had a lower preoperative K% (P = .047), K/9 (P = .046), WAR (P = .026), and Value (P = .030) when compared with the pitchers who returned (Table 9).
Comparison of Index Year Performance Data Between Returners and Nonreturners a

a Data are reported as mean ± SD. Bold P values indicate statistically significant differences between groups (P < .05). BB, walks; FIP, fielding independent pitching; GB, ground ball; HR, home runs; K, strikeouts; SIERA, skill-interactive ERA; UCLR, ulnar collateral ligament reconstruction; WAR, wins above replacement; xFIP, expected fielding independent pitching.
Discussion
Outcomes reporting has evolved in the orthopaedic literature as clinicians continue to develop new ways of measuring the subjective and objective outcomes of injury and subsequent surgical interventions. 6 In sports medicine, traditionally reported RTS rates have now been supplemented by RTPP rates as clinicians try to answer the postoperative expectations of the athletic population. The UCLR literature has traditionally evaluated outcomes using the Conway criteria (same level of competition for 12 months), 8 but recent studies 8,9,11 –13,21,26,28,29 have shifted emphasis to not only citing the competitive level of return (MLB vs minor leagues) but also assessing the quality of sport performance upon recovery from injury.
Defining successful performance in surgery and sport remains elusive. In the literature, patient-reported outcome measures have begun to supplement and sometimes replace historical objective measures to better align outcomes assessment with the concerns and expectations of patients. 43 However, the quest for a gold standard in outcomes assessment remains. Similarly, there is no best measure for assessing sport performance. To further complicate this pursuit, sport performance tends to naturally change with age and time. The development of advanced analytics and game measurement systems has allowed for improved understanding and quantification of athletic performance. As a result, these metrics have become increasingly discussed in the popular media and have become an emphasis for skill training in elite pitchers. 3,27 The purpose of this study was to advance our assessment of UCLR outcomes to meet the evolving understanding of performance within the sport of baseball.
Rate of Return
In this study, 57% of MLB pitchers who underwent primary UCLR returned to MLB competition during the 2015-2019 seasons. This finding is lower than most previously reported rates. Osbahr et al 34 described 24 MLB pitchers from 1994 to 2011 and found a 79% return to the MLB level according to the Conway scale. Camp et al 5 reviewed MLB pitchers undergoing UCLR between 1974 and 2016 and found an 80% return to the MLB level, but they used a lower threshold—appearance in a single MLB game—to qualify for successful return. Marshall et al 28 noted an 82% return to the MLB level, but the definition of return was unclear. The lower RTS in this study may be explained by the inclusion criterion requiring at least 100 pitches thrown in return at the MLB level with a relatively short follow-up window, or this may indicate a contemporary change in pitching career longevity as the game of baseball evolves. However, there are no current studies on pitching career length at the MLB level to support this. Additionally, the lower RTS in this study is similar to a 2019 study by Erickson et al 12 reporting that of professional pitchers who underwent UCLR between 2010 and 2015, between 61% and 68% (depending on graft utilization) returned at the same level, although those authors did not solely examine MLB-level players and did not define the criteria for return. The results of the Erickson et al study, as well as our findings, may lend additional evidence that the rates of RTS at the MLB level after UCLR may be lower in recent years than what had been historically reported.
RTPP After UCLR: Hypotheses 1 and 2
In the current study, the 36 pitchers who successfully returned to MLB competition demonstrated changes in pitch movement profiles and spin rates postoperatively, but there was no significant difference in pitch velocity or individual advanced analytics. In the first year back to MLB competition, pitchers threw fewer innings and total pitches.
Advanced analytics have allowed media, fans, and baseball executives to better assess individual player performance, and these measures have slowly made way into the academic literature. 10 –12,24,28 We found no major changes in individual advanced analytics from the preoperative season to the first season after returning to MLB. Pitchers who returned to MLB competition maintained their performance levels from the preoperative season. Previous studies found WAR to decrease postoperatively, but these studies excluded statistics from 1 year before the surgery. 12,23 Therefore, these studies may not be comparable. However, a trend of decreased performance in OY1 that subsequently improves in OY2 has been demonstrated in studies using traditional statistics. 29 Although there is currently limited comparability of these advanced analytics in the literature, we agree with previous calls for granular, individualized measurements of sport performance and recommend that future studies continue to report these assessments in the elite athlete population. 16,39
We found no difference in velocity for any pitch postoperatively in the pitchers who returned to the MLB level, and pitch velocity was maintained in the second postoperative season. There have been conflicting reports 23,26 about the effect of UCLR on postoperative velocity. Multiple studies have described a decrease in velocity, but more recent literature 28,29 has demonstrated maintained velocity, which is consistent with this study. These contemporary findings may indicate organizational selection of pitchers with maintained velocity to return to the MLB level, as there is an increased emphasis on velocity in the modern game. 42 Changes in pitching extension alter the perceived velocity to the hitter by either shortening or lengthening the ball flight distance. Portney et al 38 noted a biomechanical change—medialization of the horizontal release point—in MLB pitchers after undergoing UCLR. We considered that this medialization may indicate a relative loss of extension and possible decrease in perceived velocity, but this was not supported by our study findings. This feature of pitching has never been evaluated in the orthopaedic literature.
MLB pitchers returning from UCLR in this study threw the same percentage of fastballs in the first postoperative year, but they demonstrated a relative increase in curveball utilization and decreased slider utilization when compared with the control group. This finding suggests that the pitchers recovering from UCLR did not mirror the league-wide trend of increased slider utilization. Since the objective pitch metrics of velocity, spin rate, and movement were either improved or unchanged during this period, other factors may be responsible for this change in slider utilization, such as individual philosophy, game situation, and team strategy. The trend in curveball utilization is consistent with the findings of Peterson et al, 37 but studies 23,38 have noted conflicting results on fastball utilization postoperatively. This may indicate changing preferences for fastball utilization in the MLB over recent seasons. However, comparison of rates among studies is limited because of the increased granularity of pitch classification (4SFB, Cut, Snk, Split) provided by the StatCast system.
The results of this study demonstrated multiple changes to pitch movement and spin rate metrics postoperatively. MLB pitchers successfully returning to prior level had decreased horizontal movement of 4-seam fastballs, changeups, and sinkers, with increased horizontal movement on curveballs. Vertical movement of 4-seam fastballs, curveballs, and sinkers also increased postoperatively. Decreased horizontal movement in 4-seam fastballs was additionally shown in a study by Portney et al, 38 but the remainder of the findings may diverge owing to differences in pitch-tracking systems among the studies. There is a paucity of data on pitch movement after UCLR for further comparison. However, we found that although pitchers may maintain statistical performance upon return to the MLB level, the characteristics of their pitches are different postoperatively.
The changes in pitch movement seen in this study are not fully explained by changes in spin rate. An increased spin rate has been shown to decrease a hitter’s ability to make optimal ball-bat contact, and it has garnered increasing interest in today’s game. 18,41 However, pitch movement depends on velocity, spin rate, spin axis, and effective spin. 17,33 Spin axis is influenced by hand position at pitch release, and these data are not in the current StatCast dashboard. 20 We believe that pitchers recovering from UCLR may have developed subtle mechanical changes at ball release that influence spin axis and spin efficiency, and these changes may be responsible for the changes in pitch movement after returning from surgery. This is the first study in the orthopaedic literature to report on pitch spin rates after UCLR, and future studies should consider utilizing additional technology to obtain further information on changes in spin axis and hand position when evaluating postoperative pitching mechanics.
Comparison of Preoperative Analytics Between Successful Returners and Nonreturners: Hypothesis 3
We found that the 27 MLB pitchers who did not successfully return to MLB competition had significantly lower preoperative K%, K/9, WAR, and Value as compared with the players who subsequently returned to the MLB level. This may indicate that pitchers who are less valuable to MLB teams preoperatively are at elevated risk of failure to return to the prior level. It may also provide evidence of an elevated value of the strikeout in the modern game, since the nonreturners had lower strikeout analytics preoperatively when compared with the successful returners. 2 Although we did not collect salary data on the players, the returners had higher strikeout productivity and more valuable performance preoperatively, and they may have experienced a greater investment from their organizations in ensuring a return to the MLB level. To our knowledge, this is the first study to report the MLB performance statistics of a cohort who did not successfully RTPP level.
Limitations
This study is not without limitations. Although similar to recent literature, 12 a smaller window of data (2015-2019) was utilized than in prior studies. 23,28,37,38 It is possible that a longer follow-up will change the rates of RTS or prior performance. However, this date range was selected to maximize the collection of StatCast data from its inception in 2015, and the delayed start to the 2020 season may affect the analysis of future studies. Regardless, it is possible that this study was underpowered to find differences in many advanced analytics.
Additionally, surgical information and outcomes were obtained through publicly available resources, as we did not have access to operative reports or medical records. Given the reliance on public data, players may have been erroneously included or excluded from our series. This also limits the ability for more granular analysis of injury and surgical details, as a previous study 28 has shown differences in pre- and postoperative performance based on tear location. In addition, we were unable to review medical records for onset of UCL symptoms. Therefore, it was not possible to determine how chronic symptoms may have affected preoperative performance or the subsequent ability to return to the MLB level. However, many pitchers experience elbow symptoms over the course of a season, and the impact of shoulder and elbow symptoms on performance, especially at the MLB level, is not well understood at this time. 4,30 It is additionally possible that minor league statistics may elucidate the performance trends of pitchers attempting to return from UCLR. However, we chose to exclude minor league performance statistics, as StatCast data are not available for this population. Furthermore, this MLB patient population was competing at the highest level of the sport before injury, and a return to minor league competition would have been below the prior level of performance. Since the nonreturner cohort did not return to the MLB level, we were unable to assess how these players' pitch movement profile and spin rate changed postoperatively. Therefore, it remains unclear if these factors affected the athletes’ ability to return to their prior levels of performance.
Finally, there is no “best measure” to assess performance upon return from pitching injury. By utilizing new pitching concepts, we sought in this study to evolve the sports medicine literature to keep pace with the evolution of performance assessment within the game of baseball. Although pitch velocity, extension, perceived velocity, and spin rate have been shown to have an acceptable coefficient of variability, future studies should continue to assess and validate new statistical measures of performance. 35
Conclusion
MLB pitchers who undergo UCLR may return to the professional level at lower rates than historically reported and may demonstrate changes in pitch movement profiles and spin rates postoperatively. In the pitchers who successfully returned to MLB competition, there were no differences in velocity or many advanced analytical statistics upon returning from surgery. However, they threw fewer pitches and innings in the returning season. Pitchers who failed to return to the MLB level had lower WAR and Value as well as decreased preoperative strikeout metrics compared with players who returned. Spin rate is an important factor in assessing pitching effectiveness that should be further studied in the pitching literature. Future studies should utilize new technologies that elucidate the granular details of sport science, as well as advanced analytical statistics, to fully assess return to performance in elite athletes.
Footnotes
Final revision submitted March 16, 2021; accepted March 25, 2021.
One or more of the authors has declared the following potential conflict of interest or source of funding: L.S.O. has received hospitality payments from Arthrex. D.M.S. is a part-time employee of FIGUR8, which is a wearable motion analysis company. E.M.B. has received education payments from Kairos Surgical and consulting fees from Heron Therapeutics. AOSSM checks author disclosures against the Open Payments Database (OPD). AOSSM has not conducted an independent investigation on the OPD and disclaims any liability or responsibility relating thereto.
Ethical approval was not sought for the present study.