
Abstract
Background:
The corrective procedures for meniscal injury are dependent on tear type, severity, and location. Vertical longitudinal tears are common in young and active individuals, but their natural progression and impact on osteoarthritis (OA) development are not known. Root tears are challenging and they often indicate poor outcomes, although the timing and mechanisms of initiation of joint dysfunction are poorly understood, particularly in large-animal and human models.
Purpose/Hypothesis:
In this study, vertical longitudinal and root tears were made in a large-animal model to determine the progression of joint-wide dysfunction. We hypothesized that OA onset and progression would depend on the extent of injury-based load disruption in the tissue, such that root tears would cause earlier and more severe changes to the joint.
Study Design:
Controlled laboratory study.
Methods:
Sham surgeries and procedures to create either vertical longitudinal or root tears were performed in juvenile Yucatan mini pigs through randomized and bilateral arthroscopic procedures. Animals were sacrificed at 1, 3, or 6 months after injury and assessed at the joint and tissue level for evidence of OA. Functional measures of joint load transfer, cartilage indentation mechanics, and meniscal tensile properties were performed, as well as histological evaluation of the cartilage, meniscus, and synovium.
Results:
Outcomes suggested a progressive and sustained degeneration of the knee joint and meniscus after root tear, as evidenced by histological analysis of the cartilage and meniscus. This occurred in spite of spontaneous reattachment of the root, suggesting that this reattachment did not fully restore the function of the native attachment. In contrast, the vertical longitudinal tear did not cause significant changes to the joint, with only mild differences compared with sham surgery at the 6-month time point.
Conclusion:
Given that the root tear, which severs circumferential connectivity and load transfer, caused more intense OA compared with the circumferentially stable vertical longitudinal tear, our findings suggest that without timely and mechanically competent fixation, root tears may cause irreversible joint damage.
Clinical Relevance:
More generally, this new model can serve as a test bed for experimental surgical, scaffold-based, and small molecule–driven interventions after injury to prevent OA progression.
Given the primary load-bearing role of the knee meniscus, injury is common, with an incidence of 66 per 100,000 persons each year. 51 These injuries result in physical disruption of the tissue, in the form of tears that are diverse in type, severity, size, orientation, and location. 19,51 Tears may be acute (and concomitant with another traumatic event in the joint), or they may be degenerative (occurring in a low-energy setting) and arise from a loss of tissue structure/function. With time, these injuries are highly likely to be correlated with osteoarthritis (OA). 66 The International Society of Arthroscopy, Knee Surgery and Orthopaedic Sports Medicine (ISAKOS) developed a classification system to describe tear characteristics and type, 15,17 with the classification of tear type directing their clinical management. While any injury to the meniscus is likely to instigate inflammation, tears that compromise mechanical function typically produce a sustained cascade of degeneration in the knee. For example, while incomplete (<90% width) radial longitudinal tears show maintenance of load transfer, 9,50 large horizontal tears result in increased tibial contact pressure compared with uninjured controls. 8 Even tears that are small in size initially may propagate with time, resulting in larger and more complex tears or complete maceration of the tissue, with subsequent pain and dysfunction.
One of the most common tears in young, active individuals is the vertical longitudinal tear. 17 These tears traverse along circumferential fibers and transect the orthogonal radial fiber network, which acts to resist radial expansion and longitudinal splitting. 17 They are most commonly traumatic, 35 nondegenerative, and are also considered to be the best-case scenario for meniscal repair. 80 For smaller, stable tears (<10-mm length) in the avascular zone, the normal clinical strategy is no treatment. 80 When they are larger and in the red or red-white vascularized zone, 3 vertical longitudinal tears can be suture repaired using outside-in, inside-out, or all-inside techniques. These are usually addressed soon after diagnosis, given that they have the potential to extend into a more problematic displaced bucket-handle tear. 80 While vertical longitudinal tears have better clinical outcomes than other tear types, they can cause mechanical perturbations to the joint, especially when large in size. In terms of peak contact pressure on the tibial plateau, small (<1.5 cm) vertical longitudinal tears in the posterior horn cause no change, 27 whereas larger (2.5 cm) vertical longitudinal tears increase peak contact pressure compared with intact controls. 13 Similarly, large vertical longitudinal tears in the body of the meniscus result in decreased strain in the anterior horn compared with intact controls. 31 Thus, if left untreated or if healing is insufficient, large vertical longitudinal tears may affect load transfer, become larger, or both. Given their commonality, there is a need for further investigation of the natural progression of this tear type under controlled conditions.
While vertical longitudinal tears may progress in size, resulting in abnormal joint stress distribution, other tear types result in an immediate change in knee mechanics. For example, complete root tears sever the meniscotibial attachment and are most commonly observed at the posterior attachment. These tears are challenging to treat, easy to miss, and without appropriate fixation, cause altered joint loading 56 and significant risk of cartilage degeneration, subchondral fracture, and progressive OA. 11 After vertical longitudinal tear, suture repair is advised if possible, 10,17,32,35,36,42,80 given that absent repair, patients invariably have poor outcomes. 37 This is thought to be because root tears lead to marked changes in the load-bearing function of the meniscus. With a root tear, the medial meniscus is susceptible to extrusion. 34 The loss of hoop stress and increased meniscal extrusion after a root tear results in reduced contact area between the meniscus and tibia, and increased peak loads on the tibial plateau cartilage, 56,84 which then leads to rapid cartilage degeneration. 17,80 In small- and large-animal models, a surgical destabilization of the medial meniscus (DMM)—the equivalent of a root tear—has been effectively used to instigate joint degeneration by a number of research groups.** Specifically, anterior release was performed by Oláh and colleagues 55 in a sheep model and by Waller and colleagues 81 in a porcine model. In addition, multiple papers by the Cook group 39,46,57 describe a canine arthroscopic posterior meniscal release model and associated outcomes. Given the severity of joint degeneration subsequent to root tears, there is also need for further investigation of the natural progression of this tear type under controlled conditions.
Although it is clear that adverse outcomes arise after meniscal tears, additional work is needed to define the trajectory of joint disease after these injuries. Human clinical studies provide insight into postoperative outcomes and long-term follow-up, but they generally rely on patient-reported outcomes and do not provide high spatiotemporal resolution in terms of changes in cartilage and meniscus after injury. 11,37,73 Small-animal models, on the other hand, have been used extensively to investigate cartilage and joint changes after injury, but these changes typically occur over accelerated time intervals relative to humans, and the small animal size does not provide for assessment of the meniscus itself. 14,18,26,28,45,49 Additionally, these studies largely utilize the DMM surgical technique and do not address other clinically relevant meniscal injuries. To that end, we and others look to large-animal models to fill this knowledge gap in the field of meniscal injury and to investigate cartilage and joint pathology over time scales relevant to the human disease. 46,55,81
The goal of this study was to determine the spatiotemporal progression of joint pathology after surgically induced vertical longitudinal tear or root tear (via DMM) in a large-animal model. To accomplish this goal, we developed an arthroscopic meniscal injury model in the Yucatan minipig and evaluated outcomes at 1, 3, and 6 months after injury. Here we report the longer term time points, additional assays, and comparison between DMM and vertical longitudinal injury, with a focus on 6-month results. We hypothesized that DMM would cause joint degeneration at earlier time points, whereas vertical longitudinal tears would take longer to show degeneration.
Methods
Study Design
This study received ethics approval from the Institutional Animal Care and Use Committee of the University of Pennsylvania. A total of 51 stifle joints (Figure 1A) in 32 Yucatan minipigs (Sinclair Bioresources, average age: 7.4 ± 1.2 months [range, 6.1-10.2 months]; castrated males, average weight: 28.6 ± 4.2 kg [range, 19-35 kg]; bilateral surgeries) underwent arthroscopic surgery between February 15, 2018, and June 20, 2019. Animals were euthanized at 1, 3, or 6 months after surgery. Experimental conditions included an arthroscopic sham control (sham group; n = 5 at 1 month, n = 6 at 3 months, n = 5 at 6 months), a vertical longitudinal defect approximately 4 to 5 mm (vertical group; n = 6 at 1 month, n = 7 at 3 months, n = 4 at 6 months), and DMM 26 (DMM group; n = 6 at 1 month, n = 7 at 3 months, n = 5 at 6 months) and were randomized across stifle joints (Table 1). Data from a subset (sham and DMM, 1- and 3-month time points) of these animals have been previously reported 6 and were used to establish the model system.
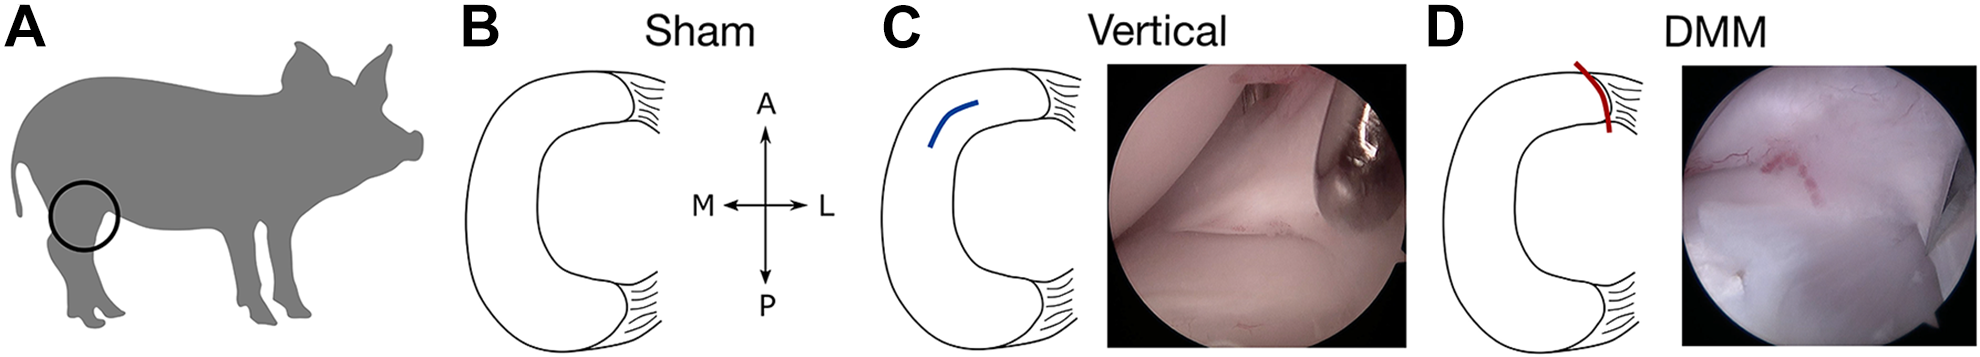
Schematic of experimental groups. (A) Yucatan minipigs (juvenile; age 6 months) were subjected to (B) sham surgery (arthroscopic meniscal visualization), (C) introduction of an acute arthroscopic vertical defect in the anterior horn, or (D) destabilization of the medial meniscus (DMM) via acute arthroscopic transection of the anterior horn attachment. A, anterior; L, lateral; M, medial; P, posterior.
Sample Sizes per Experimental Treatment Group at Each Time Point a

a DMM, destabilization of the medial meniscus.
b Data previously published in part (Bansal et al 6 ).
Animal Model and Surgical Procedures
Arthroscopic sham and DMM surgeries were performed as reported previously. 6 Briefly, a No. 11 scalpel blade was used to create lateral and medial parapatellar vertical 2-cm skin incisions, and sterile lactated Ringer solution was used to insufflate the joint. The meniscus was visualized after trimming of the fat pad using an arthroscopic shaver (Stryker). Sham surgeries consisted of verification that the medial meniscus was attached to the tibial plateau using a right-angle probe (Figure 1B). Vertical longitudinal tears (approximately 4-5 mm) were created in the red-white zone of the medial meniscus at the junction of the anterior horn and body using either a No. 11 scalpel blade or an 18-gauge needle (Figure 1C and Supplemental Video 1). To ensure that a full-thickness defect was created, a right-angled probe was placed into the defect and advanced through to the articular cartilage. DMM was performed via a complete transection of the anterior horn of the medical meniscus 26 with a No. 11 scalpel blade 6 (Figure 1D and Supplemental Video 2). To confirm DMM, a probe was used to confirm that the attachment was fully detached.
Magnetic Resonance Imaging
After the animals were euthanized, the intact hindlimbs were removed, skin and excess musculature of the thigh were dissected away, and samples were hydrated in pads soaked with phosphate-buffered saline (PBS). Magnetic resonance imaging (MRI) scanning was carried out as previously described 6 using high-resolution T1 volumetric interpolated breath-hold examination (VIBE) and multislice-multiecho (MSME) T2-weighted mapping sequences, 52 with a 30- to 35-minute total scan time. T2 relaxation time was quantified in the anterior and posterior horns of the medial meniscus and the cartilage-cartilage and cartilage-meniscus contact areas of the medial tibial plateau, as described previously. 6 We chose these T1 VIBE and T2 mapping sequences to quantify geometry and relaxation times, respectively, as these sequences are available on our MRI scanner, yet other sequences such as FLASH (Fast Low-angle Shot), T1ρ, or UTE (Ultrashort echo time) would also be appropriate to obtain these quantitative measures. 53,64,71,76 After completing all scans, samples were frozen at −20°C.
Measurement of Load Transfer in the Stifle
Stifles were thawed overnight and dissected as described previously, keeping ligaments intact. 6 Joints were fixed at 45° of flexion 25,63,75 in a custom aluminum testing jig. Thin-film pressure sensors (I-Scan 6900; TekScan) were equilibrated and calibrated no more than 24 hours before testing, 82 before being sealed with waterproof tape to create an extended tab for insertion. The joint capsule was dissected anteriorly and posteriorly to allow for sensors to be inserted between the meniscus and the tibial plateau. A universal joint was used in line with the jig, allowing for the tibia to move in varus/valgus. This ensured tibiofemoral contact in both compartments of the knee throughout testing. A universal test frame (ElectroForce 3550; TA Instruments) was used to apply dynamic load to the overall joint (10-400 N, 100 cycles, 1 Hz, sinusoidal). Upon the completion of testing, contact areas and peak contact pressures were analyzed when a total of 100 N was measured on the medial compartment. 70
Macroscopic Assessment of the Joint
Immediately after pressure distribution analysis, synovium was collected from the suprapatellar space and frozen at −20°C. Joints were then dissected further by severing the collateral ligaments, and medial and lateral menisci were removed from the tibial plateau. After gross imaging, both medial and lateral menisci (including the anterior attachments) were wrapped in PBS-soaked gauze and frozen at −20°C. Additional gross images were taken of the cartilaginous surfaces with and without India ink staining, 16,21,46,60,81 and staining patterns were categorized as “no wear,” “minor wear” (surface roughening in less than one-fourth of the total area of any one condyle or plateau), or “major wear” (cartilage lesion and/or surface roughening in more than one-fourth of any one condyle or plateau).
Measurement of Cartilage Mechanical Properties
Osteochondral segments (medial-lateral span of the tibial plateau × 20 mm in the anterior-posterior direction) were taken from the medial tibial plateaus of each joint and potted in poly(methyl-methacrylate) (Ortho Jet; Lang Dental Manufacturing) and were oriented orthogonally to an impermeable, stainless steel spherical indenter (Ø = 2 mm). Samples were hydrated with PBS with protease inhibitors (Sigma-Aldrich) to prevent degradation during indentation testing. 47 In both the cartilage-cartilage (area not covered by the meniscus) and the cartilage-meniscus contact area, 4 consecutive stress-relaxation steps (each 0.065-mm displacement at 0.00065 mm/s) were performed, with 600 seconds of relaxation between each step. The thickness of each sample was determined from micro–computed tomography (microCT) images (see the next section), and this value was used to calculate the applied strain and equilibrium modulus at the second strain step.
MicroCT of Osteochondral Segments
After indentation testing, osteochondral samples were fixed in 10% neutral buffered formalin (NBF; Sigma-Aldrich) for at least 24 hours and subsequently scanned in a microCT50 (Scanco) at 70 kV and 85 µA. Subchondral bone volume per total volume (BV/TV) and trabecular thickness was calculated. As described previously, 6 superficial (cartilage-bone interface to 1 mm deep) and deep (2-5 mm deep) cylindrical volumes of interest (Ø = 5 mm) were analyzed in both the cartilage-cartilage and the cartilage-meniscus contact areas. 21,22,60
Cartilage Histology
After microCT analysis, samples were decalcified (Formical-2000; Thermo Fisher Scientific) for a minimum of 14 days and subsequently paraffin processed and embedded. Then, 8 μm–thick sections were cut and stained with safranin-O/fast green to visualize proteoglycan content of the matrix. Three blinded reviewers (S.B., K.S.S., J.M.P.) scored the histological images using the Osteoarthritis Research Society International (OARSI) histopathology guidelines for sheep and goats, which specifically looks at subcategories of cartilage structure, cell number, cell cloning, proteoglycan staining, and tidemark integrity. 44 Sections from each time point were stained, imaged at 20× magnification (Aperio; Leica Biosystems), and scored independently. The median score of the 3 reviewers in each subcategory was summed to yield the final score for each sample.
Meniscal Sectioning and Sample Preparation
Medial menisci were prepared for further analysis as in previous work. 7 Briefly, anterior and posterior horns were separated from the meniscal body. These were radially sectioned to yield a wedge-shaped cross section using a cryostat (model HM500; Microm International GmbH). From the body-horn junction, 16 μm–thick radial sections were cut (n = 20-25 sections/horn). Attachment regions were similarly sectioned to a 16-µm thickness (n = 8-12 sections/attachment) in the radial direction. The 16 μm–thick sections were used for histological analysis. The remaining meniscal body segments were sectioned in the transverse plane. After removal of the top one-third of the tissue, 16 μm–thick sections (n = 3-4 sections/meniscus) were taken in the circumferential plane, followed by 350 μm–thick circumferential sections for mechanical testing (n = 2 sections/meniscus). The 350 μm–thick sections were stored in 1× PBS for 24 to 48 hours at 4°C before testing, while the 16 μm–thick sections were used for histological analysis.
Meniscal Histology
Anterior and posterior horn sections (16 µm thick) reserved for histology were fixed in 10% NBF for 10 minutes before safranin-O/fast green staining to visualize proteoglycan and matrix content. 1,58 Sections were imaged as described earlier, and images were quantified by calculating the percentage area of positive safranin-O staining (open source; ImageJ/FIJI) per cross-sectional area. 6
Meniscal Tensile Testing
Immediately before tensile testing, circumferential samples were trimmed to a dog-bone shape, 59 and cross-sectional area was measured using a custom, laser-based measurement device. 20 Tensile testing was carried out on an electromechanical testing system (model 5848; Instron), and samples were mounted into serrated grips in a PBS bath to ensure tissue hydration, as described previously. 7 Briefly, samples were preloaded to 0.50 N, underwent 10 cycles of preconditioning (0.5%-2%), and then left to rest for 10 minutes to re-equilibrate. Samples were then tested to failure in tension at a rate of 0.1% strain per second. Toe and linear moduli, as well as the transition point, were calculated through a smooth exponential-linear function fitted to the stress-strain curve, 24,67,77 with the transition point fit via a least squares curve fit. The yield point was defined as the divergence of the stress-strain curve from the linear fit (r ≤ 0.97).
Synovium Histology and Scoring
Suprapatellar synovium samples were thawed and fixed in 10% NBF for a minimum of 1 day before paraffin processing and embedding. Then, 8 μm–thick sections were cut and stained with hematoxylin-eosin and scored by 3 blinded and trained reviewers (S.B., C.R.S., R.L.M.) for histologic features of synovitis. The following features were scored according to the OARSI guidelines for large-animal models on 5 independent 10× fields from each section: intimal hyperplasia (from 1 to multiple cell layers), inflammatory cell infiltration (from not present to disperse aggregates), subintimal fibrosis (from minimal to dense and widespread), and vascularity (from <3 to >8 vessels per 10× field). 44,69 All sections were stained and scored together. The median score of the 3 reviewers of each subscore for each sample was used for analysis.
Statistical Analysis
Statistical analyses were performed in GraphPad Prism 8 (GraphPad Software). Sham, vertical, and DMM treatment groups were compared using 1-way analysis of variance (ANOVA) when comparing surgical time. For joint contact analysis, meniscal tensile mechanics, cartilage histology scores, and synovium scoring, 2-way ANOVAs were used, with 1 factor being the group and the other being time. Comparisons were made for differences between groups within time points. Treatment group and time point were compared using 2-way ANOVAs when assessing meniscal histology and MRI parameters in the anterior and posterior horns separately. Similarly, microCT, cartilage mechanics, and MRI data were compared using 2-way ANOVAs in the cartilage-cartilage region and cartilage-meniscus regions, separately. Again, comparisons were made for differences between groups within time points in each location. To verify consistency between scorers, intraclass correlation and percentage agreement measures were calculated after histological scoring. Last, Pearson correlations were performed to identify relationships between outcome measures.
Results
Surgical Details and Postsurgical Recovery
All surgeries were performed without complication, and all animals achieved weightbearing as tolerated within 1 day of surgery, regardless of treatment group. The average surgical time per limb was 40.3 ± 18.7 minutes, with no significant differences between sham, vertical, and DMM limbs (P > .07). No animals were removed from the study until their scheduled date of sacrifice (1, 3, or 6 months).
Load Transmission Through the Knee
At 1 month, sham and vertical groups showed similar peak contact pressure and were not different from one another (sham: 1.8 ± 0.4 MPa, vertical: 1.5 ± 0.4 MPa; P = .87) while DMM joints had an elevated peak pressure relative to both other groups (3.5 ± 0.9 MPa; P < .006) (Figure 2, A and B). Similar results were found in contact area measurements (sham: 152.3 ± 14.7 mm2, vertical: 152.0 ± 14.9 mm2; P = .99), where DMM joints had significantly decreased contact areas (104.0 ± 29.2 mm2; P = .04) (Figure 2C). These trends disappeared by 3 and 6 months, however, with all groups being statistically similar in terms of peak contact pressure (sham, 3 months: 1.9 ± 0.3 mm2, vertical, 3 months: 1.9 ± 0.5 mm2, DMM, 3 months: 2.2 ± 1.1 mm2 [P > .55]; sham, 6 months: 1.7 ± 0.5 mm2, vertical, 6 months: 1.5 ± 0.4 mm2, DMM, 6 months: 1.5 ± 0.4 mm2 [P > 0.85]) (Figure 2B) and contact area (sham, 3 months: 144.6 ± 13.3 mm2, vertical, 3 months: 155.0 ± 20.8 mm2, DMM, 3 months: 152.2 ± 21.6 mm2 [P > .74]; sham, 6 months: 158.8 ± 25.8 mm2, vertical, 6 months: 138.0 ± 34.1 mm2, DMM, 6 months: 141.0 ± 27.3 mm2 [P > .42]) (Figure 2C). This indicates that while DMM caused a marked change in load transfer at 1 month, this resolved by the later time points.

Load transfer in the knee as a function of injury type and time after injury. (A) Representative contact stress maps on the tibial plateau. White-dashed line outlines the approximate location of the meniscus and delineates cartilage-meniscus (C-M) and cartilage-cartilage (C-C) contact areas. (B) Peak contact pressure and (C) contact area calculated from contact maps. A, anterior; DMM, destabilization of the medial meniscus; L, lateral; M, medial; P, posterior. *P < .05. Note that data from the sham and DMM groups at the 1- and 3-month time points are reproduced from Bansal et al. 6
Macroscopic Joint Assessment
Joints were also assessed for macroscopic evidence of injury and wear. Vertical tears were clearly visible in dissected menisci at 3 months (5 of 7 specimens) and 6 months (3 of 4). As described previously, 6 DMM-injured menisci showed a fibrovascular scar at the anterior attachment at 1 month that became more substantial at 3 months. Here, by 6 months, these DMM joints showed continued consolidation of the fibrovascular scar (5 of 5) and substantial narrowing of the anterior cross-sectional width (4 of 5) in the anterior horn (Figure 3A). Very little or no wear was observed in the cartilage of sham-operated joints at all time points. Joints with vertical tears showed minor wear at 1 month (2 of 6), minor (3 of 7) and major (2 of 7) wear at 3 months, and minor wear in all samples (4 of 4) at 6 months. DMM joints showed major cartilage wear that became progressively more apparent at 1 month (2 of 6), 3 months (6 of 7), and 6 months (4 of 5) (Figure 3, B and C). Thus, vertical tears remained visible and caused generally minor cartilage wear, while DMM injuries resulted in the formation and consolidation of an anterior fibrovascular scar, and progressive cartilage wear.

Macroscopic visualization and scoring of joints as a function of injury type and time after injury. (A) Representative images of visible vertical tears (left, arrowhead) and narrowing and scar formation after DMM (right, asterisk). Scale bar = 1 cm. (B) Representative images of minor (left, arrowhead) and major (right, arrowhead) wear on the tibial plateau. Scale bar = 1 cm. (C) Graph showing degree of wear observed for each injury type; no wear (solid bar), minor wear (diagonal fill) and major wear (light fill). A, anterior; DMM, destabilization of the medial meniscus; L, lateral; M, medial; P, posterior.
Tibial Plateau Cartilage Mechanical Properties
Cartilage mechanics of the tibial plateau were assessed for each group and at each time point using indentation testing of the region covered by the meniscus (cartilage-meniscus region) and the region not covered by the meniscus (cartilage-cartilage region). In the cartilage-meniscus region, there were no differences between sham and vertical groups at any time point. With DMM, however, there was a decrease in the indentation modulus at 1 month (sham: 1.41 ± 0.27 MPa, DMM: 0.74 ± 0.34 MPa [P = .002]; 50% decrease) (Figure 4A). However, by 3 and 6 months, differences between groups were no longer detected. In the cartilage-cartilage region, no differences were detected between sham and vertical groups at any time point. For DMM there was, however, a significant decrease in the indentation modulus at 6 months (sham: 1.61 ± 0.21 MPa, DMM: 1.07 ± 0.22 MPa [P = .036]; 33% decrease vs sham) (Figure 4B). These data indicate region-specific and time-dependent changes in tibial plateau cartilage mechanics after DMM injury.

Mechanical assessment of the tibial plateau articular cartilage as a function of injury type and time after injury. Indentation modulus in the (A) cartilage-meniscus and (B) cartilage-cartilage contact areas. DMM, destabilization of the medial meniscus. *P < .05, **P < .01. Note that data from the sham and DMM groups at the 1- and 3-month time points are reanalyzed from Bansal et al. 6
Histological Assessment of Tibial Cartilage and Synovium and microCT Analysis of Subchondral Bone Morphology
Safranin-O/fast green stained sections of the articular cartilage of the tibial plateau were graded using the OARSI scoring system for sheep and goats. 44 Reviewers demonstrated good agreement as determined through intraclass correlation coefficient (95% CI, 0.71-0.86). In general, scores increased (ie, cartilage damage worsened) in the DMM group, with both injury groups resulting in cartilage degeneration by the 6-month time point. Specifically, increased overall scores were observed in vertical injury joints at 6 months (sham, 1 month: 3.2 ± 1.3, vertical, 1 month: 7.3 ± 3.0 [P = .15]; sham, 3 months: 2.5 ± 1.8, vertical, 3 months: 3.6 ± 1.6 [P = .85]; sham, 6 months: 4.6 ± 1.1, vertical, 6 months: 10.0 ± 2.8 [P = .073]), but these did not reach the level of significance. Degeneration in DMM joints started earlier, with significant increases in overall score compared with sham at all time points (DMM, 1 month: 9.0 ± 4.6 [P = .027]; DMM, 3 months: 8.2 ± 6.0 [P = .015]; DMM, 6 months: 10.4 ± 4.9 [P = .036]) (Figure 5, A and B). When examining the subgroups of the OARSI score at the 6-month time point, the “structure” subcategory was the major score-driving component, with differences between sham (0.60 ± 0.55) and both injury groups (vertical: 3.8 ± 2.2 [P = .020]; DMM: 4.8 ± 4.3 [P = .0002]) (Figure 5C). Despite good agreement between reviewers (range across subscores, percentage agreement within 1 grade: 85%-96%), hematoxylin-eosin staining of synovium showed considerable variability and no significant differences in each subscore at any time point (Figure 6).

Histological assessment of the tibial plateau articular cartilage as a function of injury type and time after injury. (A) Representative images of osteochondral histology (safranin-O/fast green) of the tibial plateau at 6 months for each group. Scale bar = 500 μ. (B) Aggregate OARSI scoring at each time point and (C) scores from individual categories at 6 months. *P < .05, ****P < .001. Note that samples from the sham and DMM groups at the 1- and 3-month time points are from Bansal et al 6 and here were rescored and reanalyzed by the blinded observers. DMM, destabilization of the medial meniscus; OARSI, Osteoarthritis Research Society International.

Histological assessment of the synovium as a function of injury type and time after injury. (A) Representative images from each group and time point (hematoxylin-eosin staining). Scale bar = 100 μm. Subscores at each time point for (B) hyperplasia, (C) inflammation, (D) fibrosis, and (E) vascularity. DMM, destabilization of the medial meniscus.
MicroCT analysis (BV/TV and trabecular thickness) of the subchondral bone showed no significant differences in either superficial (cartilage-bone interface to 1 mm deep) or deep (2-5 mm deep) zones in both the cartilage-cartilage and cartilage-meniscus contact areas at any time point or with any injury type (Appendix Figures A1 and A2).
Histological Assessment of the Meniscus
Radial sections of the anterior and posterior horn were assessed for proteoglycan content via histology (Figure 7, A and B). Compared with sham, menisci with vertical tears showed decreased proteoglycan content in the anterior horn at 6 months (sham: 0.62 ± 0.08 arbitrary units [a.u.], vertical: 0.44 ± 0.13 a.u. [P = .02]), but not before. For DMM-injured menisci, this loss of proteoglycan (Figure 7, A and C) was noted at both 1 and 3 months 6 and persisted through 6 months (DMM anterior horn, 6 months: 0.27 ± 0.08 a.u.; P < .0001 vs sham). In the posterior horn, loss of proteoglycan was noted for the DMM group at all time points (sham, 6 months: 0.41 ± 0.07 a.u., DMM, 6 months: 0.26 ± 0.09 a.u. [P = .02]), and no changes were seen in this region for vertical injuries (Figure 7, B and D).

Histological and mechanical assessment of the meniscus as a function of injury type and time after injury. (A) Representative images of anterior horn staining (safranin-O/fast green) at 6 months. Scale bar = 2 mm. (B) Quantification of safranin-O ratio at each time point. Note that data in panels A and B from the sham and DMM groups at the 1- and 3-month time points are reproduced from Bansal et al. 6 (C) Representative images of posterior horn staining (safranin-O/fast green) at 6 months. Scale bar = 2 mm. (D) Quantification of safranin-O ratio at each time point. (E) Linear modulus and (F) transition strain at each time point for samples from each group. *P < .05, **P < .01, ***P < .005, ****P < .001. DMM, destabilization of the medial meniscus.
Mechanical Assessment of the Meniscus
Bulk tensile testing of the meniscal body region did not detect differences in linear modulus between groups at any time point (P = .09). It should be noted, however, that there was large variance in the modulus data at 1 month (sham: 83.0 ± 47.3 MPa, vertical: 79.5 ± 21.9 MPa, DMM: 62.3 ± 29.6 MPa), 3 months (sham: 106.5 ± 50.6 MPa, vertical: 108.2 ± 55.3 MPa, DMM: 71.8 ± 35.0 MPa), and 6 months (sham: 61.6 ± 24.6 MPa, vertical: 65.3 ± 26.5 MPa, DMM: 39.7 ± 10.7 MPa) (Figure 7E). We also did not detect any changes in toe-region modulus between groups. However, transition strain, the point at which one transitions from the “toe” region to the “linear” region of the stress-strain curve, was affected by meniscal injury. While there were no differences between groups at 1 month (sham: 5.0% ± 2.3%, vertical: 5.0% ± 0.7%, DMM: 5.0% ± 0.4%; P > .99) and 3 months (sham: 4.1% ± 0.5%, vertical: 4.1% ± 1.3%, DMM: 4.8% ± 1.3%; P > .99), we did note a significant decrease in the transition strain at 6 months in DMM samples (1.6% ± 1.5%) compared with sham (4.3% ± 0.8%; P = .01) and vertical (5.4% ± 0.8%; P = .004) samples (Figure 7F). These differences were not seen in yield strain.
MRI of the Cartilage and Meniscus
Joints were imaged by MRI at each time point to assess structure and content of the cartilage and meniscus. There were no differences in T2 values of the cartilage-cartilage region or posterior horn of the meniscus at any time point. As previously reported, DMM joints had T2 values that were elevated relative to sham in both the cartilage-meniscus region and the anterior horn of the meniscus at the 1-month time point. 6 There were no differences in this measure at either the 3- or 6-month time points. Additionally, there were no differences in T2 time with vertical tears compared with sham at any time point (Figure 8).
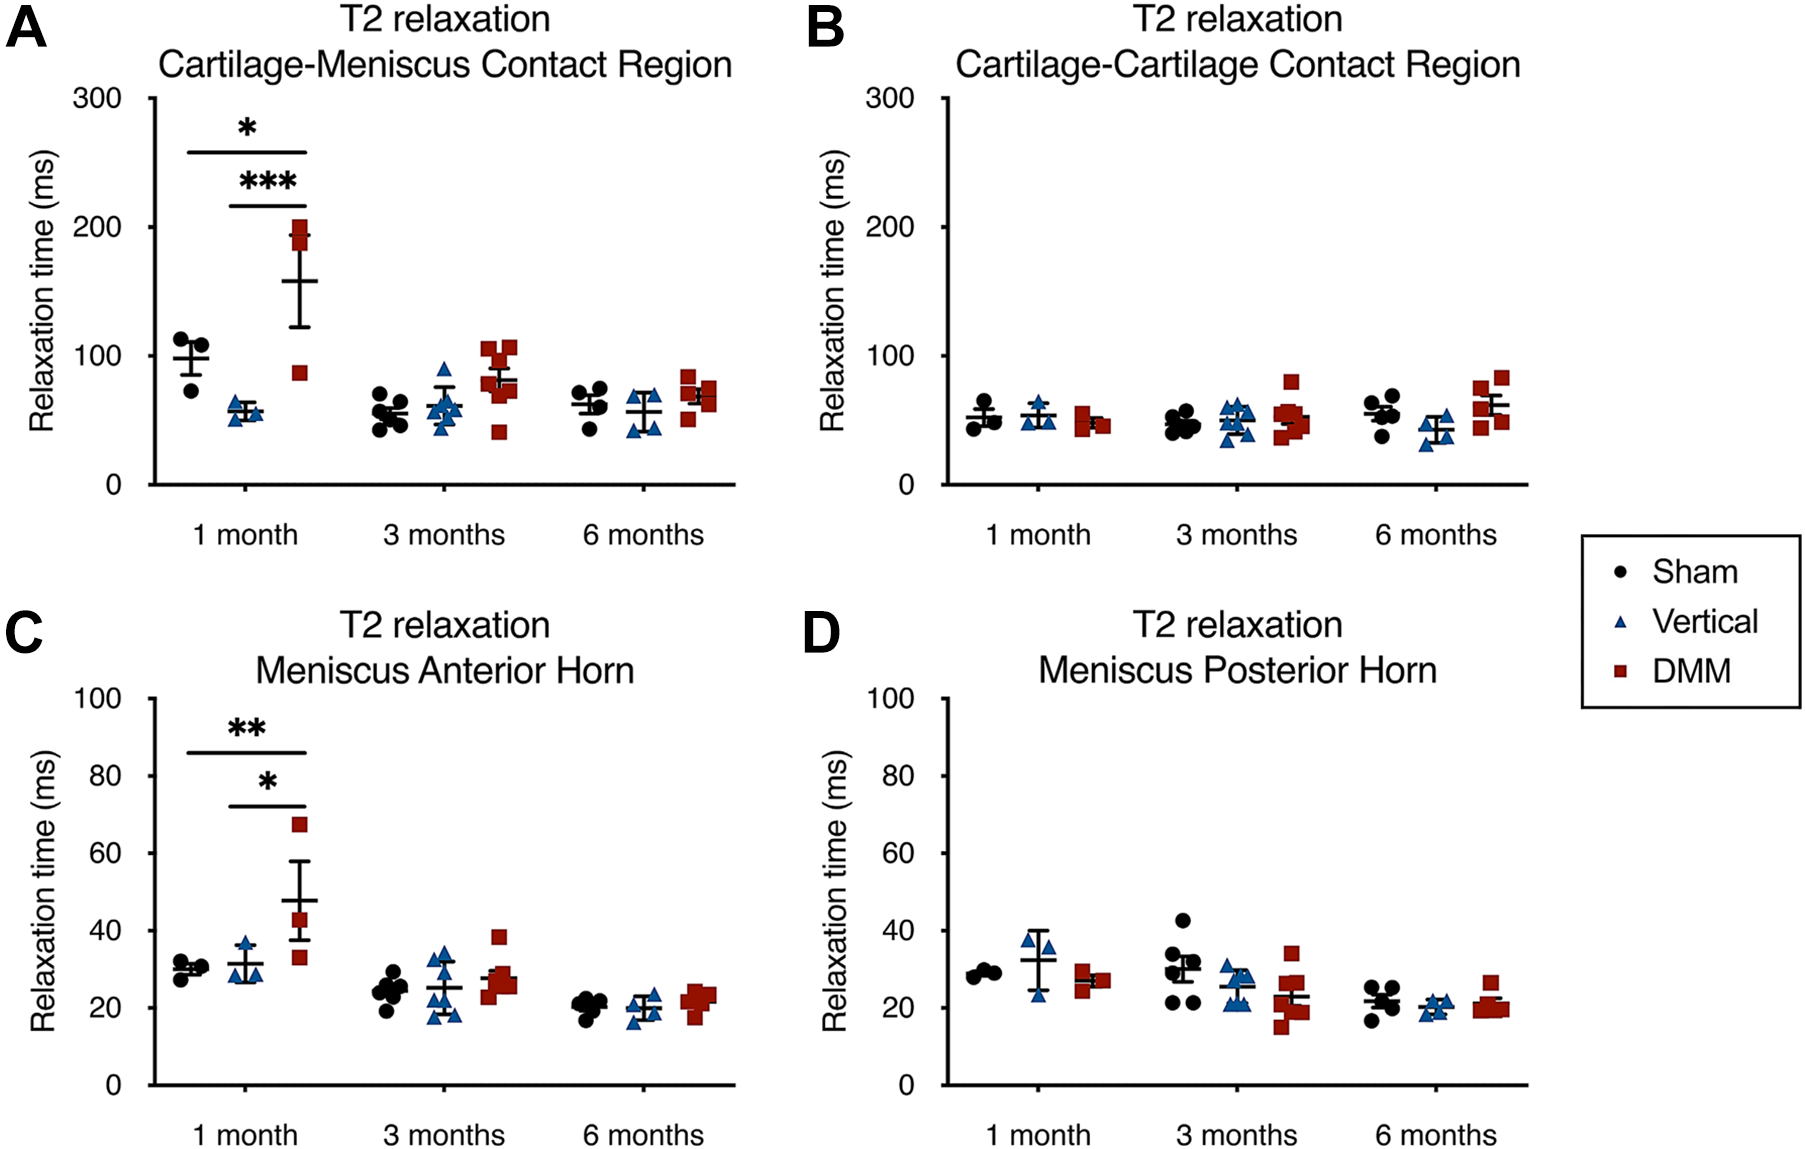
T2 relaxation times of the (A) cartilage-meniscus and (B) cartilage-cartilage contact regions and (C) meniscal anterior and (D) posterior horn across all groups and time points. *P < .05, **P < .0, ***P < .005. DMM, destabilization of the medial meniscus.
Correlations Between OARSI Score and Meniscal Parameters
Interestingly, cartilage OARSI scores correlated significantly (P < .05) with meniscal linear and toe modulus and meniscal safranin-O ratio in the anterior and posterior horns. Given the high level of correlation between linear and toe moduli (r = 0.77; P < 10–11) and between meniscal safranin-O ratio in both horns (r = 0.56; P < 10–5), correlations between cartilage OARSI score and meniscal linear modulus and meniscal anterior horn safranin-O ratio were explored. Linear modulus was negatively correlated with OARSI score (Figure 9A) after injury (r = −0.33; P = .019). Safranin-O ratio of the anterior horn of the meniscus showed an even stronger negative correlation (r = −0.57; P < .0001) with OARSI score (Figure 9B).
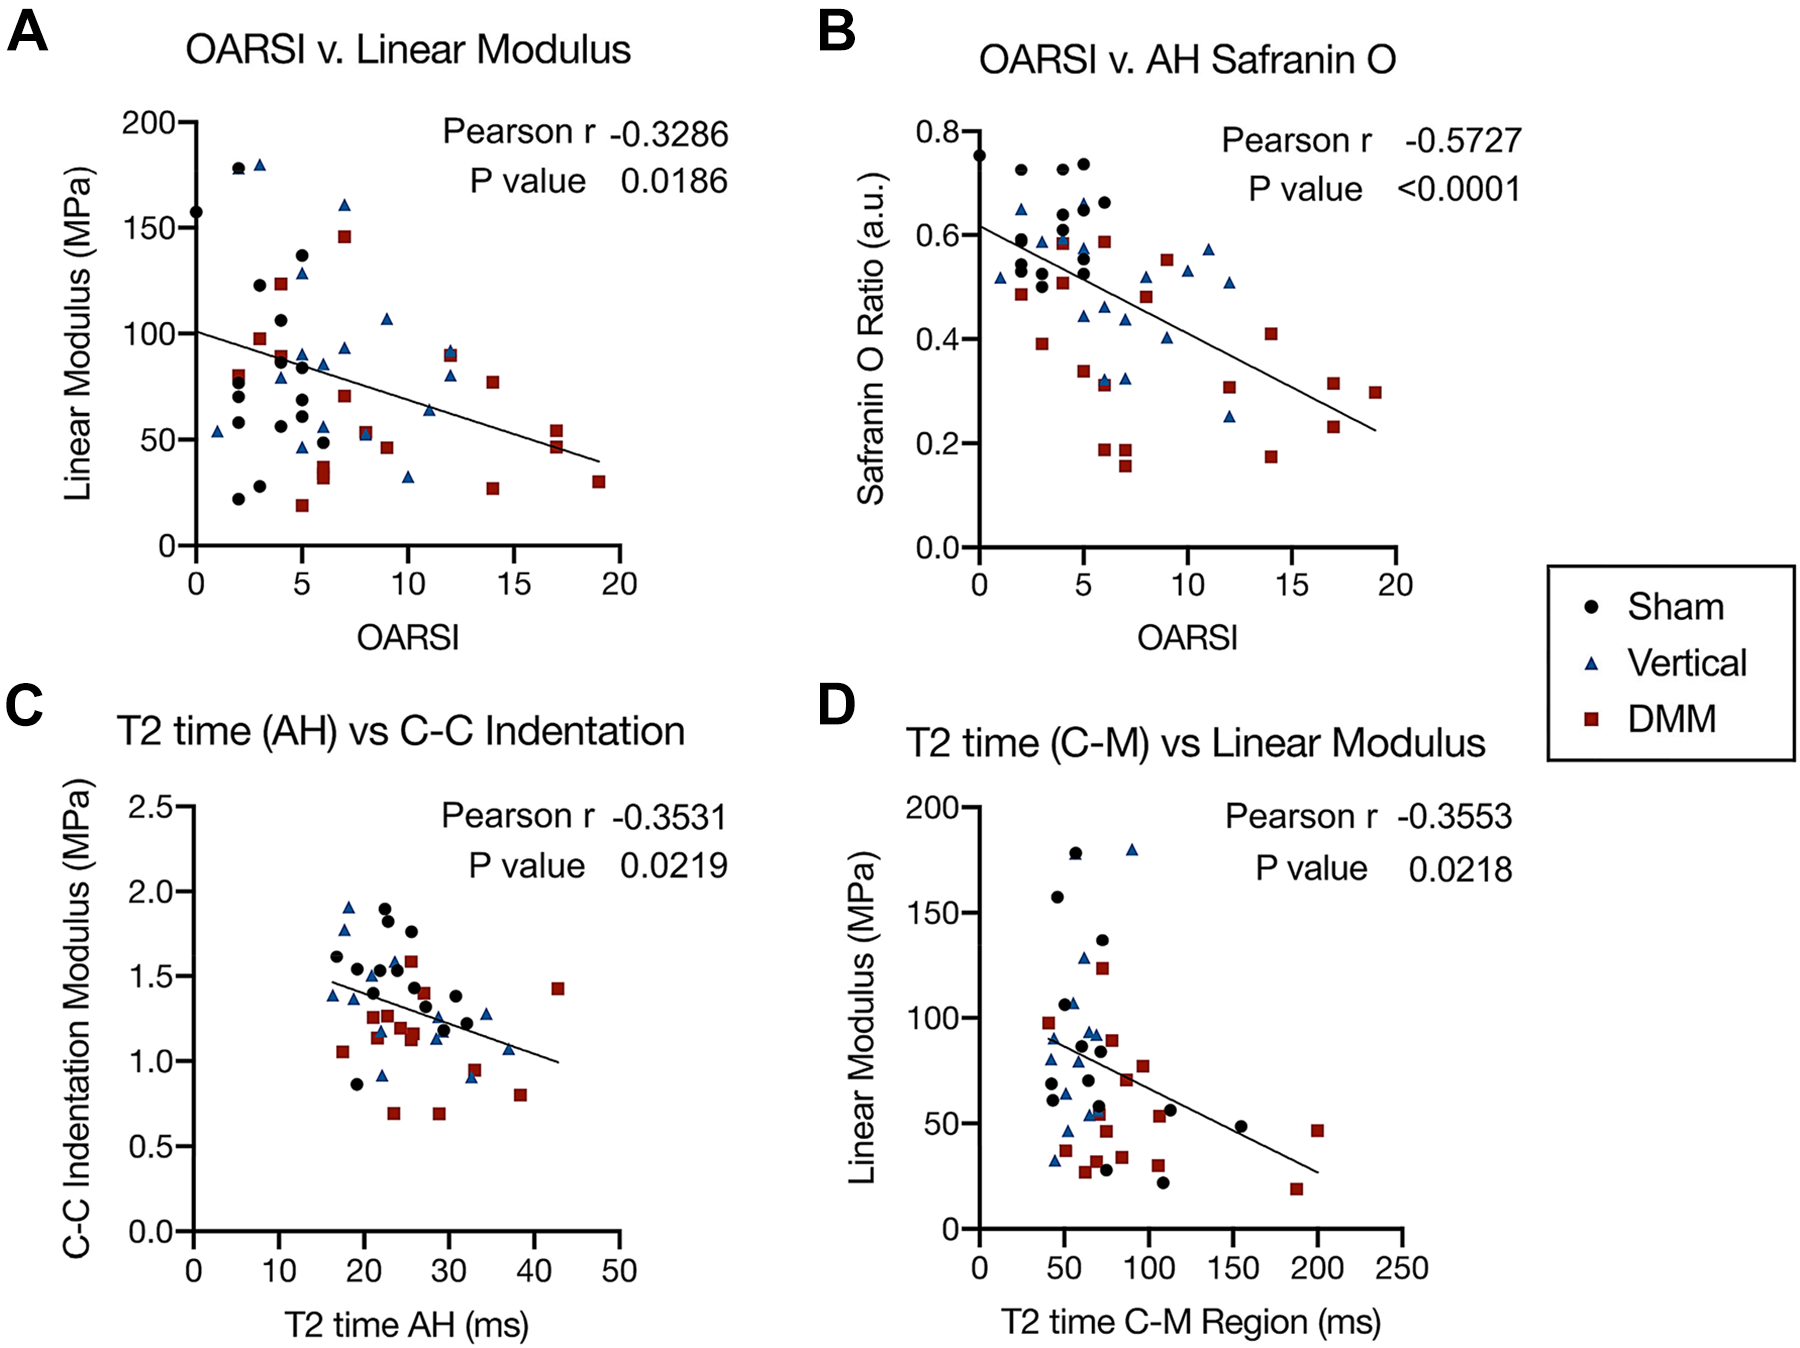
Correlations of Osteoarthritis Research Society International (OARSI) scores with (A) meniscal tensile linear modulus and (B) meniscal safranin-O ratio in the anterior horn (AH). Correlations of (C) T2 times of the meniscal AH with cartilage-cartilage (C-C) indentation modulus and (D) T2 times of the cartilage-meniscus (C-M) region with meniscal linear modulus. DMM, destabilization of the medial meniscus.
Correlations Between MRI T2 Times and Mechanical Parameters
Another interesting set of correlations were related to structural T2 times (via MRI) and mechanical parameters in both the cartilage and the meniscus. Notably, significant correlations were seen between meniscal and cartilage measurements. For example, the T2 time of the meniscal anterior horn was significantly negatively correlated with the cartilage indentation modulus in the cartilage-cartilage indentation region (Figure 9C) after injury (r = −0.35; P = .02). Additionally, the T2 time of the cartilage-meniscus region showed a significant negative correlation (r 2 = −0.36; P = .02) with meniscal linear modulus (Figure 9D).
Discussion
In this study, we developed a large-animal model to represent common meniscal injuries and evaluated the consequence of these injuries on overall joint health and tissue structure and function over a 6-month period. Our findings suggest different trajectories of joint damage as a consequence of these different injury types, which may inform clinical practice regarding appropriateness and timing of intervention.
In general, vertical longitudinal tears resulted in minimal degenerative changes to the joint, despite the persistence of these defects over the 6-month period of study. Notably, the changes that did occur (macroscopic wear, changes in meniscal safranin-O content and osteochondral histopathology) were largely observed at the later 6-month time point (Table 2 ). This may be owing to the smaller size of these injuries, which in clinical practice would not require immediate repair and may have a smaller chance of progression to a more complex bucket-handle tear. 27,80 Indeed, it has been reported that vertical longitudinal tears have a minimal impact on the contact mechanics, whereas bucket-handle tears have a larger impact, 79 suggesting that early-stage vertical longitudinal tears do not immediately create an unstable mechanical environment but have the potential to do so if they grow. The limited changes in overall joint health as a consequence of this type of injury support a nonoperative treatment approach for managing patients with these injuries. This model thus may provide a well-defined test bed for the assessment of novel repair approaches for these types of tears. Indeed, many groups have used a vertical longitudinal tear during ex vivo and large-animal assessment of biologic, 38,74,78,83 scaffold-based, 5,62,65 or surgical repair 2,4,12,16,48,68 strategies. The stability of this defect and lack of healing observed in the meniscus itself indicate its utility for such studies.
Summary Table Showing Changes to the Joint Space, Cartilage and Bone, and Meniscus a

a Vertical longitudinal tear time points are combined, whereas DMM time points are split. The number of arrows indicates the severity of the change. Dashes indicate no significant change compared to Sham. Orange X’s denote transient changes, green X’s denote sustained changes, and purple X’s denote late-arriving changes after injury. AH, anterior horn; C-C, cartilage-cartilage; C-M, cartilage-meniscus; DMM, destabilization of the medial meniscus; MicroCT, micro–computed tomography; MRI, magnetic resonance imaging; OARSI, Osteoarthritis Research Society International; PH, posterior horn; txn, transition strain.
Outcomes of our model of root tears (DMM) are much different than for vertical longitudinal tears, with a mixture of transient, sustained, progressive, and late-arriving degenerative changes across the joint over time. Transient changes include altered joint load transfer, cartilage indentation modulus, MRI T2 time in the cartilage-meniscus region, and MRI T2 time in the meniscal anterior horn (Table 2, orange X’s). These transient changes are likely the consequence of the formation of the fibrovascular scar at the original insertion site, effectively reestablishing some degree of load transfer at the macroscopic level. However, the presence of sustained and progressive changes such as macroscopic wear of cartilaginous surfaces, narrowing of the meniscus, histopathologic changes to the cartilage surfaces, and loss of proteoglycan in the horns of the meniscus (Table 2, green X’s) indicate the continued pathology of the knee joint, even after reestablishment of some load distribution by the meniscus. Those changes that were late-arriving, such as the change in cartilage-cartilage region indentation modulus and change in meniscal transition strain in tension (Table 2, purple X’s) underscore the idea that the meniscus and joint continued to remodel well after the detached horn scars down and reattaches. These findings are in agreement with results from open surgical models of anterior horn detachment 55,81 that showed cartilage histopathology at 6 months after injury. These findings are also in agreement with multiple studies utilizing arthroscopic medial meniscal posterior release in a canine model in terms of histopathology, 46 although our findings differ with respect to subchondral bone remodeling (where little was seen in the current study).
It should also be noted that the location of the injuries in this model was in the anterior horn, while injuries (especially root tears) are most common in the posterior horn in humans. The choice of this location was due to the fact that arthroscopic access to the posterior horn was quite challenging, and both anterior and posterior release should have similar impacts on the meniscus itself, abrogating its ability to generate hoop stresses, regardless of location. Our observations in this DMM response are reminiscent of the clinical finding that nonanatomic repair after root tears has an adverse impact on healing 41,72 and that a reattachment that does not reapproximate the anatomic enthesis does not protect the meniscus and joint. Therefore, in our model, it is likely that the meniscal attachment “healed” and reattached such that it afforded some degree of effective joint-level load bearing but did not achieve tissue-level homeostasis. Clinically, it has been reported that distance between the meniscus horn and its insertion in root tears is positively correlated with worse outcomes. 33 This may account for the milder response we observed in this model compared with other models in which a large segmental removal of the anterior horn leads to much worse outcomes at this time point. 81 Regardless, our data indicate that, absent appropriate fixation of a root tear, the joint will progressively deteriorate, in a similar manner to the murine DMM models on which it was based. This also provides a new surgical model to test the timing and efficacy of such repair procedures on long-term joint health and may direct clinical practice.
Other interesting findings are the correlations relating histopathologic changes in cartilage (a hallmark of OA) and meniscal properties. Joint degeneration is just that, a joint-wide phenomenon, and our findings suggest that, in response to an unloading meniscal injury, meniscus extracellular matrix (glycosaminoglycan content) and meniscal functional properties (linear modulus) are indicators of worsening outcomes across the joint. To our knowledge, this is the first study to show the extent of meniscal degeneration in concert with cartilage wear and degeneration. Additionally, correlations of T2 time to meniscal and cartilage function underscore the utility of MRI as a predictive, noninvasive, and longitudinal measure to follow and predict both cartilage and meniscal degeneration.
This model has some limitations. In accordance with Institutional Animal Care and Use Committee guidelines to reduce animal numbers, we utilized a bilateral model instead of unilateral surgeries with nonoperative contralateral controls. The possible effects of contralateral treatment are undetermined. Bilateral model notwithstanding, the sample size remained low, leading to some variability in outcome measures. This variability is most notable in meniscal tensile mechanics, which has high donor-to-donor and sample-to-sample variability for both porcine 40 and human 23 donor tissue. There is additional variability when assessing histopathology, particularly in injury groups at the longest, 6-month time point. This suggests that some experimental subjects continued to experience progressive cartilage degeneration with time, whereas others stabilized after injury. Longer time points would likely clarify progression of this injury response. Additionally, this study utilized juvenile animals (age 6 months), as they are more likely to have a healthy knee at time zero and because juvenile porcine menisci can remodel in response to changes in loading conditions, that is, with development and sustained load. 7,29,30,43,61 However, juvenile animals mature, and some of the temporal changes seen in this study may be due to development and not intervention. While the goal of this study was primarily to understand the etiology of meniscal degeneration secondary to injury, repeating these studies in larger, skeletally mature animals may provide further insight and clinical relevance. Last, microscale assays investigating catabolic extracellular matrix digestion may provide additional spatiotemporal understanding of the progression of degeneration.
Conclusion
This porcine model detailed the whole-joint impacts of 2 types of clinically relevant meniscal tears. This model indicates a slower and milder progression than other, more aggressive studies, and therefore may better mimic those acute but smaller clinical tears that progress to joint deterioration. Our finding that small vertical longitudinal tears cause minor pathological changes to the joint that took 6 months to be apparent reaffirms the relevance of tear size and orientation in clinical management of meniscal tears. Additionally, the spontaneous reattachment of the anterior meniscal attachment after DMM, while likely not physiologically relevant in the posterior horn of human patients, indicates the importance of root reattachments. In particular, these data suggest that in the absence of a timely and mechanically competent fixation method, the joint may not recover from a root tear. Last, the correlations between meniscal degeneration and cartilage histopathology indicate that in the context of meniscal injury, OA is an interconnected disease of both the cartilage and the meniscus. Now that it has been established, this model may serve as a test bed for experimental surgical, scaffold-based, and small molecule-driven interventions after injury to prevent OA development and will support further studies on meniscal repair. This model also supports the field of sports medicine by detailing the early progression of degeneration after clinically relevant meniscal tears.
A Video Supplement for this article is available at http://journals.sagepub.com/doi/suppl/10.1177/23259671211035444.
Footnotes
Notes
Final revision submitted April 7, 2021; accepted May 4, 2021.
One or more of the authors has declared the following potential conflict of interest or source of funding: This work was supported by the Department of Veterans Affairs (I01 RX000174, IK6 RX003416, and I21 RX003293) and the National Institutes of Health (R01 EB002425, R01 AR056624, and T32 AR007132). Additional support was provided by a New Investigator Award from the Orthopaedic Research and Education Foundation and a pilot award from the Penn Center for Musculoskeletal Disorders (P30 AR069619). L.M.M. has received hospitality payments from Stryker. J.M.P. has received consulting fees from NovoPedics. M.H.Z. has received education payments from Arthrex and Liberty Surgical. C.R.S. has received consulting fees from Bayer. AOSSM checks author disclosures against the Open Payments Database (OPD). AOSSM has not conducted an independent investigation on the OPD and disclaims any liability or responsibility relating thereto.
Ethical approval for this study was obtained from the University of Pennsylvania Institutional Animal Care and Use Committee (protocol 806410) and the Department of Veterans Affairs Medical Center (ID 01740).
Acknowledgment
The authors acknowledge Dr Michael Eby and Dr Anthony Martin for their help in developing the surgical model.
APPENDIX
References
Supplementary Material
Please find the following supplemental material available below.
For Open Access articles published under a Creative Commons License, all supplemental material carries the same license as the article it is associated with.
For non-Open Access articles published, all supplemental material carries a non-exclusive license, and permission requests for re-use of supplemental material or any part of supplemental material shall be sent directly to the copyright owner as specified in the copyright notice associated with the article.