
Abstract
Background:
Graft tears and contralateral anterior cruciate ligament (ACL) tears are common in pediatric athletes after ACL reconstruction. Use of objective return-to-sports (RTS) criteria, in particular physical performance tests (PPTs), is believed to reduce the incidence of secondary injury; however, pediatric norms for these tests are unknown.
Purpose:
To establish a proof of concept for the creation of age- and sex-based norms for commonly used RTS PPTs in healthy pediatric athletes, allowing the creation of growth curves for clinical referencing.
Study Design:
Cross-sectional study; Level of evidence, 3.
Methods:
A total of 100 healthy people who were between the ages of 6 and 18 years and involved in organized sports were enrolled, with even distributions of age and sex. All participants underwent 9 common RTS PPTs: stork test, stork test on Bosu, single-leg squat, single-leg squat on Bosu, clockwise and counterclockwise quadrant hops, single-leg hop for distance, 6-m timed hop, and triple crossover hop for distance. Mean performance across limbs was calculated for each individual. Chronological age, height, weight, sex, and self-reported Pubertal Maturational Observational Scale (PMOS) score were recorded. Univariable and multivariable models were created for each PPT, assessing the importance of the recorded descriptive variables. Quantile regression was used to create growth curves for each PPT.
Results:
The cohort was 52% female, and the mean ± standard deviation age was 11.7 ± 3.6 years. PMOS was highly correlated with age (r = 0.86) and was excluded from the regressions. In univariable regression, age, height, and weight were strong predictors of performance for all PPTs, whereas sex was a predictor of performance on the single-leg and triple crossover hops for distance (with males outperforming females). Height and weight were excluded from multivariable regression because of multicollinearity with age. Multivariable regression showed predictive patterns for age and sex that were identical to those shown in the univariable analysis. Given ceiling effects, quantile regression for the stork tests was not possible, but quantile regression growth curves were successfully created for the 7 remaining PPTs.
Conclusion:
Chronological age and sex accurately predicted performance on common RTS PPTs in pediatric patients. The growth curves presented herein could assist clinicians with benchmarking pediatric patients postoperatively against a healthy athletic cohort.
Sports medicine surgeons are frequently faced with the difficult task of deciding when athletes are ready to return to sports (RTS) after anterior cruciate ligament (ACL) reconstruction. This decision is particularly challenging in the pediatric athlete, in whom the rate of second ACL injury after RTS approaches 35%. 1,3 –5,15 The majority of surgeons and physical therapists use some combination of physical performance tests (PPTs), most commonly hop tests, to assess readiness for RTS. These tests are often used in conjunction with patient-reported outcomes 3 and psychological metrics of readiness 6 to formulate a decision about return to play. Unfortunately, the performance of PPTs in predicting risk of reinjury is still highly contested. 4,8
A unique challenge in the pediatric population is that age- and sex-based norms for common PPTs are unknown. As a result, athletes are judged solely based on a limb symmetry index (LSI), which compares their postoperative limb to their unaffected limb, typically requiring LSI >90% for RTS. This is an intrinsically flawed strategy, as recent data have shown that fewer than half of healthy pediatric athletes can achieve LSI >90% on hop testing, even in the absence of injury. 6 Additionally, it is well established that deconditioning of the nonoperative limb occurs after ACL reconstruction, thereby inflating LSI at the time of RTS. 10
We therefore believe that benchmarking pediatric athlete performance against age- and sex-based norms, in addition to considering LSI, might improve the predictive accuracy of RTS testing. The present study is aimed at filling a critical gap in the literature by providing a proof of concept to establish age- and sex-specific normative data from healthy pediatric athletes for the most commonly used PPTs in ACL-related RTS decision making. Clinically, this will allow the treating physician to plot an individual patient’s performance against a standard growth curve and thereby understand how that patient is faring compared with age- and sex-matched healthy athletes. This provides a more complete picture of recovery than does a simple LSI and may inform clinical decisions about return to play. This is particularly important in the growing athlete, who often returns to sport with a peer group that is developmentally 9 to 12 months ahead of where the athlete was when he or she became injured, making that athlete’s own baseline an improper metric of readiness for return to competition. Our findings will also enable future investigators to evaluate the predictive ability of norm-enhanced RTS testing.
Methods
Cohort Selection
This study included healthy, uninjured volunteers (n = 100) between the ages of 6 and 18 years. Participants were recruited from the local community using email correspondence and public flyers and were required to be actively participating in an organized sport at the time of study participation. Individuals were excluded if they exhibited any of the following: (1) prior ligamentous injury to the knee, hip, or ankle, (2) prior spine or lower extremity surgery, (3) any lower extremity injury within the previous 6 months, (4) inability to participate in neuromuscular testing because of pain or cognitive impairment, (5) ongoing use of any brace or lower extremity orthosis, or (6) any condition or illness that would cause severe shortness of breath with 1 hour of exercise. We made efforts to ensure an even distribution in chronological age of participants. Before enrollment, written informed consent and assent were obtained from a parent and the participant, respectively, for all participants aged 6 to 17 years, and written informed consent was obtained from all 18-year-old participants. The study protocol was approved by the biomedical institutional review board at Duke University Health System.
Data Collection
This study used a prospective, nontherapeutic design. All testing sessions were administered by 1 of 6 licensed physical therapists (including J.R.M., H.S.M., L.P., and M.R.M.). The testing protocol was designed to include a battery of PPTs that could be administered in any clinical or athletic environment to ensure robust external validity. Before administering the testing protocol, investigators recorded descriptive information including age (years), height (centimeters), weight (pounds), leg length (centimeters), and primary sport. Because chronological age alone has been demonstrated to be an insufficient metric of development, participants also completed the Pubertal Maturational Observational Scale (PMOS), 5 a validated questionnaire assessing pubertal maturation. 16
The performance testing protocol consisted of 9 functional tasks commonly used in rehabilitation and RTS testing, including balance, squatting, and hopping tasks. Detailed descriptions of each of these tasks and procedures for testing are provided in Table 1. All participants completed the study protocol on a firm surface in a physical therapy clinic. All tasks were performed bilaterally and in the same consecutive order. However, the task with which each participant started (tasks 1-9) and the extremity tested first (left or right) were randomized a priori using a random number generator. For each task, the number of errors was recorded according to the error classification system described in Table 1. Participants completed 2 trials on each leg for each test with the exception of the single-leg hop tests, which were performed 3 times. We developed a composite score for each test by averaging trials across sides. This composite score (1 score per participant for each test) was used for analyses.
Description of Neuromuscular Testing Protocol a

a Testing protocol originally compiled by Daniel Cooper, MD, and David Surprenant, ATC, of the Carrell Clinic (Dallas, Texas).
Statistical Analysis
We used a stepwise approach to the analysis of our data. First, we developed descriptive statistics and plots of the raw data. We then performed univariable regression of all available descriptive data as a screen for meaningful predictors of performance. We used the information from the univariable analysis to build a more robust multivariable model that allowed for estimates of the isolated effects of individual descriptive predictors on athlete performance. Therefore, we based our required sample size on the recommendation that 10 to 20 subjects per variable allows for the optimal assessment of multivariable regression parameters, and we set out to enroll 100 participants (subjects per variable = 20). 2 Finally, because ordinary regression allows only an estimation of relationships to the mean, we performed quantile regression. Quantile regression fits models for specific percentiles of a data set, allowing a more thorough investigation of the response variable and allowing for different models based on the percentile. This provides much richer information about the data than does a simple regression, in which the variability of athletes’ performance at a given age is reduced to the mean. Additionally, the use of quantile regression allows for the creation of growth curves by allowing modeling of any given percentile of the cohort.
Categorical descriptive variables were summarized using counts and percentages, and continuous descriptive variables were presented as means, standard deviations, medians, 25th and 75th percentiles, and ranges. We constructed univariable linear models to assess the effects of descriptive variables on PPT performance, creating separate models for each PPT variable as well as for each predictor (sex, age, height, weight). Then, multivariable linear models were created to test for adjusted effects of descriptive data (sex and age) for each PPT. Of note, because age, height, and weight were highly correlated with one another, we decided to include only age in the multivariable models. All models were constructed using robust standard errors. For the stork test and stork test on Bosu, the log-normal distribution was assumed for the errors because of an observed ceiling effect at a value of 60. All other models assumed the normal distribution.
To create reference growth curves for clinical use, we performed quantile regression for each PPT as a factor of age, holding other covariates (in this case, sex) constant. This analysis was performed using SAS Version 9.4 (SAS Institute). Age was centered at the mean of 12 years and was modeled by also including a quadratic interaction term. For those PPTs where sex was not predictive of performance in multivariable regression, reference charts for male participants only were created. For those PPTs where sex was predictive of performance in multivariable regression (single-leg hop for distance and triple crossover hop for distance), charts for both male and female participants were created. Predicted norms were reported for the 5th, 10th, 25th, 50th, 75th, 90th, and 95th quantiles.
Results
Cohort Characteristics
The characteristics of the cohort are summarized in Table 2, and results of the performance tests are shown in Table 3.
Characteristics of the Study Population (N = 100) a

a PMOS, Pubertal Maturational Observational Scale; Q, quartile.
b n = 99 participants.
Results of Performance Testing (N = 100) a
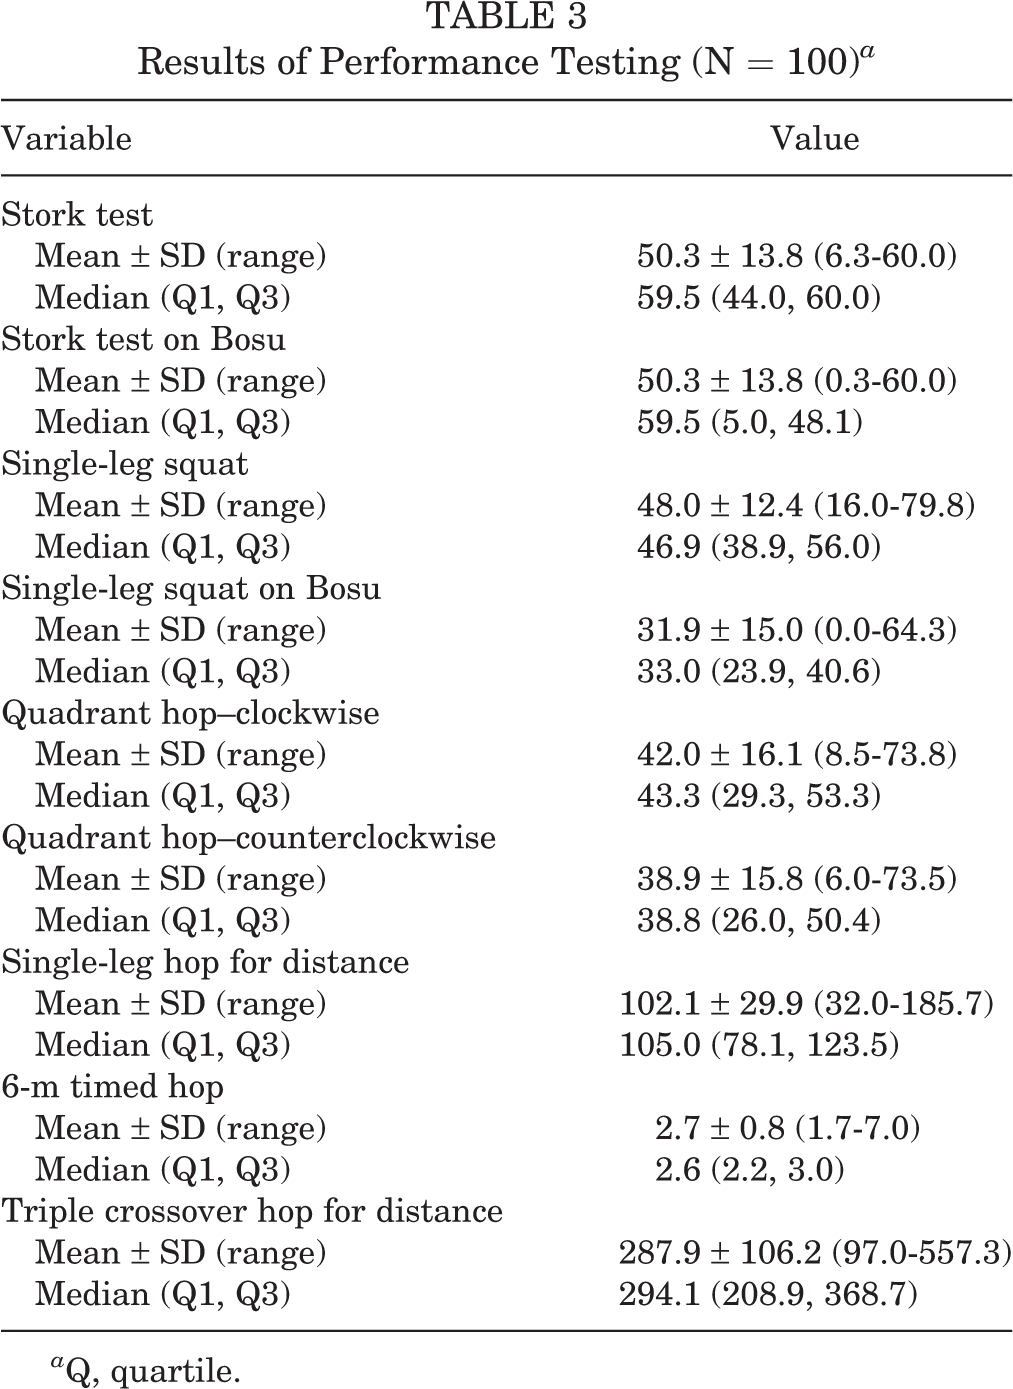
a Q, quartile.
Performance as a Factor of Age and Sex
The raw performance data for all individuals were plotted for each PPT as a factor of age and sex (Figure 1). In our cohort, there was an almost perfect linear correlation between PMOS and chronological age (Pearson r = 0.86); therefore, only chronological age was used for all subsequent analyses and regressions. Predicted ceiling effects occurred at 60 seconds for the stork test and stork test on Bosu, as both tests were stopped if the individual reached 60 seconds. Plots of performance as a function of height and weight were not included because age, height, and weight were highly correlated with each other.

Physical performance test (PPT) results as a factor of age and sex. (A) Stork test; y-axis represents time in seconds. (B) Stork test on Bosu; y-axis represents time in seconds. (C) Single-leg squat test; y-axis represents number of repetitions. (D) Single-leg squat on Bosu; y-axis represents number of repetitions. (E) Quadrant hop—clockwise; y-axis represents number of repetitions. (F) Quadrant hop—counterclockwise; y-axis represents number of repetitions. (G) Single-leg hop for distance; y-axis represents hop distance in centimeters. (H) 6-m timed hop; y-axis represents total hop time in seconds. Of note, a shorter time denotes better performance. (I) Triple crossover hop for distance; y-axis represents total hop distance in cm.
Univariable Regression
Univariable regression of the performance data revealed that age, height, and weight were significant predictors of performance for all of the 9 PPTs evaluated in this study (Table 4). In contrast, sex was predictive of performance only for the single-leg hop and triple crossover hop for distance, with male participants performing better than their female counterparts performed (Table 4).
Univariable Regression of PPT Results as a Factor of Descriptive Variables a

a Bolded P values indicate statistical significance. PPT, physical performance test.
b Estimate of female vs male participants.
c Log-normal distribution for the errors; all other outcomes assumed normal distribution.
Multivariable Regression
Significant multicollinearity existed among age, height, and weight, so height and weight were eliminated from the final multivariable model. In this model, age was predictive of performance for all 9 PPTs, with increasing age predicting improved performance. Consistent with the univariable regression, sex was found to be predictive of performance for only the single-leg hop and triple crossover hop for distance, with male athletes performing better than female athletes performed (Appendix Table A1).
Quantile Regression
Quantile regression was used to create growth curves of predicted performance for each PPT as a factor of age, controlling for sex. Of note, given the strong ceiling effects for the stork test and stork test on Bosu, these were not appropriate for quantile regression. These growth curves are shown for the squat tests in Figure 2, for the quadrant hop tests in Figure 3, and for the linear hop tests in Figure 4.
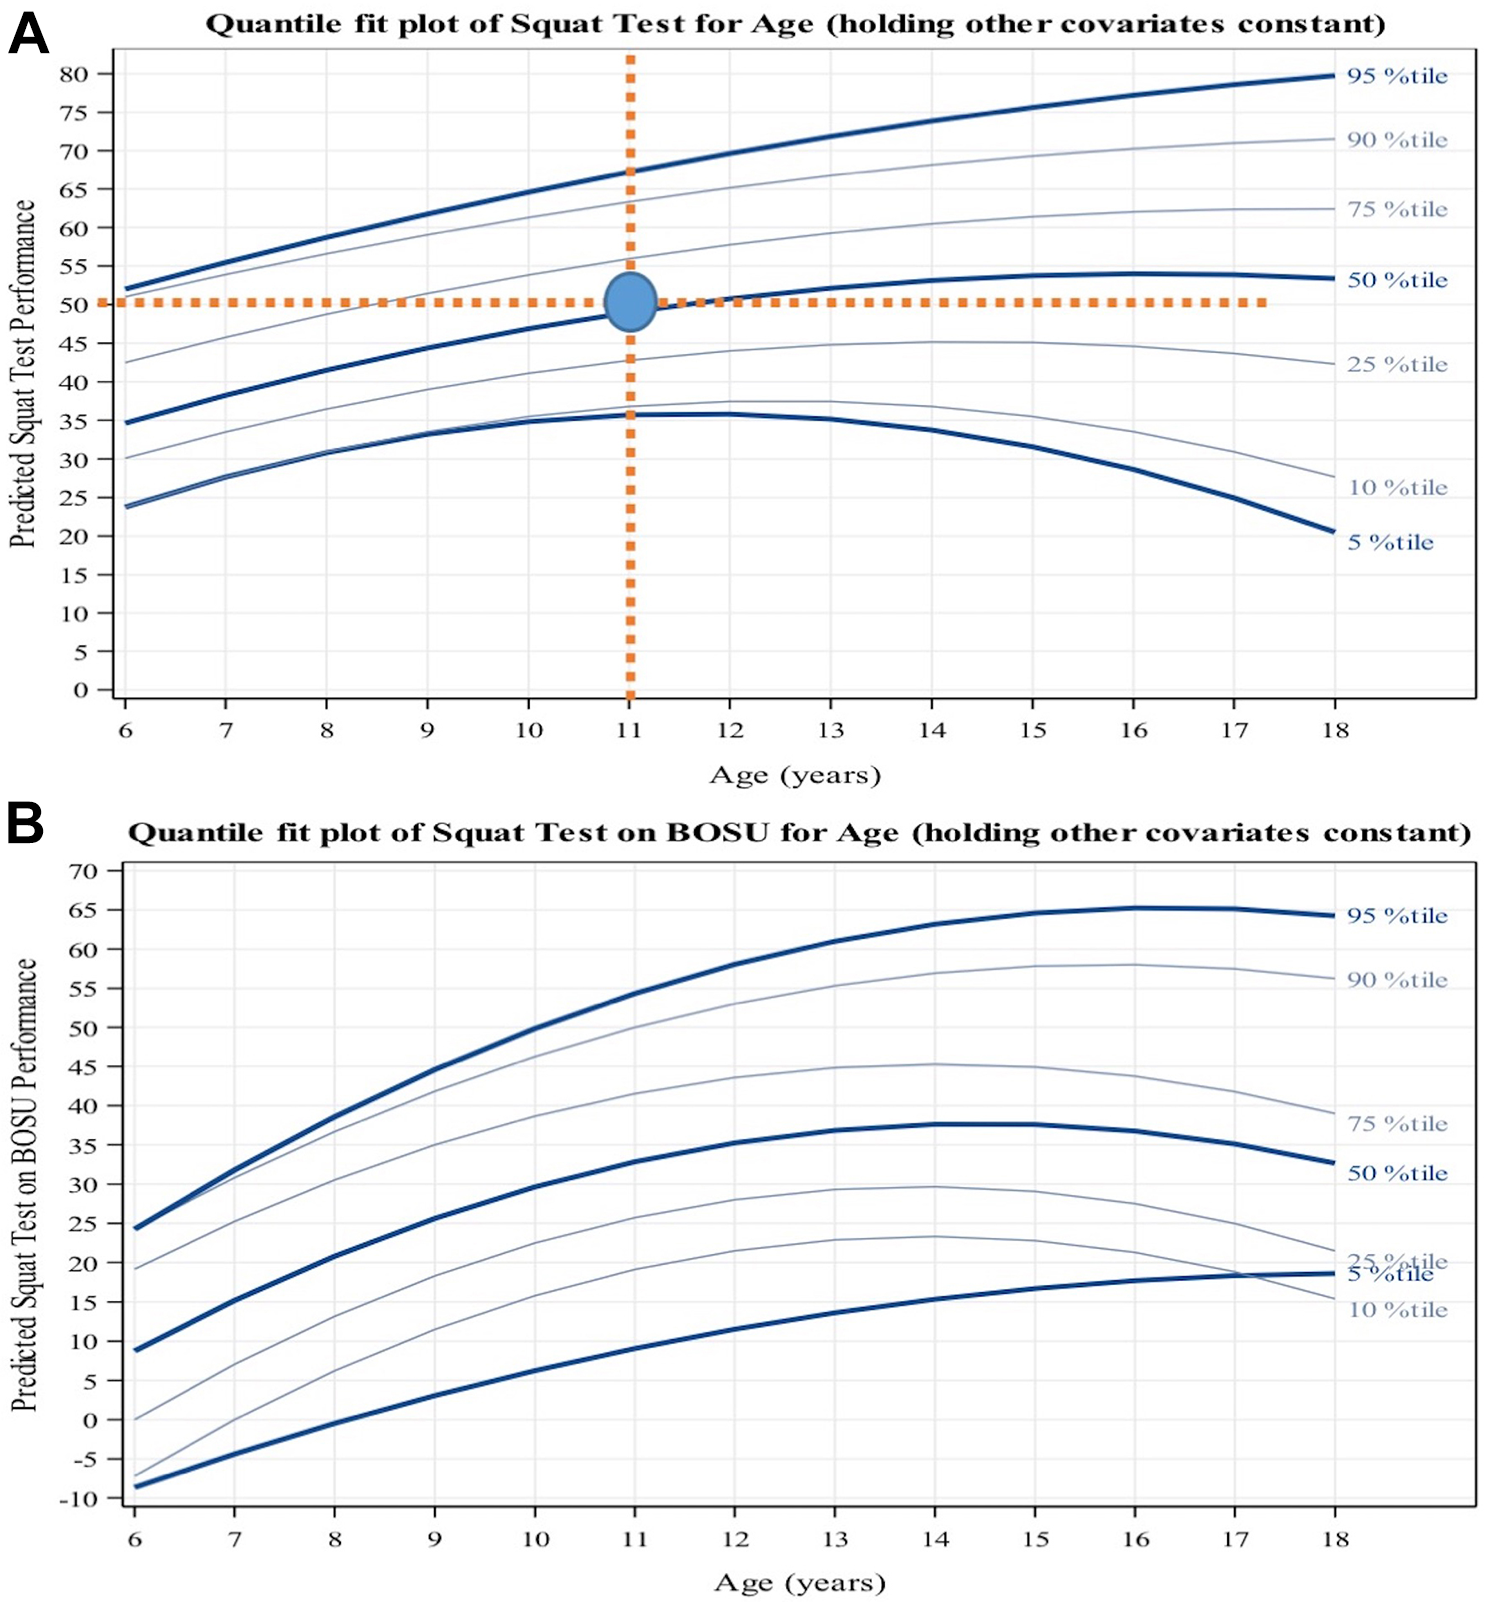
Quantile regression plots for the squat tests: (A) single-leg squat and (B) single-leg squat on Bosu. The x-axis represents participant age, and the y-axis represents predicted performance (number of repetitions). Regression curves are shown for the 5th, 10th, 25th, 50th, 75th, 90th, and 95th percentiles. Physical performance test results were modeled using age (the linear term, centered at the mean age of 12 years, and a quadratic interaction term) and sex as predictors. (A) Clinical use of the growth curve is demonstrated for male participants. Assume a hypothetical 11-year-old male athlete who performed 50 single-leg squat repetitions during testing. A vertical line is drawn from the “11-year” mark on the x-axis, and a horizontal line is drawn from the “50” mark on the y-axis. The intersection of these lines falls at the 50th percentile growth curve, informing the clinician that the male participant performed at the expected 50th percentile for his age.

Quantile regression plots for the quadrant hop tests: (A) quadrant hop—clockwise and (B) quadrant hop—counterclockwise. The x-axis represents participant age, and the y-axis represents predicted performance (number of repetitions). Regression curves are shown for the 5th, 10th, 25th, 50th, 75th, 90th, and 95th percentiles. Physical performance test results were modeled using age (the linear term, centered at the mean age of 12 years, and a quadratic interaction term) and sex as predictors. These curves represent growth curves for male participants.

Quantile regression plots for the linear hop tests: (A) single-leg hop for distance (male participants), (B) single-leg hop for distance (female participants), (C) triple crossover hop for distance (male participants), and (D) triple crossover hop for distance (female participants). In each plot, the x-axis represents participant age, and the y-axis represents predicted performance (distance in centimeters). Regression curves are shown for the 5th, 10th, 25th, 50th, 75th, 90th, and 95th percentiles. Physical performance test results were modeled using age (the linear term, centered at the mean age of 12 years, and a quadratic interaction term) and sex as predictors.
Discussion
The principal finding of this study is that chronological age is a strong predictor of performance on common RTS PPTs, allowing for the creation of growth curves using quantile regression that can help clinicians benchmark their patients against a healthy, uninjured pediatric normative group when making return-to-play decisions.
The decision to clear a child for sports participation after ACL reconstruction is one of the most challenging clinical situations we face in pediatric sports medicine. Although historically a period of 6 months was used as a blanket criterion for RTS, 3 ample data have shown that in children, the requisite time for successful RTS is significantly longer, often upward of 1 year. 6,7,9 Although time alone is not a sufficient criterion for clearance, there is evidence in this population that each additional month of rehabilitation before RTS decreases the risk of second ACL injury by 13%, 6,22 a finding corroborated in young adults. 10,20 This has led to evidence-based guidelines recommending that rehabilitation be pursued for 9 to 12 months in the young, active population. 11,19
Although there is agreement that RTS timelines should likely be extended in children, there is no agreement in the literature about what specific criteria define a safe cutoff to end rehabilitation and resume sporting activities. 4,14 LSI values >90% on hop tests and/or isokinetic quadriceps strength testing are frequently used criteria, 3,13 although LSIs have intrinsic limitations, including baseline limb asymmetries that exist in children 8 and deconditioning of the nonoperative leg after ACL reconstruction, 17,21 which can lead to erroneous interpretation of LSIs. In this study, we included a population of healthy athletic people between the ages of 6 and 18 years in order to develop growth curves that document predicted performance on 9 common RTS tests based on chronological age. This was supported by the finding that in multivariable regression, age was an independent predictor of performance on all PPTs. Additionally, sex was an independent predictor of performance in only 2 of 9 PPTs (single-leg hop and triple crossover hop for distance), eliminating the need for sex-specific growth curves for the majority of PPTs. Because our results were generated in a healthy population, we cannot draw any conclusions about the predictive value of including norm-based benchmarking in RTS decision making; however, we expect the data presented herein to facilitate future prospective studies that specifically address this question.
The sex-specific differences in our data set are interesting. Sex was predictive of performance for only the single-leg and triple crossover hop for distance. This is concordant with previously published studies showing that male athletes outperform female athletes in measures of lower extremity power, 11 including improved performance on single-leg hop testing in high school-aged male athletes. 13 Interestingly, we saw no sex-based differences in tests that focused on balance (Bosu-based tests and stork tests), agility (quadrant hops), or muscular endurance (squat tests). Therefore, during ACL rehabilitation, young female athletes should be held to the same standards as male athletes in terms of absolute performance on balance, agility, and muscular endurance tests. It will be interesting to see whether these sex-based patterns hold true in a post-ACL reconstruction clinical cohort, as female sex is a known predictor of second ACL injury. 13
We were somewhat surprised to find that the PMOS was so strongly correlated with chronological age (r = 0.86) that chronological age alone could be used for the predictive regression and quantile analyses. This could be because of inherent limitations in self-reporting of pubertal maturation that have been previously described. 18 Unfortunately, Tanner staging for large epidemiological studies is both inconvenient and known to be inaccurate when performed by orthopaedic surgeons. 18 In light of these limitations, we believe that our findings of strong correlation between self-reported pubertal maturity and chronological age provide justification for using chronological age alone in pediatric and adolescent benchmarking, greatly simplifying the process for future prospective studies.
In addition to potentially helping guide ACL RTS decisions, our data also have value for the more general assessment of functional capacity or injury risk in the pediatric population. Indeed, hop testing and functional movement screens have been assessed in numerous studies for their injury prediction abilities, with mixed success. 12 In fact, the predictive value of these tests was worse in younger than in older athletes. 12 It is possible that by accounting for age-specific norms described in this study, PPTs might provide meaningful risk stratification tools for the pediatric athlete, perhaps even warranting inclusion in preparticipation physicals. 14
Our study has several limitations, including a comparatively small cohort size, a predominance of soccer athletes (approximately 50% of the cohort), and a narrow geographic distribution of participants, all of which can affect the external validity of our findings. All efforts were made to optimize the internal validity via a single testing surface, a small and consistent group of assessors, rigorous statistical modeling, and strict inclusion and exclusion criteria. However, given the small sample, the results should be interpreted with some caution. A robust population sample is the foundational element in the establishment of normative values. Therefore, this study should be viewed as a successful proof of concept for the feasibility of creating normative growth curves. Given our analysis, we recommend future large-scales studies be done to continue the creation of this normative data.
Conclusion
In this study, we provided potential benchmarks for clinicians treating pediatric patients (in particular, those recovering from ACL reconstruction) to interpret the results of common PPTs within the context of age- and sex-specific norms. We hope that these results will serve as a springboard for ongoing prospective research assessing the value of PPT benchmarking in children and adolescents for risk stratification in various clinical settings, including ACL-related return to play.
Footnotes
Final revision submitted December 10, 2020; accepted January 25, 2021.
One or more of the authors has declared the following potential conflict of interest or source of funding: J.C.R has received hospitality payments from Stryker Corp and Smith & Nephew. AOSSM checks author disclosures against the Open Payments Database (OPD). AOSSM has not conducted an independent investigation on the OPD and disclaims any liability or responsibility relating thereto.
Ethical approval for this study was obtained from Duke Medicine (protocol ID: Pro00080805).
Appendix
Multivariable Regression of Physical Performance Test Results as a Factor of Sex and Age a

| Physical Performance Test | Sex b | Age |
|---|---|---|
| Stork test c | ||
| exp(β) | 1.09 | 1.07 |
| 95% CI | 0.96 to 1.24 | 1.04 to 1.09 |
| P value | .165 |
|
| Stork test on Bosu c | ||
| exp(β) | 1.14 | 1.24 |
| 95% CI | 0.77 to 1.70 | 1.18 to 1.31 |
| P value | .507 |
|
| Single-leg squat | ||
| β | 0.888 | 1.49 |
| 95% CI | –5.314 to 3.539 | 0.82 to 2.15 |
| P value | .692 |
|
| Single-leg squat on Bosu | ||
| β | 3.89 | 2.23 |
| 95% CI | –1.08 to 8.86 | 1.52 to 2.94 |
| P value | .124 |
|
| Quadrant hop—clockwise | ||
| β | –0.454 | 3.23 |
| 95% CI | –4.824 to 3.916 | 2.59 to 3.87 |
| P value | .837 |
|
| Quadrant hop—counterclockwise | ||
| β | –1.60 | 2.93 |
| 95% CI | –6.17 to 2.98 | 2.21 to 3.65 |
| P value | .490 |
|
| Single-leg hop for distance | ||
| β | –15.45 | 5.30 |
| 95% CI | –24.22 to –6.67 | 3.79 to 6.80 |
| P value |
|
|
| 6-m timed hop | ||
| β | 0.214 | –0.136 |
| 95% CI | –0.029 to 0.458 | –0.185 to –0.087 |
| P value | .083 |
|
| Triple crossover hop for distance | ||
| β | –80.94 | 21.03 |
| 95% CI | –106.35 to –55.53 | 16.76 to 25.29 |
| P value |
|
|
a Bolded P values indicate statistical significance.
b Estimate of females vs males.
c Log-normal distribution for the errors; all other outcomes assumed normal distribution.