
Abstract
Background:
Studies have reported favorable clinical outcomes after osteochondral allograft (OCA) transplantation to treat osteochondral defects and have demonstrated that healing of the osseous component may be critical to outcomes. However, there is currently no consensus on the optimal modality to evaluate osseous healing.
Purpose:
To define parameters for OCA healing using computed tomography (CT) and to investigate whether osseous healing identified using CT is correlated with improved pain and function on patient-reported outcomes (PROs) collected closest in time to the postoperative CT scan and at final follow-up.
Study Design:
Case series; Level of evidence, 4.
Methods:
Of 118 patients who underwent OCA transplantation for articular cartilage defects of the knee over the 10-year study period, 60 were included in final analysis based on completion of CT scans at 5.8 ± 1.9 months postoperatively and PROs collected preoperatively and postoperatively. CT parameters, including osseous incorporation, bone density, subchondral bone congruency, and cystic changes, were summarized for each patient relative to the cohort. Parameters were assessed for inter- and intrarater reliability as well as for covariation with patient characteristics and surgical variables. Structural equation modeling was used to assess correlation of CT parameters with change in PROs from preoperatively to those collected closest in time to CT acquisition and at the final follow-up.
Results:
Bone incorporation was the most reliable CT parameter. The summarized scores for CT scans were normally distributed across the study population. Variance in CT parameters was independent of age, sex, body mass index, prior surgery, number of grafts, lesion size, and location. No significant correlation (P > .12 across all comparisons) was identified for any combination of CT parameter and change in PROs from baseline for outcomes collected either closest to CT acquisition or at the final follow-up (mean, 38.2 ± 19.9 months; range, 11.6-84.9 months). There was a uniformly positive association between change in PROs and host bone density but not graft bone density, independent of patient characteristics and surgical factors.
Conclusion:
CT parameters were independent of clinical or patient variables within the study population, and osseous incorporation was the most reliable CT parameter. Metrics collected from a single postoperative CT scan was not correlated with clinical outcomes at ≥6-month longitudinal follow-up.
Keywords
Introduction
Osteochondral allograft (OCA) transplantation represents a durable and effective treatment for large osteochondral defects of the knee. Indications for OCA transplantation for the knee include symptomatic, monopolar or bipolar, International Cartilage Repair Society (ICRS) grade 3 or 4 lesions >2 to 3 cm2 in size. 11,19 The surgery was historically reserved for young, high-demand patients with osteochondral lesions secondary to osteochondritis dissecans (OCD), avascular necrosis, or traumatic injury 8 ; however, multiple recent studies have reported the benefit of OCA transplantation in older patients with traumatic cartilage injuries and without osteoarthritis. 1,12,13,22 OCA transplantation is also used as a salvage procedure after failed prior cartilage surgery and represents the most successful revision treatment for large OCD lesions. 15,16 Overall, long-term outcomes after OCA transplantation demonstrate clinical improvement and sustained clinical benefit in up to 75% of patients at >12 years after surgery. 2 A primary benefit of OCA transplantation relative to alternative biologic therapies for cartilage restoration includes the transplantation of structurally intact hyaline cartilage and associated subchondral bone, making it suited for larger cartilage lesions and deeper osteochondral defects with altered subchondral bone architecture.
In contrast to cartilage restoration techniques that contain only a cartilaginous tissue layer such as autologous chondrocyte implantation, OCA transplantation affords osseous integration at the host and donor interface via primary bone remodeling and creeping substitution, which then provides a stable base for the overlying cartilage. 25 Tissue healing and integration can be evaluated at follow-up using histologic techniques, but noninvasive imaging modalities are preferable, as second-look arthroscopy and tissue biopsy carry associated risks and are not practical in routine clinical follow-up. An early study to assess OCA healing on magnetic resonance imaging (MRI) scans identified persistent subchondral edema and fissuring at the bone interface in the majority of patients at various time points between 6 and 36 months postoperatively. 24 Quantitative MRI techniques, including delayed gadolinium-enhanced MRI of cartilage (dGEMRIC) and T2 mapping to quantify proteoglycan and collagen content, respectively, have been used to characterize the morphology of allograft cartilage relative to host tissue, but these modalities allow limited assessment of the osseous phase. 5 The Osteochondral Allograft MRI Scoring System (OCAMRISS) was developed and validated as an objective measure to evaluate OCA transplantation postoperatively with respect to cartilage, bone, and joint features. 7,20 The bone features of this scoring system are binary variables and capture a limited set of data with which to assess osseous healing and integration in 3 dimensions, and there has been no correlation between bone features and clinical outcomes to date. 20,23 As osseous integration of press-fit allografts occurs through primary bone healing, computed tomography (CT) represents a promising modality by which to assess integration at the graft-host interface. To date, studies have shown that grafts within the weightbearing portions of the femoral condyle had greater integration with surrounding bone than nonweightbearing grafts had at the 6-month follow-up 4 and a majority of patients had at least 50% osseous integration at the 5-month follow-up 9 ; however, no study has correlated CT and clinical outcomes.
Given the potential limitations of osseous evaluation on current standard MRI sequences because of persistent subchondral bone edema up to 3 years postoperatively and the limited data utilizing CT, the objective of the current study was to develop a CT scoring system to characterize bone integration and bone quality after fresh OCA transplantation and to use the scoring system to evaluate the relationship of OCA bone parameters measured on CT scans with clinical outcomes. We further sought to investigate whether osseous parameters and host-donor bone integration identified on CT scans can be used as a metric of overall fresh OCA healing and whether measures of osseous healing on CT scans would be positively correlated with improvements in clinical patient-reported outcomes (PROs).
Methods
Patient Selection
Ethical approval was obtained for this study. After obtaining informed consent, we collected and stored PRO scores in a prospective longitudinal database (SOCRATES; Ortholink). The database was queried, and 118 patients who had undergone fresh OCA transplantation in the knee in the primary surgeon’s (D.C.C.) practice between March 2007 and January 2017 were identified. OCA transplantation was indicated in patients with a monopolar, >2.0 cm2, ICRS grade 4 lesion of the medial and/or lateral femoral condyle, trochlea, or patella and with pain and/or dysfunction directly attributable to their knee. Included in the study were patients who underwent OCA transplantation within the study period, provided baseline PRO scores, and underwent a CT scan postoperatively. Patients were excluded if they did not complete PRO measures postoperatively or if the CT scan was not accessible within the institutional image library. Thirty-two patients were excluded from the study, as CT scans were ordered, but not obtained, for unknown reasons. PRO measures included the Knee injury and Osteoarthritis Outcome Score (KOOS), International Knee Documentation Committee (IKDC), and Veterans RAND 12-Item Health Survey (VR-12). Questionnaires were routinely collected at 6 months, 12 months, and annually thereafter either in person during clinical postoperative visits or via a link emailed to the patient directly from the SOCRATES PRO management database. Twenty-six patients were excluded from final evaluation, as they did not complete PRO measures at or beyond the 6-month follow-up postoperatively. A chart review of electronic medical records was conducted to collect patient characteristics and surgical variables for eligible participants.
Surgical Treatment
Surgical treatment and rehabilitation were conducted according to previously published methods. 1 Briefly, fresh OCA tissue was obtained from JRF Ortho. A minimally invasive paramedial or lateral arthrotomy without patellar eversion was performed based on the location of the defect. The size and extent of the pathological tissue were measured. After debridement and host site preparation, a previously described press-fit fixation technique was used for OCA transplantation. 24 Patients were allowed to bear weight as tolerated in a hinged knee brace locked in extension immediately postoperatively. A femoral nerve block was used for postoperative pain management. Patients gradually progressed to full weightbearing using crutches in the first week after surgery as quadriceps strength improved. Patients were allowed unrestricted active and passive range of motion when not bearing weight. Patients began formal physical therapy on the operative day with a session before discharge. Patients continued formal physical therapy using an individualized regimen for 6 to 8 months, subsequently decreasing frequency based on progression. Return to sports or full activity without restriction was assessed between 4 and 6 months postoperatively based on individual progression with physical therapy.
CT Parameters
CT scans were collected postoperatively as part of routine clinical practice and ordered to coincide with the 4- to 6-month follow-up when patients were clinically evaluated for clearance to return to sports and activity. A CT scoring system was created after consensus agreement of relevant parameters among 2 fellowship-trained sports medicine orthopaedic surgeons with extensive experience performing OCA transplantation (S.A.R., D.C.C.), 2 fellowship-trained musculoskeletal radiologists (E.A.B., S.R.S.), and 1 orthopaedic surgery resident (D.E.A.). The scoring system was intended to reflect the range of physiologic and pathologic features of osseous healing identified via preliminary review of a randomly selected set of 10 CT scans from the study population.
CT parameters are shown in Figure 1 and included the following: (1) quartile percentage (0%-25%, 26%-50%, 51%-75%, 76%-100%) of bone incorporation at a total of 6 cross-sectional surfaces of the graft-host interface in the coronal, sagittal, and axial planes; (2) average of 5 bone density point measurements (Hounsfield units) taken equidistant from the bone interface for both the graft and the host; (3) subchondral bone congruency measured as the greatest distance offset (millimeters) between the graft and host bone at the interface edges in the sagittal or coronal plane; (4) an objective 3-point scale for cystic changes according to the size of the largest cyst (0 = none, 1 = <1 mm, 2 = 1-3 mm, 3 = >3 mm); and (5) a subjective 3-point scale to score the amount of sclerosis at the bone interface (0 = none, 1 = mild, 2 = moderate, 3 = severe). Cartilage features of the allograft and host joint surface were not reliably measured on CT soft tissue windows on preliminary review, so only osseous parameters were included in the scoring system. Inter- and intrarater reliability testing was performed by the calculating intraclass correlation coefficient using an analysis of variance estimator of a 2-way random-effects model of absolute agreement based on single measures for the scores of 30 randomly selected CT scans independently scored by 2 blinded musculoskeletal radiologists (E.A.B., S.R.S.), 1 of whom scored all CT scans for further analysis. Reliability was rated as poor (<0.33), moderate (0.33 to 0.67), and strong (>0.67) based on correlation coefficient.

Representation of computed tomography (CT) scoring parameters used to characterize osseous healing after osteochondral allograft (OCA) transplantation. (A) Coronal, sagittal, and axial CT scans from a patient after OCA transplantation were used to develop (B) schematics for standardization of CT evaluation for the following parameters: bone incorporation, bone density, surface congruency, cystic changes, and sclerosis. HU, Hounsfield units.
CT parameters were subsequently summarized into a single index score per domain as follows: arithmetic mean of the 6 reported quartiles, rounded and rescaled, for bone incorporation; arithmetic mean of the 5 graft bone density measurements; arithmetic mean of the 5 host bone density measurements; arithmetic mean of millimeter offset from flush (0) with depressed as negative and proud as positive for subchondral bone congruency; and arithmetic mean of two 4-point values for cystic change.
Statistical and Data Analysis
Statistical analysis was performed using Stata Version 14 (StataCorp LLC). Sample means and standard deviations (SDs) were calculated for patient characteristics and surgical variables. A Student t test was used to compare continuous variables from the final study population with those from patients who were lost to follow-up, with statistical significance set at P < .05. Sample means, SDs, and 95% confidence intervals were calculated for PROs at baseline, final follow-up, and change from baseline.
CT parameter scores for individual patients were compared with a typical profile appearing in the data by calculating a Mahalanobis distance, 14 a unitless and scale-invariant measure of the separation between a data point and the center of a group of data points with respect to multiple variables—in this case, the CT parameter domains. A linear regression was fit for each CT parameter based on all clinical factors jointly, including age, sex, body mass index (BMI), lesion size, history of prior surgery, number of grafts, and lesion site, further adjusting for the logarithm of the time elapsed between surgery and the CT scan in order to mitigate time confounding in the CT parameter scores.
Differences in PROs between baseline assessment and the final follow-up for individual patients were compared using a paired Student t test, and the Glass delta effect size was calculated as the mean difference divided by the baseline SD. To estimate the correlations between CT parameter scores and change in individual PRO scores from baseline to the final follow-up, a structural equation modeling (SEM) framework was carried out using full-information maximum likelihood estimation to accommodate rare missing values for PRO scores under the missing-at-random assumption, which was validated using the missing completely at random test of Little. 17 For each CT parameter score, the SEM was fit separately to each PRO scale and accounted for the following: time between surgery and CT, time between CT and final follow-up, influence of patient characteristics (age, sex, BMI, history of prior surgery, lesion size) on change in PRO from baseline to the final follow-up, and possible residual covariance between baseline individual PROs and individual CT parameters. A simple Spearman correlation between the PRO change and the CT parameter without any adjustments was also calculated as a baseline comparison for assessing model sensitivity.
The correlation between individual CT parameter scores and individual PRO values at the assessment collected closest in time to the CT scan (within 3 months) was also assessed in a cross-sectional analysis. This correlation quantified the calibration between the CT parameters and the PRO scales. If the CT parameters were sensitive to movement in the PRO values, this relationship would be reflected in the cross-sectional association, assuming no confounding. The chosen PRO values were then adjusted for the time offset (either positive or negative) between the PRO assessment and the CT scan using a linear crossed random-effects model (patients crossed with PROs) with the time offset treated as a fixed effect. Residuals from this model were correlated with each PRO using the Spearman correlation. Finally, the Zellner 26 method of seemingly unrelated regression was used to fit the adjustment models and look for residual correlation between PRO change, graft bone density, and host bone density simultaneously.
Results
Of 118 patients who underwent OCA transplantation by the primary surgeon (D.C.C.) over the study period, 60 were included in the final cohort, and 58 were lost to follow-up, including 32 without a CT scan and 26 without postoperative PROs. The mean and SD for time to final follow-up (defined as last collected set of PROs) was 38.2 ± 19.9 months, with a minimum of 11.6 months and maximum of 84.9 months. The patient and surgical characteristics of the final study cohort as well as those of patients lost to follow-up are included in Table 1. The population of patients who were lost to follow-up was of statistically significant younger age, included more women, and had fewer revision cases, but there were no other differences noted between the cohorts studied and lost to follow-up. For the final study population, the mean lesion size was 5.1 cm2, and all lesions were ICRS grade 4 after surgical debridement. Thirty patients (50%) had at least 1 concomitant procedure during the index operation (Table A1). Of note, 82% of patients had a prior failed surgery to address the cartilage defect, and 3% of patients experienced a graft failure, defined as any subsequent surgery to revise or remove the allograft, including conversion to total knee arthroplasty (Table A2). The majority of patients had pathology secondary to OCD of the femoral condyles. Lesions that were large enough to require multiple adjacent grafts were located on the medial femoral condyle more often than on the lateral femoral condyle. A total of 73 grafts were used in 60 patients, including adjacent grafts on a single condyle or single grafts at multiple lesion locations for an individual patient (Table 2).
Surgical and Characteristic Variables for Patients Included in the Final Analysis and for Patients Considered Lost to Follow-up a

a Data are reported as mean ± SD (range) unless otherwise indicated. Bolded P value indicates a statistically significant difference between groups (P < .05). BMI, body mass index; NA, not applicable.
b Patients who underwent osteochondral allograft transplantation during the study period but did not have computed tomography scans or complete patient-reported outcomes postoperatively.
c n = 15 patients.
d n = 58 patients.
Cartilage Lesion Characteristics: Mechanism of Osteochondral Injury, Lesion Location, and Number of Grafts Used (N = 60 Patients, 73 Grafts) a
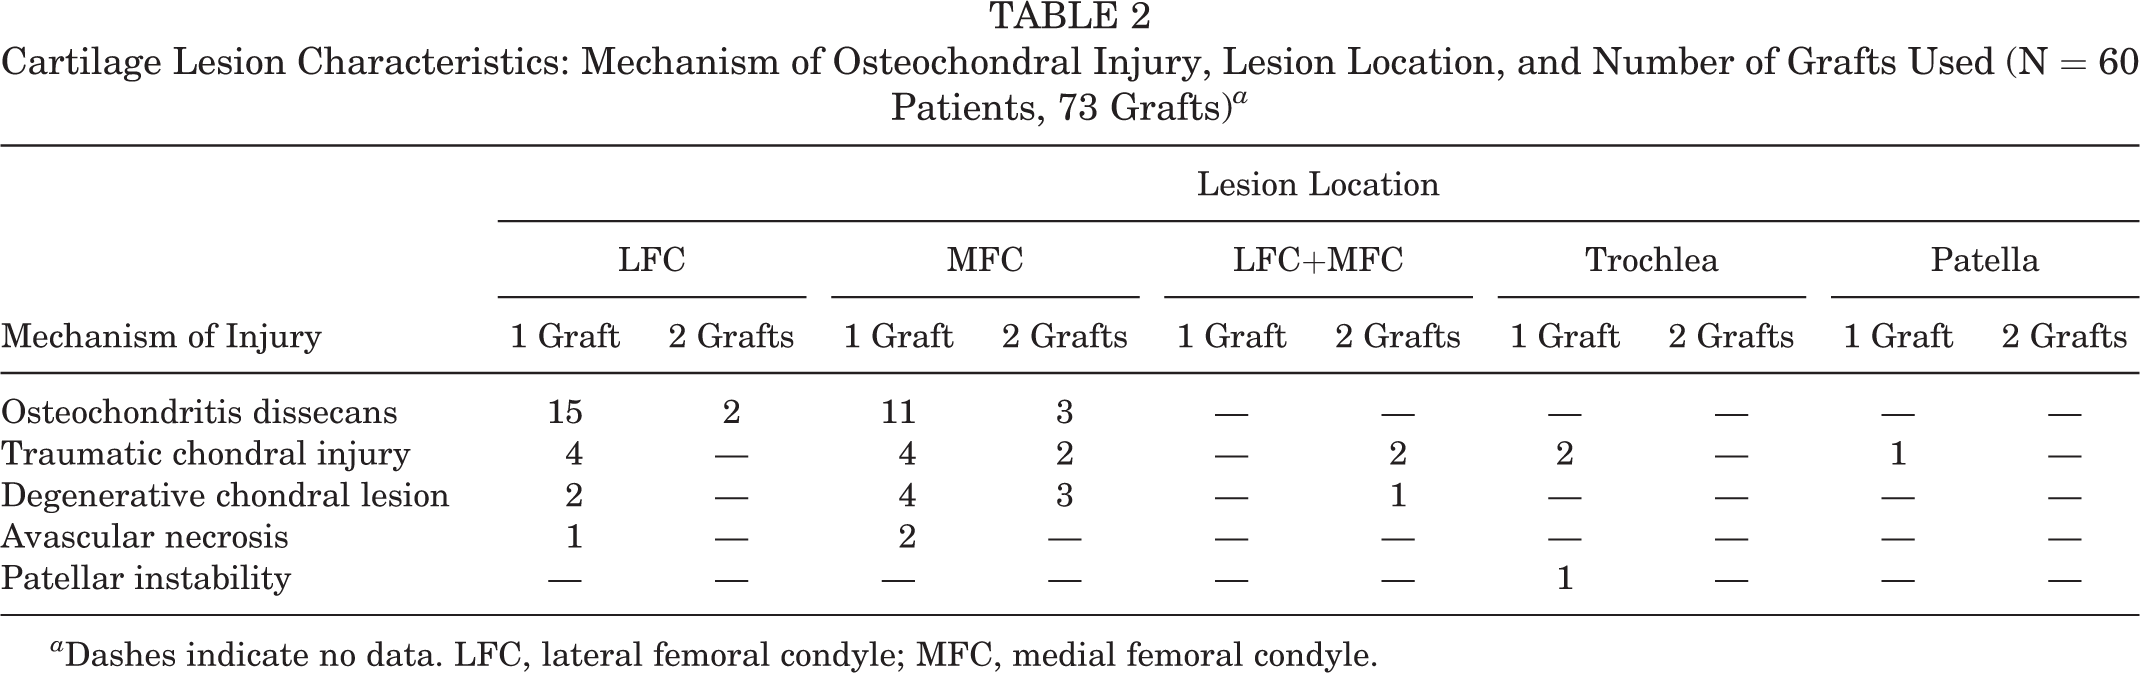
a Dashes indicate no data. LFC, lateral femoral condyle; MFC, medial femoral condyle.
CT scans were collected at a mean (± SD) of 5.8 ± 1.9 months after surgery, with a minimum of 2.7 months and a maximum of 17.3 months postoperatively. The interval between acquisition of the CT scan and the most closely collected set of PROs for 43 patients, who reported PROs within a defined 3-month margin on either side of the CT, was a mean (± SD) of 0.4 ± 0.7 months; PROs were often collected on the same day or week as was the CT scan and rarely occurred with >1 month offset.
When assessed for intrarater reliability, scoring of CT parameters on subsequent reads by a single blinded reader showed moderate to strong reliability across all parameters (Table 3). There was strong interrater reliability for bone incorporation and moderate interrater reliability for cystic change. There was moderate to poor interrater reliability between independent readers for scores that relied on a discrete quantitative measure (surface congruency, bone density) taken at random points within cross-sectional CT scans. This persisted for density measurements despite taking the average of 5 random points within the cross sections. A negative correlation existed between subjective assessments of sclerotic changes between readers; thus, sclerosis was not included in further analysis.
Summary of Inter- and Intrarater Reliability a
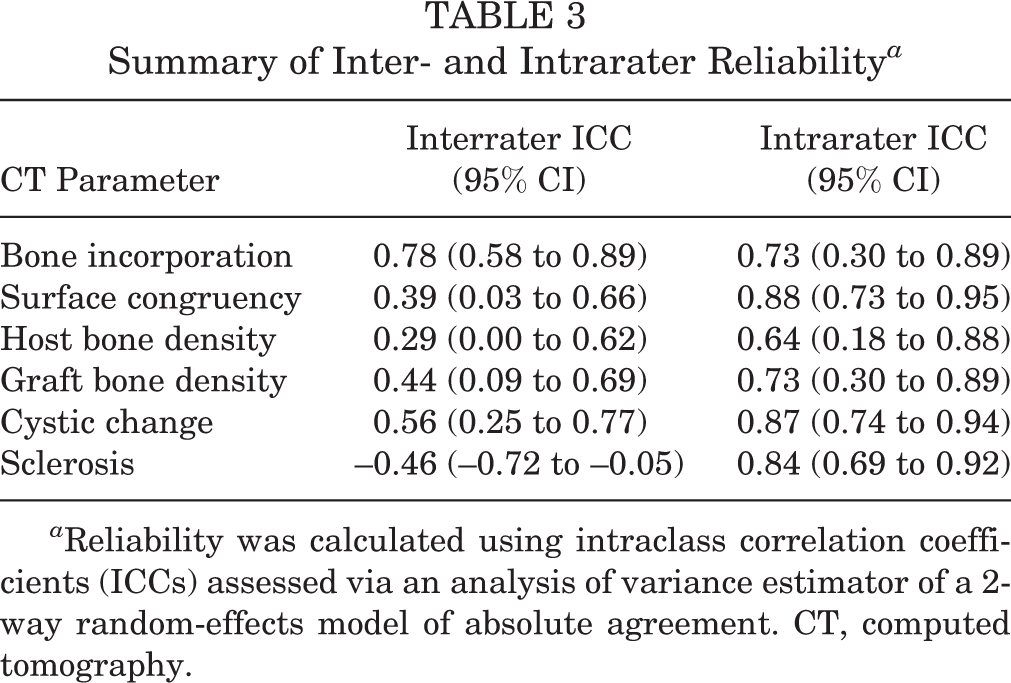
a Reliability was calculated using intraclass correlation coefficients (ICCs) assessed via an analysis of variance estimator of a 2-way random-effects model of absolute agreement. CT, computed tomography.
When using Mahalanobis distance to summarize the CT parameters for individual patients relative to the cohort, accounting for covariance patterns, the joint distribution of CT parameters showed a close fit to the theoretical multivariate normal distribution (Figure 2). Observations >1 SD on either side of the mean were consistent with the predicted theoretical distribution: 12.3% above the SD versus the predicted 14.8% and 12.3% below the SD versus the predicted 12.9%. This finding suggested that the CT parameters were not confounded by clinical or patient heterogeneities in the cohort that were not relevant to the CT measurements themselves.

(A) Theoretical expected and observed distribution of composite computed tomography (CT) score parameters based on the modeling of Mahalanobis distances with chi-square distribution. (B) Observed variance (mean ± SD) of individual Mahalanobis distance for individual CT scans relative to the cohort.
To further assess for confounding, a linear regression of each CT parameter and overall Mahalanobis distance was performed against each clinical factor with adjustment for the logarithm of the time elapsed between surgery and the CT scan. Overall, standard errors for effect size estimates from these regressions tended to be as large as or larger than the effect sizes themselves. For example, there was a trend of a 2% increase in host bone density score per decade of age, but the standard error was 2.9%, which indicated a lack of predictability of the bone density ratio in the graft just from patient age. Similar findings obtained for all other clinical and patient factors suggested that the CT scores represent an unbiased and generalizable metric for evaluating postsurgical healing.
The average values for CT variables for each implanted graft (n = 73) are reported in Table 4. When averaged over the cohort, bone incorporation was approximately 50% to 75% across all surfaces in the sagittal, coronal, and axial planes. There was a wide range for quantitative host and graft density measurements as well as for offset between the host and graft subchondral bone surfaces, with an average 0.22-mm depression and 1.22-mm SD of either further depression or proud graft surface. There were cystic changes noted in a majority of patients, but the cysts were small (<1 mm) on average.
Summary of CT Parameters (N = 60 Patients, 73 Scans) a
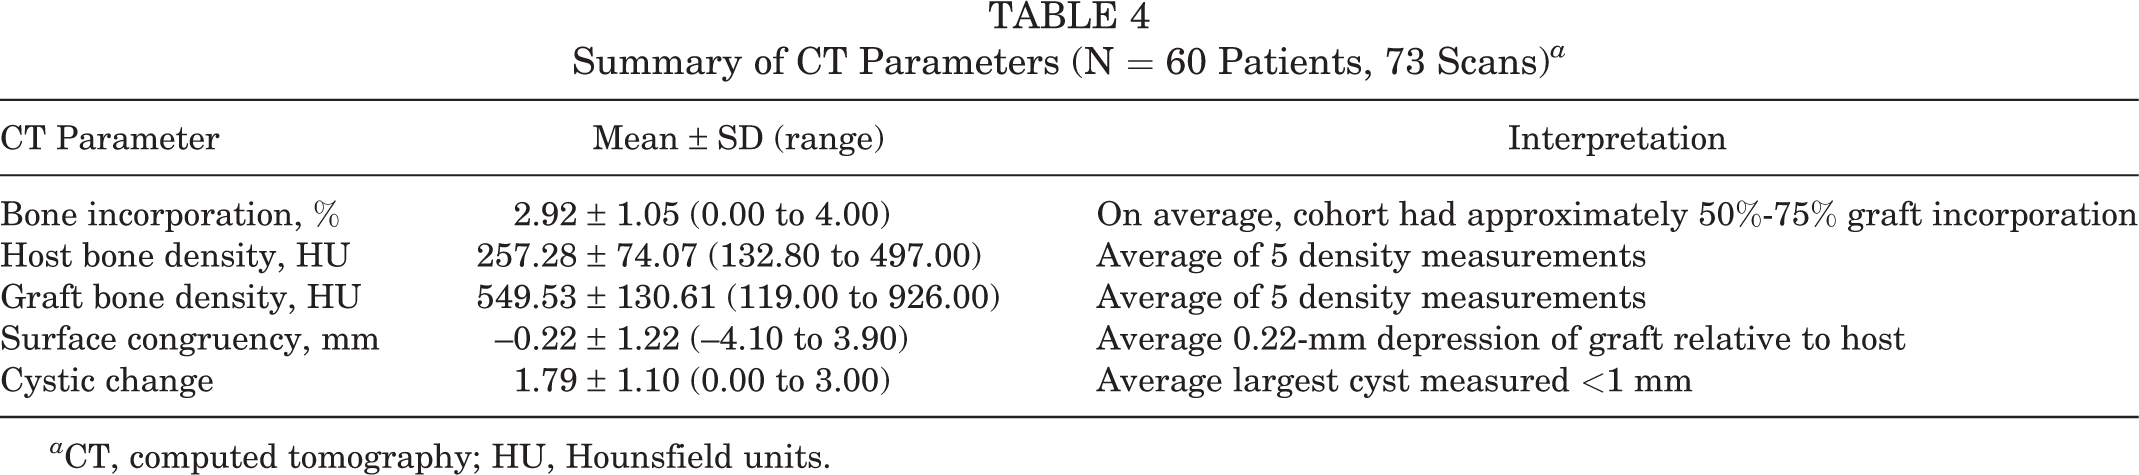
a CT, computed tomography; HU, Hounsfield units.
There was a statistically significant improvement with large effect sizes for all PROs from baseline to final follow-up, aside from the VR-12 mental component scores (Table 5). When adjusted in a multivariate model, age, sex, BMI, prior history of surgery, and lesion size had negligible influence on PRO change, such that all patients in the cohort tended to improve regardless of history. There were no significant correlations between any combination of individual CT parameters collected 6 months postoperatively and change in PRO from baseline to final follow-up (Table 6). Similarly, there were no correlations between individual CT parameters and change in PRO values from the assessment most closely collected (within 3 months) to the CT scan to final follow-up. There was, however, a uniformly positive association (r = 0.147) of higher host bone density and improved PROs across all outcome measurements as well as a positive residual correlation (r = 0.335) between the host and graft density values, even after adjusting for patient characteristics.
Change in PRO From Baseline to Final Follow-up a

a The number of patients is less than the total cohort (N = 60) because at least 1, but not all, patient-reported outcomes (PROs) may have been completed by an individual at baseline and follow-up. ADL, Activities of Daily Living; IKDC, International Knee Documentation Committee; KOOS, Knee injury and Osteoarthritis Outcome Score; QOL, Quality of Life; VR-12, Veterans RAND 12-Item Health Survey.
b Bolded P values indicate a statistically significant difference between groups (P < .05).
Partial Correlation From Structural Equation Modeling at Final Follow-up a
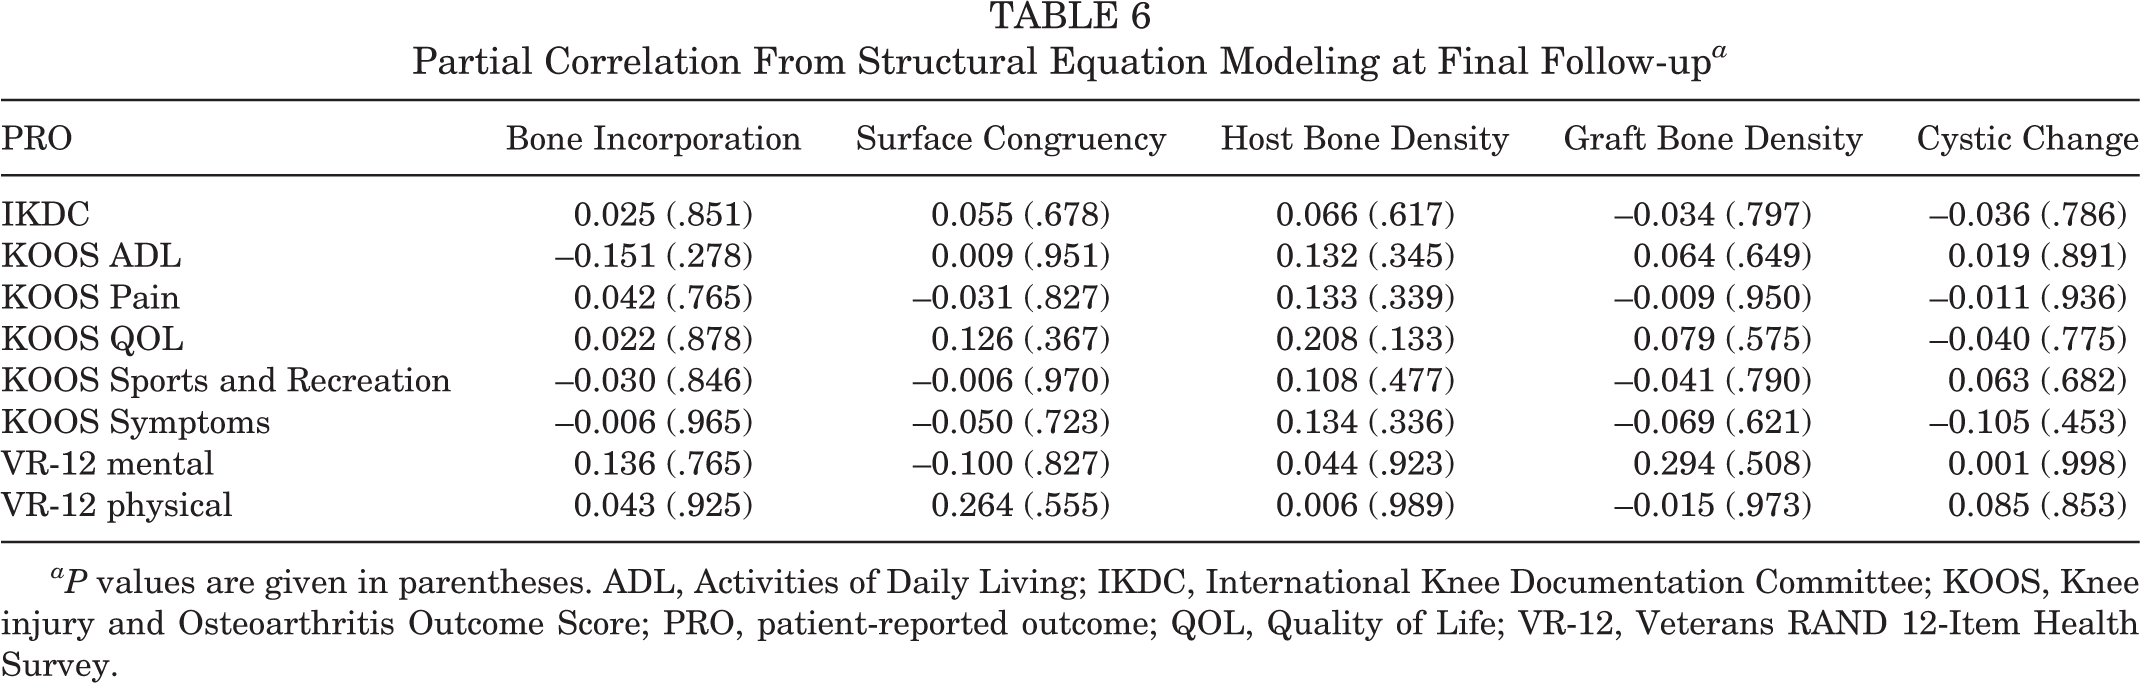
aP values are given in parentheses. ADL, Activities of Daily Living; IKDC, International Knee Documentation Committee; KOOS, Knee injury and Osteoarthritis Outcome Score; PRO, patient-reported outcome; QOL, Quality of Life; VR-12, Veterans RAND 12-Item Health Survey.
Discussion
To our knowledge, this is the first study to develop a comprehensive scoring system to evaluate osseous parameters and host-donor tissue integration after OCA transplantation using CT. The principal finding of this study is the absence of a significant correlation between any combination of CT parameters and changes in PROs, from baseline to both PROs collected closest in time to the CT scan and PROs at the final follow-up. A uniformly positive association between host bone density and change in PROs that was independent of patient and surgical factors was identified. This uniform improvement in PROs with higher host bone density potentially indicates that individuals with less pain and greater function maintain bone density in the postoperative period based on activity level. Alternatively, these patients may have had better preoperative bone quality, potentially reflective of some increased healing ability and therefore reflected in the positive association of bone density and improved PROs postoperatively.
To date, 2 studies have used CT after OCA transplantation to evaluate tissue integration. Brown et al 4 obtained CT scans 6 months after OCA transplantation for 30 patients and reported that grafts within the weightbearing portions of the femoral condyle had greater integration with surrounding bone than did nonweightbearing grafts closer to the posterior condyle; however, correlation with clinical outcomes was not examined. Cook et al 9 obtained a CT arthrogram at an average of 5 months postoperatively for 18 military patients who underwent OCA transplantation, and they created a grading system with which to evaluate both bone integration and cartilage congruency based on contrast distribution. The majority of patients had grade 1 (complete bone integration and flush articular surfaces) or 2 (bone cyst or defect <2 mm and single articular cartilage fissure without obvious defect) bone integration and cartilage congruency, but these changes did not predict and were not correlated with return to active duty. These 2 studies demonstrated that osseous integration can be evaluated using CT, but they did not further investigate how radiographic outcomes relate to clinical outcomes.
The current study builds on the current literature by both expanding the scope of CT evaluation to include additional parameters of osseous healing with statistical evaluation to assess the relationship of patient and surgical variables on CT parameters and correlating each CT parameter with each PRO. The covariance of CT scan parameter values in the cohort suggests that the parameters are inclusive of the range of scores from a patient population. Further, variance of the identified CT parameters was independent of all tested patient and surgical variables, indicating that bone features are more representative of surgical pathology and intervention than of individual bone quality for a cohort of relatively young and active patients. Together, these results suggest that the identified parameters are relevant radiographic parameters after OCA transplantation such that individual observations may be compared with the overall cohort.
The CT parameters in the current study were chosen, in part, based on previously reported findings from postsurgical tissue analysis. Pallante-Kichura et al 21 reported that bone pathology, specifically cyst formation, results from disrupted mechanobiology via subchondral bone remodeling and subsequent bone resorption at the host-graft interface and leads to subsequent overlying cartilage deterioration. Historically, evaluation of cartilage restoration techniques including microfracture, autologous chondrocyte implantation, and osteochondral tissue (allograft and autograft) has focused on the integration, quality, and congruency of the subchondral bone. For OCA, histologic analysis of failed retrieved specimens more often showed subchondral thickening than osteonecrosis and collapse. 25 In the current study, the congruency between donor and host subchondral bone was –0.22 ± 1.22 mm, but congruency was not correlated with PROs. A mismatch in congruency of the subchondral surface most likely results from differences in cartilage thickness between the donor and host, as the allograft is placed flush at the articular surface. The presence of cysts at the host-donor interface also was not correlated with PROs; however, evaluation at 6 months postoperatively may be too early to see the effects. Cystic change is more representative of late failure, and a serial CT scan obtained at a later follow-up interval for this cohort may be useful in evaluating changes in bone morphology over time.
At the overall bone interface, OCA transplantation relies on a tight press fit between the host and donor bone to minimize micromotion at the interface. Given the relative lack of microscopic surgical precision of the press-fit technique, bone healing and remodeling at the graft-host interface likely represent a combination of contact and gap healing based on the relative distance and local strain environment between the surfaces in 3 dimensions. 18 Histologic analysis after OCA has shown that the donor bone is remodeled to native bone via creeping substitution after initial integration at the interface. 25 In the present study, there was no correlation between overall bone surface integration, which was the most reliable measure, and PROs. A future, and possibly more informative, application of the CT scan may be to establish a level of bone incorporation that is consistent with safe return to full activity. Although we did not address this in our study specifically, bone density is positively correlated with weightbearing activity, 10 and patients with better outcomes may have been more active sooner.
With respect to patient and surgical variables, the study population was similar to previously described cohorts of patients undergoing OCA transplantation included in systematic reviews 2,6 ; the majority were men aged <40 years. Overall, the cohort reported significant improvement in all PROs at the final follow-up, with the exception of the mental component score for the VR-12 survey. VR-12 was underpowered as a result of the low completion rates at the final follow-up relative to the IKDC and KOOS questionnaires. The underlying diagnosis was OCD in the majority of patients. Patients were followed, on average, >3 years postoperatively to assess for clinical and functional improvement based on clinical examination and PROs. The greatest improvements were noted in IKDC, KOOS Sports and Recreation, and KOOS Quality of Life scores, indicating that OCA transplantation has a relatively greater positive effect on functional knee outcomes relative to knee pain and negative symptoms, as previously reported. 1
While this study is the first to evaluate PROs relative to CT parameters, multiple prior studies have evaluated clinical outcomes relative to bone, cartilage, and joint features identified on MRI scans. In a case series of 9 patients, Brown et al 5 used quantitative MRI analysis including dGEMRIC and T2 mapping to quantify the relative differences in glycosaminoglycan and collagen content in donor versus host tissue at 1 and 2 years postoperatively. They reported a variable range of relaxation rates on dGEMRIC; however, the majority of patients had a temporal decrease in the glycosaminoglycan content of the donor cartilage from 1 to 2 years postoperatively as well as overall less glycosaminoglycan in the donor tissue compared with surrounding control cartilage at 2 years postoperatively. This relative difference was significantly correlated with improvements in IKDC and all KOOS subdomains aside from symptoms at the 1-year follow-up and with KOOS symptoms and ADL subdomains at the 2-year follow-up. T2 mapping revealed retention of zonal stratification of cartilage in donor tissues but disorganized tissue at the donor-host interface at the 1- and 2-year postoperative evaluations. This study offered informative preliminary evidence of cartilage tissue morphology but did not evaluate osseous healing. In 2014, Chang et al 7 described a comprehensive OCAMRISS—including 5 cartilage features, 4 bone features, and 4 ancillary joint features—developed after OCA transplantation in a goat model and validated relative to histologic analysis of cartilage and micro-CT analysis of bone. When OCAMRISS was applied to a cohort of 15 human patients after OCA transplantation, Meric et al 20 reported significant correlation of the OCAMRISS cartilage subscore and overall score with IKDC and the overall score with KOOS Sports and Recreation. There was, however, no correlation with the OCAMRISS bone subscore with IKDC or any KOOS subdomain. In another recent study, Wang et al 23 reported lower bone integration scores on OCAMRISS in patients with graft failure; however, there was no correlation with total OCAMRISS score and other clinical outcomes. When assessed for correlation with individual OCAMRISS score components, Marx Activity, IKDC, and Cincinnati Sports Activity outcome scores were significantly lower in patients with cystic changes in the bone; the 36-Item Short Form Health Survey physical function component score was significantly lower in patients with a persistent cleft between the graft and donor bone. In accordance with an early OCA study that reported persistent subchondral bone edema on MRI scans up to 36 months postoperatively, 24 Wang et al 23 reported that 92.5% of patients had persistent marrow edema and 50% of patients had crossing trabeculae on postoperative MRI scans at the 1-year follow-up. Overall, the bone subscores of OCAMRISS have not been informative of clinical outcomes, similar to the lack of correlation between bone features on CT and PROs in the present study.
A main limitation of this study was loss to follow-up of 58 out of 118 eligible patients because of incomplete CT or PRO data utilized for the retrospective study. While the cohort lost to follow-up was similar to the final study cohort with respect to most patient and surgical variables, it was significantly younger, which may influence bone quality and healing on CT scans. Since not all patients who underwent OCA transplantation over the study period received the ordered CT scan, we do not know if the study group was fully representative of the spectrum of bone features after OCA transplantation. Similarly, the data for time from graft harvest to implantation were not present in patient records; however, all grafts were known to be implanted within 28 days of harvest based on surgical protocol. Time to graft implantation is primarily of concern for chondrocyte viability, but differences in this variable may be a confounding factor that affects clinical outcomes. With the present methods, there was moderate to poor reliability between discrete quantitative measures, including density and surface congruency, which represents another limitation to subsequent statistical analyses and related conclusions of the current study. Further standardization and training for measurement of these variables may improve reliability in future iterations of a CT scoring system. Another limitation of this study was the inability to assess dynamic changes in bone healing over the total course of follow-up. A single CT scan was obtained close to 6 months postoperatively, yet we expect dynamic bone healing and remodeling up to 3 years after OCA transplantation based on persistent bone marrow edema reported by Williams et al. 24 From this study, we know that osseous parameters on a single CT scan are not correlated with final or most closely collected clinical outcomes, but this does not necessarily indicate that a CT scan obtained at a different time point would not be predictive of clinical outcomes. In comparison with OCAMRISS, the scoring system using CT had 2 major limitations: (1) CT delivers a dose of radiation, and (2) we were unable to assess cartilage features after OCA transplantation with enough resolution for meaningful measurements. This study shows reliable measure of bone incorporation on CT scans, yet further studies may elucidate when and for whom a CT scan is useful. At this time, MRI remains a valuable imaging modality with which to assess overall OCA healing postoperatively. Furthermore, newly developed zero echo time MRI pulse sequences may be promising for the evaluation of bone morphology. 3
Conclusion
The objective of the current study was to develop a CT scoring system to evaluate osseous parameters after OCA transplantation and to assess for correlation between CT parameters and clinical outcomes. Bone integration was the most reliable parameter, and the set of CT parameters were normally distributed across the study population, indicating that they are relevant for assessment of individual osseous healing over time. CT may be useful when applied to individual patients to guide recommendations for progression of rehabilitation and activity after OCA transplantation. A single CT scan obtained 6 months postoperatively, however, is not correlated with, and will not inform, clinical outcomes at 6 months or at final follow-up based on the current study.
Footnotes
Final revision submitted February 2, 2021; accepted February 25, 2021.
One or more of the authors has declared the following potential conflict of interest or source of funding: This study was supported by a grant from JRF Ortho (D.C.C.). E.A.B. has received consulting fees from Pfizer. S.A.R. has received consulting fees from Flexion Therapeutics, nonconsulting fees from Smith & Nephew, honoraria from Fidia Pharma, and royalties from Zimmer Biomet and is a paid associate editor for The American Journal of Sports Medicine. D.C.C. has received honoraria from JRF, consulting fees from DePuy and Arthrosurface, and hospitality payments from Steelhead Surgical. AOSSM checks author disclosures against the Open Payments Database (OPD). AOSSM has not conducted an independent investigation on the OPD and disclaims any liability or responsibility relating thereto.
Ethical approval for this study was obtained from Oregon Health & Science University (study No. 00017947).
Appendix
Reoperations After Index Osteochondral Allograft Transplantation Surgery a
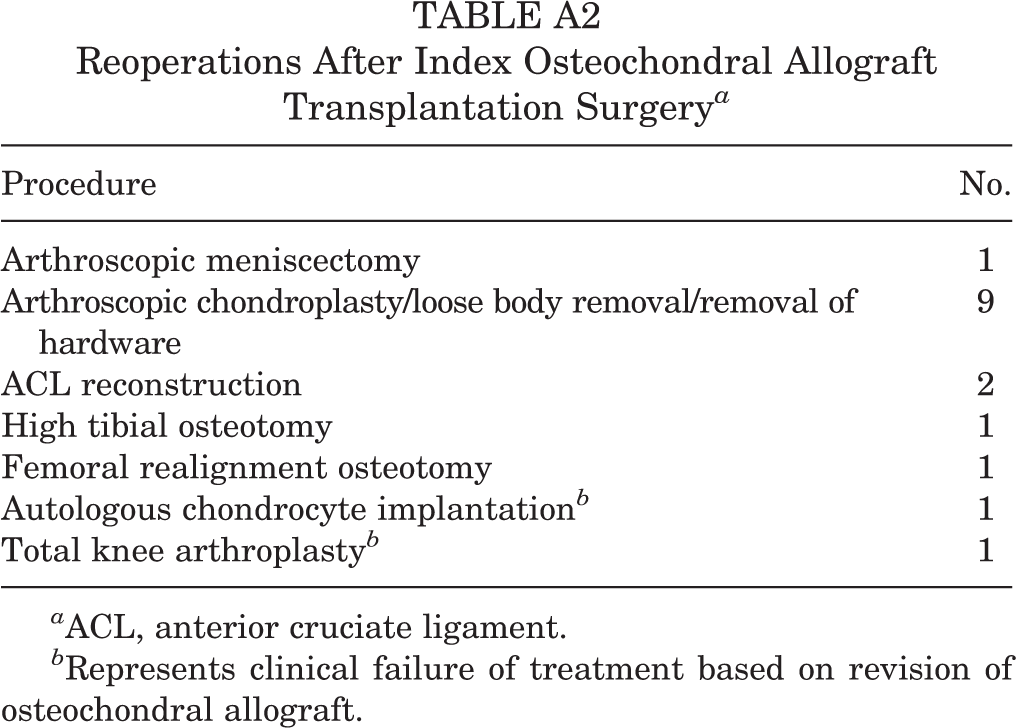
| Procedure | No. |
|---|---|
| Arthroscopic meniscectomy | 1 |
| Arthroscopic chondroplasty/loose body removal/removal of hardware | 9 |
| ACL reconstruction | 2 |
| High tibial osteotomy | 1 |
| Femoral realignment osteotomy | 1 |
| Autologous chondrocyte implantation b | 1 |
| Total knee arthroplasty b | 1 |
a ACL, anterior cruciate ligament.
b Represents clinical failure of treatment based on revision of osteochondral allograft.