
Abstract
Background:
Return to sport (RTS) after anterior cruciate ligament (ACL) reconstruction in children is associated with a much higher risk (∼30%) of subsequent ACL injury than in adults. Most RTS testing protocols use a limb symmetry index (LSI) ≥90% on physical performance tests (PPTs) to assess an athlete’s readiness for sport. This assumes that, in a healthy state, the physical performances across both lower extremities are and should be equal.
Purpose:
To determine the prevalence of limb asymmetries >10% in the uninjured pediatric population on common PPTs as well as to explore the relationship between athlete variables, limb preference, and LSI values.
Study Design:
Cross-sectional study; Level of evidence, 3.
Methods:
This study included healthy volunteers (N = 100) evenly distributed between the ages of 6 and 18 years (mean age, 11.7 ± 3.6 years; 52% female). Participants performed 9 common PPTs. For analysis, we developed a composite score for each limb by averaging trials. We then calculated the LSI for each test. Univariable and multivariable linear regression analyses were performed to assess the relationship between athlete variables (age, sex, height, and weight) and LSI for each PPT.
Results:
Instances of poor baseline limb symmetry (<90% LSI) were common across all PPTs. The single-leg timed hop had the highest percentage of participants, with LSI ≥90% at 73%, while the stork on a Bosu ball had the lowest percentage at 23%. After adjusting for age, female sex showed a significant association with LSI for the stork test (P = .010) and the quadrant hop–counterclockwise (P = .021). Additionally, after adjusting for sex, increasing age showed a significant association with LSI for the stork test (P < .001), single-leg squat on a Bosu ball (P = .010), quadrant hop–clockwise (P = .016), and quadrant hop–counterclockwise (P = .009).
Conclusion:
The majority of healthy athletes 18 years and younger demonstrated significant (<90%) limb asymmetries. Limb symmetry was not consistently affected by participant age or sex, and the effect sizes of these relationships were small. These findings should encourage clinicians and coaches to exercise caution in using the LSI as an isolated measure of RTS readiness after injury in pediatric athletes.
Keywords
Anterior cruciate ligament (ACL) injuries and subsequent reconstructions are increasingly common in the pediatric and adolescent population, at least in part because of increased participation, early sports specialization, and increased willingness to treat these injuries operatively. 11,30 Children return to sport after ACL reconstruction at very high rates (≥90% in most studies). 5,10,19,20 However, they also experience high rates of second ACL injuries, with multiple studies showing a combined risk to the ACL graft and contralateral ACL of between 25% and 35%. 5,10,24,31 Additionally, young athletes who return to sport prior to 9 months have a 7-fold increased risk of a second ACL injury. 2 As a result, there is an urgent need to improve efforts in secondary ACL injury prevention.
One strategy for secondary ACL risk reduction is the use of objective tests for return-to-sport (RTS) decision-making rather than time-based metrics. There is a consensus among experts in the field that objective criteria are preferable; however, there is no agreement on which tests, how many tests, or what thresholds should be used as the gold standard for RTS. 4,7,14,26 Physical performance tests (PPTs) are among the most commonly used objective measures for clinical decision-making and are often interpreted as a limb symmetry index (LSI). The LSI compares the postoperative limb to the uninjured limb for a given PPT. 26 The utility of LSI hinges upon 2 critical assumptions: (1) both limbs are—and should be—symmetrical in a healthy, uninjured state, and (2) performance of the uninjured limb is static over time. The second assumption has already been disproven, in that ACL reconstruction leads to degradation of performance even in the nonoperative limb. 28 We have observed in clinical practice that many children exhibit strong limb preferences, and we therefore questioned the assumption that lower extremity limb symmetry exists among uninjured, healthy children and adolescents.
The primary aim of this study was to determine the prevalence of limb asymmetries >10% in the uninjured pediatric population on common tests of lower extremity physical performance, as this is the most commonly used clinical cutoff. 9 Secondary aims were to (1) explore the relationship between athlete variables and LSI values and (2) determine the level of agreement between self-reported preferred limb and best-performing limb on each PPT.
Methods
Participants
The study protocol was approved by the biomedical institutional review board. We included healthy, uninjured volunteers (N = 100) evenly distributed between 6 and 18 years of age, with the goal of achieving 5 boys and 5 girls of each chronological age (mean age, 11.7 ± 3.6 years; 52% female). Participants were recruited from sports leagues, sports medicine–affiliated clinical locations, and the local community and were required to be actively participating in an organized team activity or individual sport at the time of study participation. Participants were excluded if they exhibited any of the following: (1) prior ligamentous injury to either knee, hip, or ankle; (2) prior spine or lower extremity surgery; (3) any lower extremity injury within the prior 6 months; (4) the inability to participate in neuromuscular testing because of pain or cognitive impairment; (5) ongoing use of any brace or lower extremity orthosis; or (6) any condition or illness that would cause severe shortness of breath with 1 hour of exercise. Before enrollment, written informed consent and assent were obtained from a parent and the participant, respectively, for all participants aged 6 to 17 years, and written informed consent was obtained from all 18-year-old participants.
Data Collection
This study used a prospective, nontherapeutic design. One of 6 licensed physical therapists (J.R.M., H.S.M., L.S.P., M.R.M.) administered all testing sessions. The interrater reliability of lower extremity functional tests, including all of the hop tests included in this protocol, has been previously reported and shown to be excellent in all cases. 15
The testing protocol was designed to include a battery of PPTs that could be administered in any clinical or athletic environment to ensure robust external validity. Before administering the testing protocol, investigators recorded athlete information, including age, height, weight, leg length, primary sport, and self-reported limb preference. To establish self-reported limb preference, each participant was asked 2 questions: (1) “Which leg would you use to kick a ball?” and (2) “Which leg would you jump off of for maximum height?” Since chronological age alone has been demonstrated to be an insufficient metric of development, participants also completed the Pubertal Maturational Observational Scale (PMOS), 8 a validated questionnaire for assessing pubertal maturation.
Testing Protocol
The testing protocol consisted of 9 PPTs commonly used in rehabilitation and RTS testing, including balance, squatting, and hopping tasks. Detailed descriptions of each of these tasks and procedures for testing are outlined in Table 1. This testing battery was originally compiled by Daniel Cooper, MD, and David Surprenant, ATC, of the Carrell Clinic (Dallas, Texas). All participants completed the study protocol in a physical therapy clinic on a firm surface. All tasks were performed bilaterally and in the same consecutive order. However, the task with which each participant started (Nos. 1-9) as well as the extremity tested first (left or right) were randomized a priori using a random number generator. Participants completed 2 trials on each leg for each test with the exception of the single-leg hop tests, which were performed 3 times. To confirm that learning effects did not influence limb symmetry, we assessed the frequency with which the second limb and second trials outperformed the first on all PPTs. For all tests, the second limb or trial did not consistently outperform the initial attempts, suggesting that there is no difference in performance between starting and nonstarting limbs (Appendix Table A1).
Description of Neuromuscular Testing Protocol a
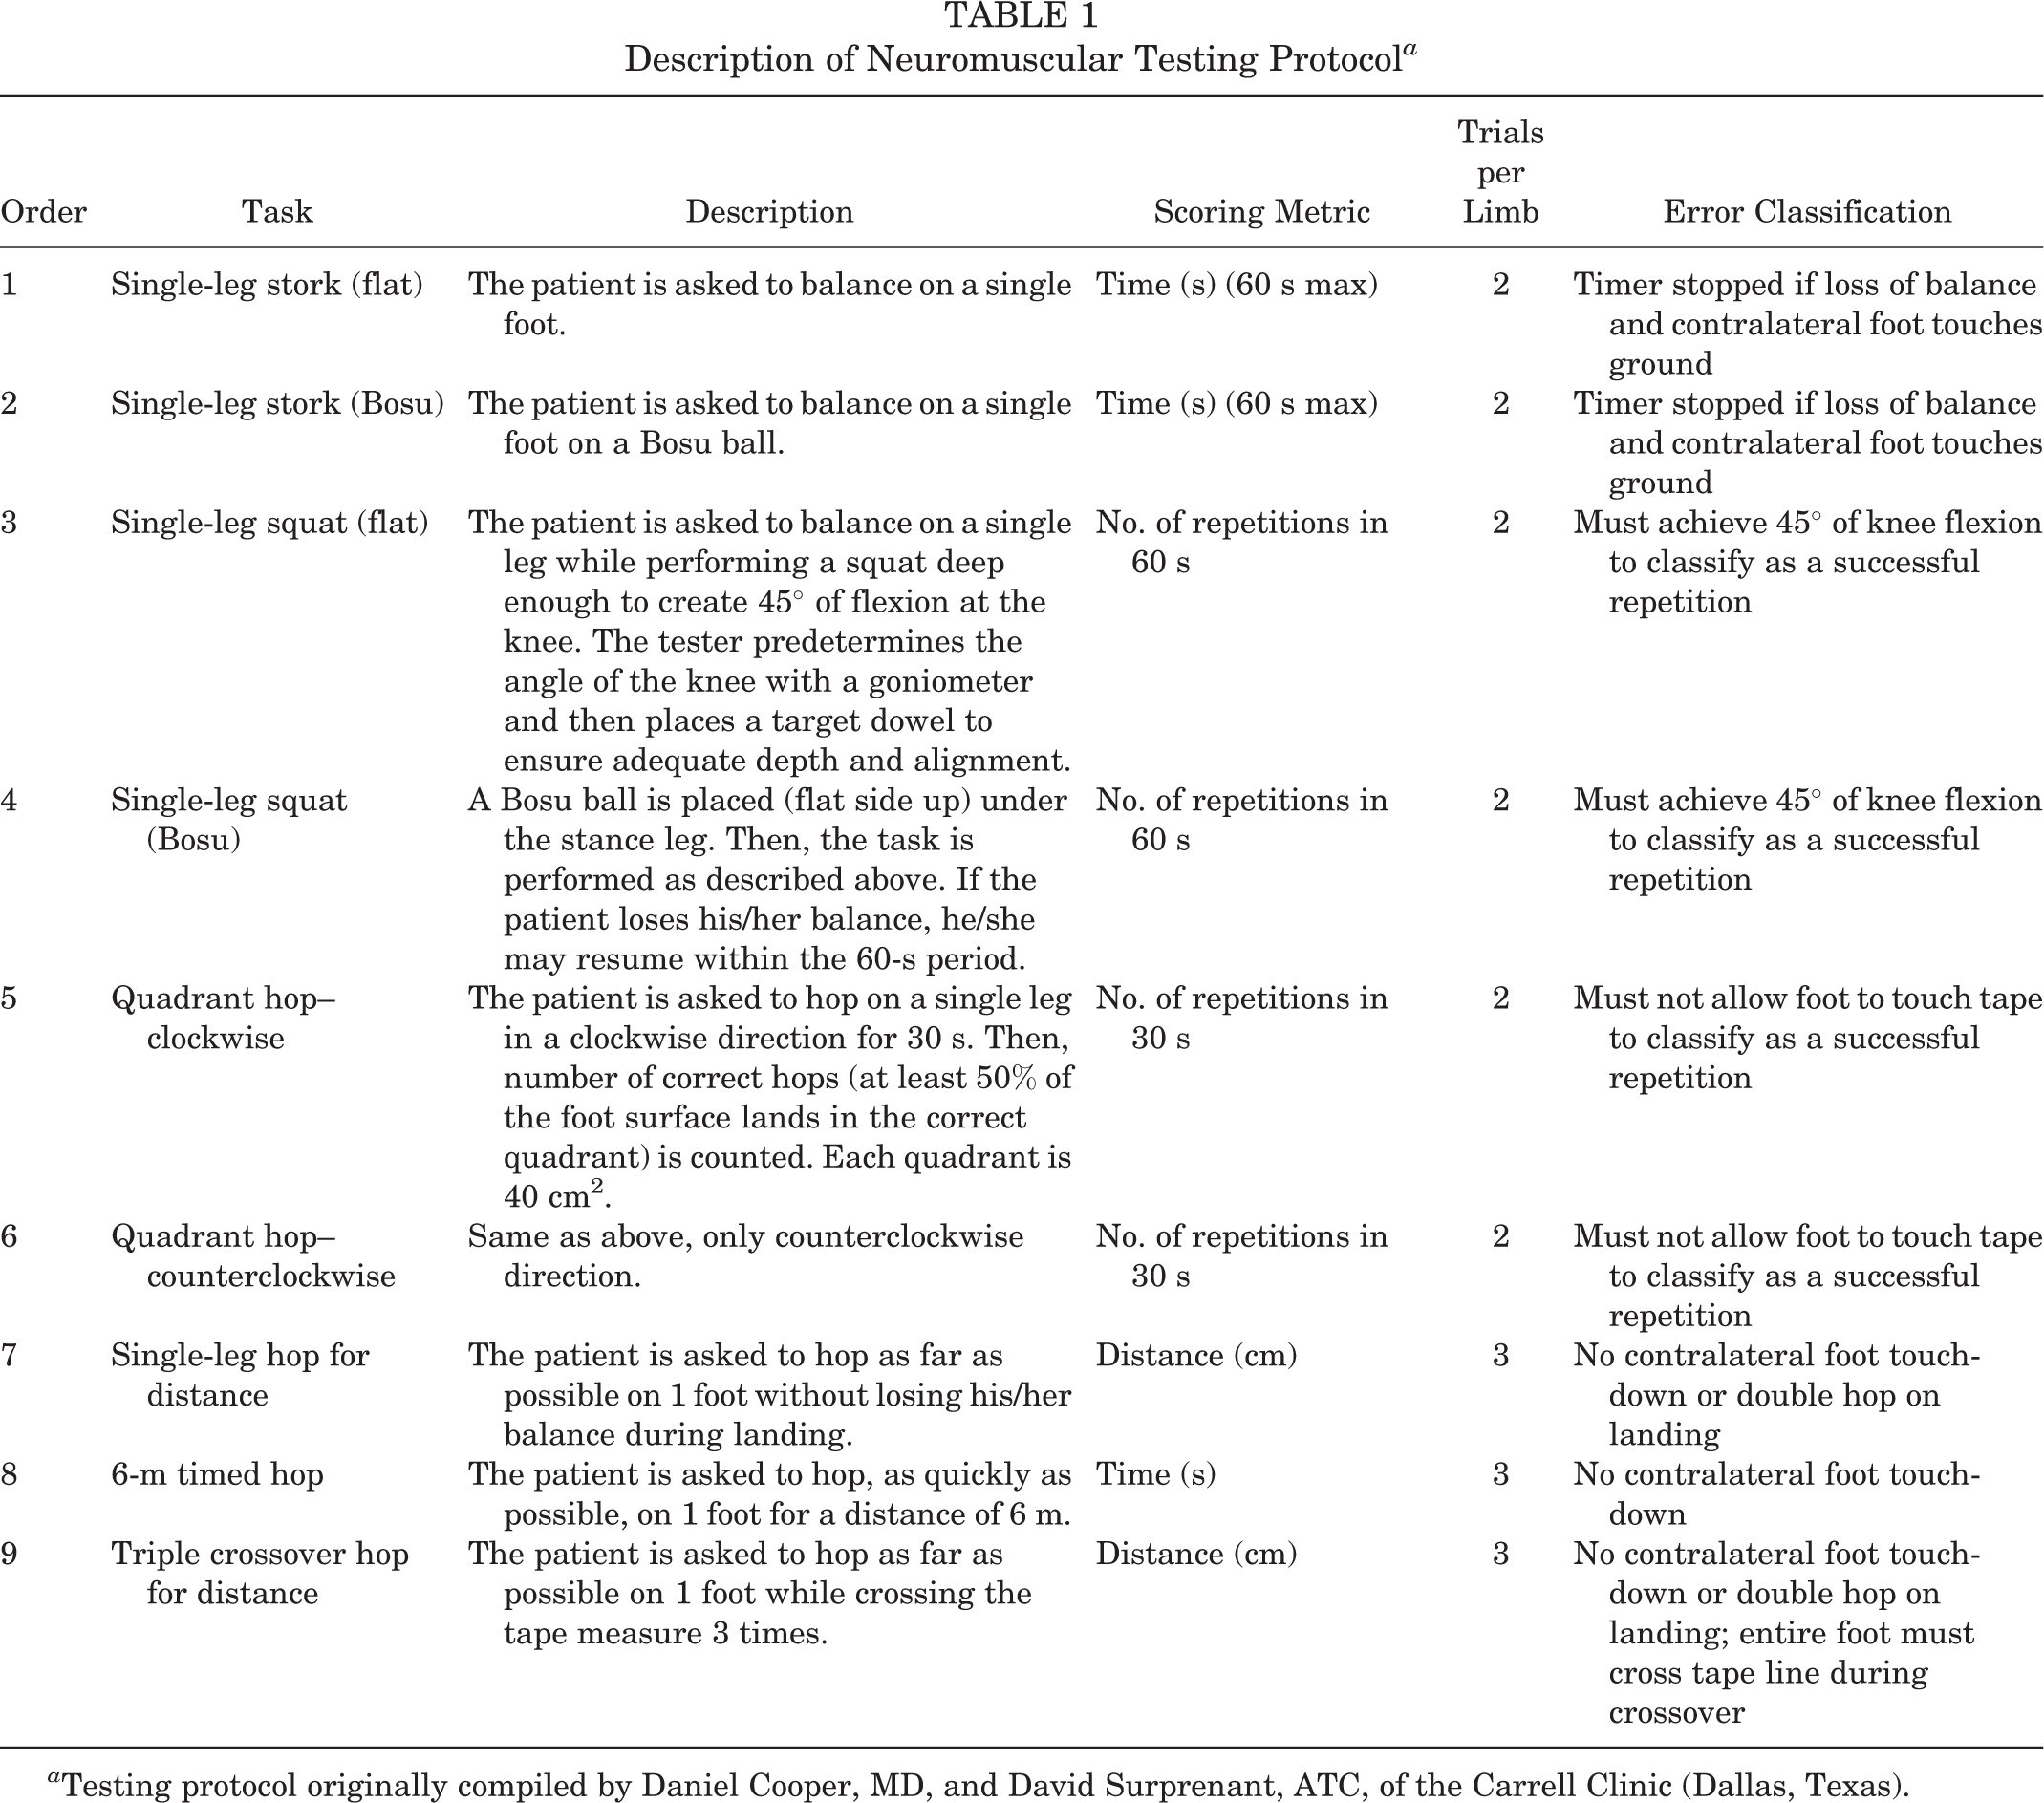
a Testing protocol originally compiled by Daniel Cooper, MD, and David Surprenant, ATC, of the Carrell Clinic (Dallas, Texas).
Self-Reported Limb Dominance
Before testing, each participant answered 2 questions to determine limb preference: (1) “Which leg would you use to kick a ball?” and (2) “Which leg would you jump off of for maximum height?” For each of the PPTs, the limb with the dominant performance (highest value on PPT) was compared with the self-reported preferred limb, to assess how accurately children could predict their dominant limb.
Data Management
We developed a composite score for each test by averaging trials across limbs. This composite score (1 score per participant for each test) was used for analyses. Study data were collected and managed using REDCap (Research Electronic Data Capture) electronic data capture tools hosted by the study institution. REDCap is a secure, web-based platform designed to support data capture for research studies by providing an interface for validated data capture and export of data to common statistical packages.
Assessment of Limb Symmetry
LSI was calculated for each participant on all 9 of the PPTs by determining the sum mean of each limb’s performance and then using the following formula:
Statistical Analysis
Athlete Data
Distribution and frequencies for categorical variables are presented as counts and percentages for nonmissing data, and continuous variables are presented using the mean ± SD, median and 25th (Q1) and 75th (Q3) percentiles, or the range, as appropriate based on data distribution.
A Priori Power Analysis
This study was designed to calculate LSI for all participants and subsequently assess through multivariable analysis whether age, sex, weight, and height were independently associated with LSI. Therefore, we based our required sample size on the recommendation that 10 to 20 participants per variable allows for the optimal assessment of multivariable regression parameters and set out to enroll 100 athletes (20 participants per variable). 1 We also attempted to balance recruitment so that there were 5 boys and 5 girls for each age, as it was our intention to evaluate LSI performance in a sample that represented both males and females across a range of relevant pediatric and adolescent ages. SAS Version 9.4 (SAS Institute) was used for all subsequent data analyses, and P <.05 was considered statistically significant.
Relationship Between Athlete Variables and LSI
We first used univariable linear regression models to assess the relationship between athlete characteristics (sex, age, height, and weight) and the dependent variable (LSI). These analyses were repeated for each of the 9 PPTs, creating a total of 36 univariable regression models. We next planned to use multivariable models to determine which athlete variables were most predictive of LSI for each PPT. However, we found that PMOS, height, and weight were strongly correlated with age (R = 0.86, 0.84, and 0.88, respectively). Therefore, we evaluated only sex and age as independent variables in the multivariable models predicting LSI for each PPT to avoid multicollinearity. All regression models were constructed using robust standard errors to account for heteroskedasticity. For the stork test and stork test on Bosu ball, the lognormal distribution was assumed for the errors due to an observed ceiling effect at a value of 60, while all other models assumed the normal distribution. Model results are presented using the parameter estimates with 95% CIs.
Relationship of Self-Reported Limb Preference and Performance
We compared the athlete’s self-reported limb preference according to the 2 previously referenced questions to the best-performing limb and reported the percentage of individuals that correctly assessed the best-performing limb for each PPT.
Results
A total of 100 healthy pediatric athletes were included in this study. The group was almost evenly distributed between males (n = 48; 48%) and females (n = 52; 52%) as well as across ages (Figure 1). All athlete variables are summarized in Table 2.

Participant age distribution.
Characteristics of the Study Cohort (N = 100) a

a PMOS, Pubertal Maturational Observational Scale.
b Out of 99 participants.
Presence of Baseline Limb Asymmetry
The results of the LSI analysis are shown in Figure 2. Interestingly, for all 9 tests, the percentage of participants that had LSI ≥90% was below 80%; that is, instances of poor limb symmetry (<90% LSI) were common across all PPTs. The single-leg timed hop test had the highest percentage of participants with symmetrical performance (73%), while the stork on Bosu had the lowest percentage (23%).
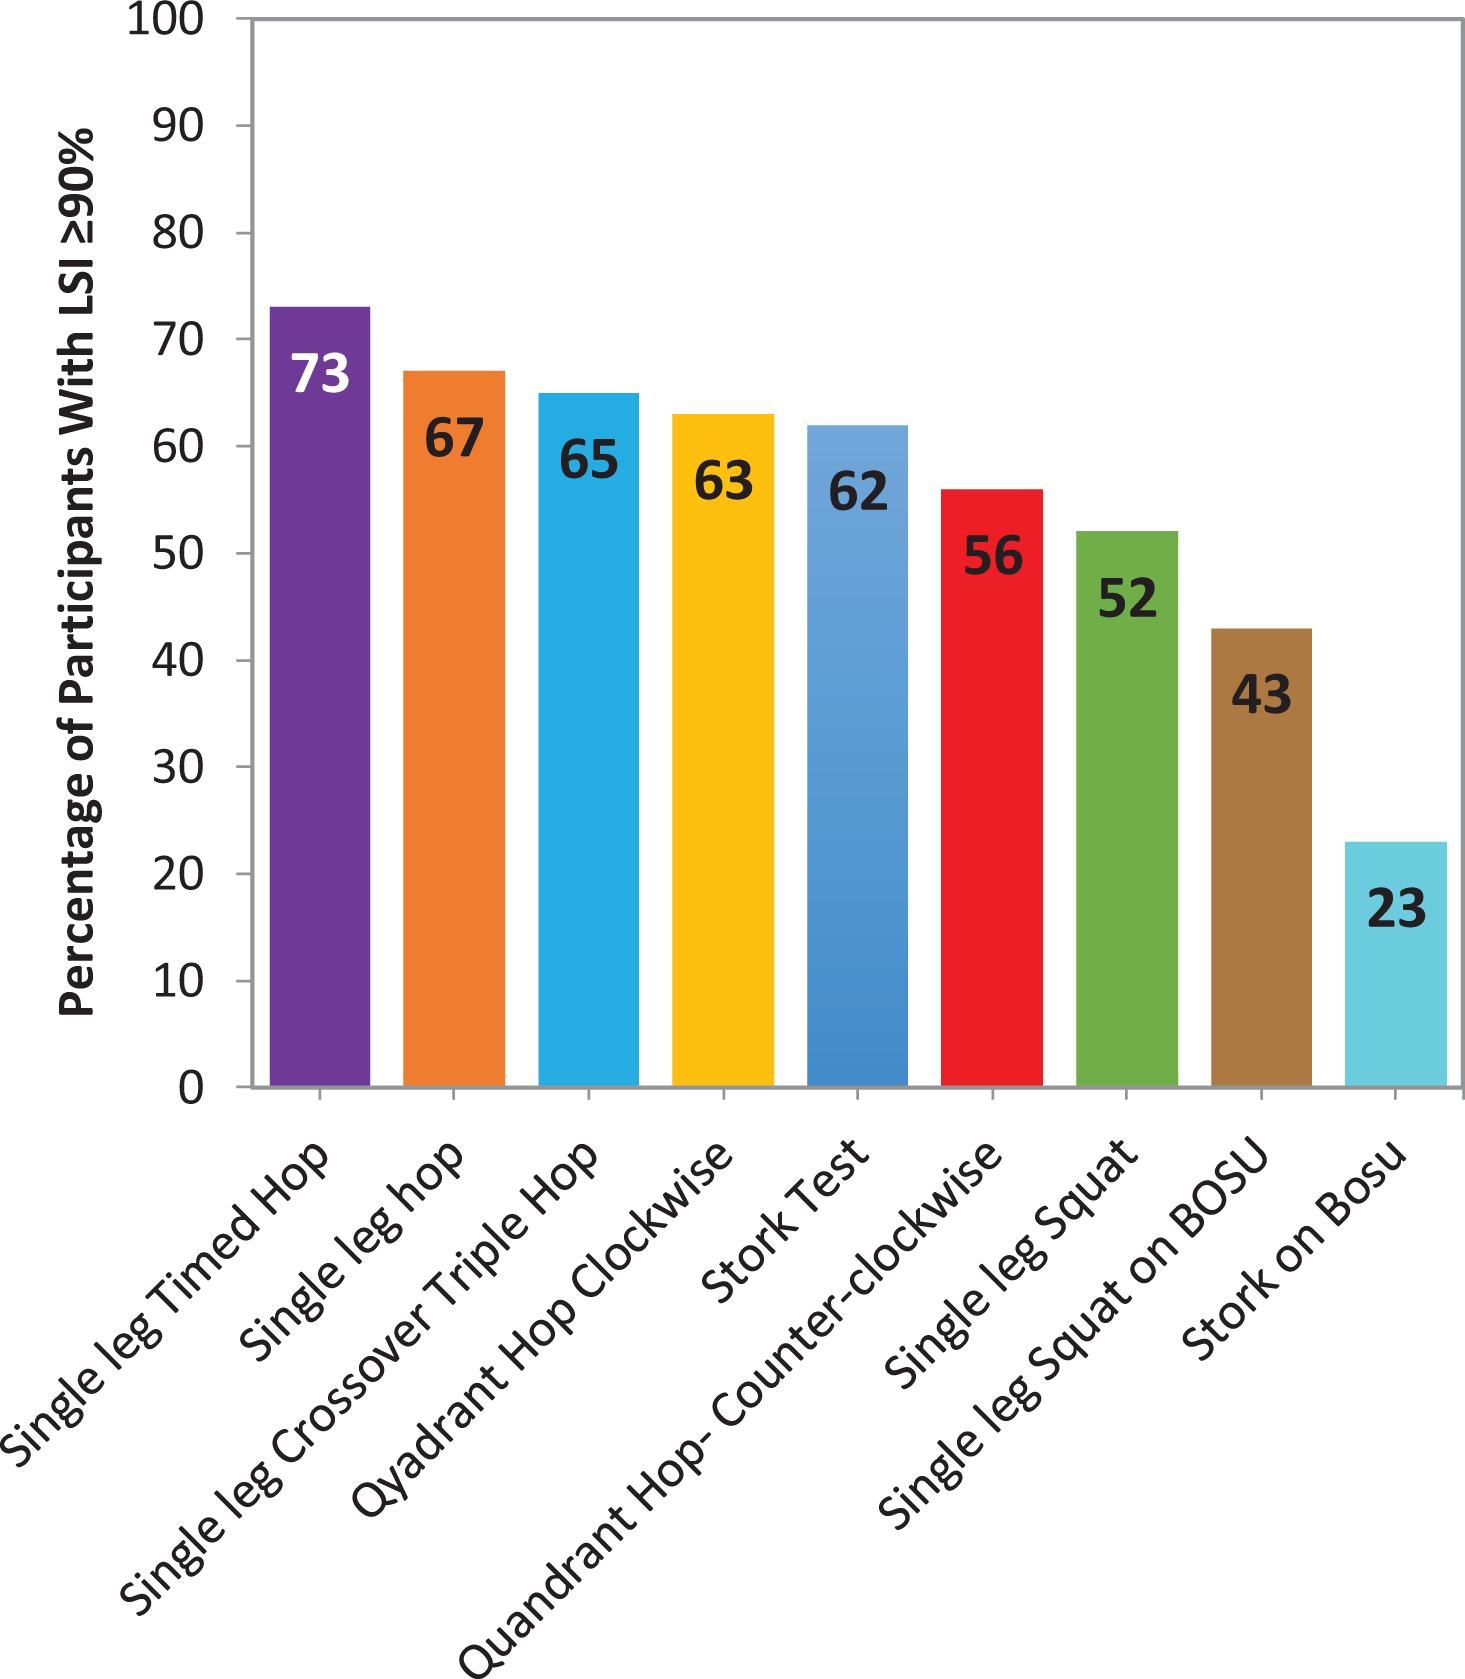
Percentage of participants with limb symmetry index (LSI) ≥90% for each physical performance test.
Association of Limb Symmetry With Athlete Variables
There was a weak association between limb symmetry and athlete variables. The results of the univariable regression models, analyzing the relationship between athlete variables (sex, age, height, and weight) and LSI for each PPT, are shown in Table 3. The results of the multivariable regression models, analyzing the adjusted associations between athlete variables (sex and age) and LSI for each PPT, are shown in Table 4.
Univariable Linear Regression of Characteristics on LSI a

a β, regression parameter estimate; LSI, limb symmetry index.
b Estimate of boys versus girls.
c Lognormal distribution for the errors; all other outcomes assumed normal distribution.
Multivariable Linear Regression of Characteristics on LSI a

a β, regression parameter estimate; LSI, limb symmetry index.
b Estimate of girls versus boys.
c Lognormal distribution for the errors; all other outcomes assumed normal distribution.
Self-Reported Limb Preference
In reporting their limb preference, the participants were unable to reliably identify their dominant limb on PPTs. The preferred kicking leg corresponded to the actual dominant limb in 48% to 68% of the PPTs, and the preferred jumping leg corresponded to the actual dominant limb in 52% to 65% of the PPTs (Figure 3).

Percentage of agreement between self-reported preferred limb and best-performing limb on each physical performance test.
Discussion
The principal finding of this study was that limb asymmetries exist in a high proportion of healthy children and adolescents on common PPTs. Therefore, the utility of LSI as a single metric for PPTs used for RTS decision-making after injury in the pediatric population may not be adequate.
Indeed, we found that for all tests in our battery, only between 23% and 73% of healthy children could achieve the commonly used clinical cutoff of ≥90% LSI. These surprisingly high levels of asymmetry could contribute to why so few children meet RTS criteria that use LSI at 6 to 12 months after ACL reconstruction. 13 Interestingly, we observed that similar tests had similar levels of limb symmetry. For example, 65% to 73% of athletes had an LSI ≥90% on the various hop tests, 56% to 63% of athletes had an LSI ≥90% on the quadrant hop tests, and <45% of athletes had an LSI ≥90% on both tests using a Bosu ball, suggesting that use of an unstable surface accentuates limb asymmetries. It has been previously shown that postural stability on an unstable surface is a strong predictor of ACL reinjury. 25 Coupled with our finding that testing on an unstable surface accentuates limb asymmetry, we believe these tests may have better discriminatory ability for identifying young athletes at high risk for ACL reinjury, and we are currently studying this in a prospective clinical cohort.
Another goal of this study was to understand the relationship between participant characteristics and baseline asymmetry in young athletes. Our first interesting finding was that PMOS scores were almost perfectly correlated with chronological age. Therefore, while we know that chronological age is an imperfect metric of a child’s development, the PMOS appears to add little additional information (from a statistical standpoint) to our understanding of PPT performance in pediatric and adolescent populations. We did observe that for 4 of the 9 tests, increasing age correlated with improved limb symmetry in multivariable analysis. This is consistent with previously published data showing decreases in lower limb asymmetry on other sports-specific tests as children get older. 23,27 However, in keeping with the highest-quality published study on this topic, 27 the effect of age in our study was quite low. Specifically, there was only a 0.8% to 2% change in LSI per 1-year change in chronological age. Therefore, it does appear that asymmetry patterns appear early in childhood and typically persist, with small gradual improvement, on average, over time. 27 There might then be an opportunity to screen children for limb asymmetries as they begin playing sports and to work on addressing these early, as limb asymmetries are known to correlate with decreased athletic performance and increased risk of injury in children. 3,12,26
The effect of sex on limb symmetry was modest and statistically significant in only 2 of the 9 tests (counterclockwise quadrant hop and stork test). Similar to age, the effect was very small, with only a 1% to 4% difference in LSI between sexes. Therefore, while statistically significant, the clinical importance of these differences is minimal. Effectively, our results show that limb symmetry is similar between boys and girls, at least for the PPTs included in this study. The lack of an effect of sex on lower extremity limb symmetry function has been previously reported, corroborating our finding. 21
Critically, our results should not be interpreted as suggesting that limb symmetry is unimportant. Indeed, limb asymmetries at 6 months after ACL reconstruction both in isokinetic strength and on RTS PPTs have been shown to be predictive of patient-reported knee function and successful RTS at 2 years. 16 –18,28 Additionally, it has been suggested that restoration of limb symmetry normalizes soft tissue and ligament loading, contributes to improved walking and running mechanics, and may correlate with a reduced risk of second ACL injury. 22 Rather, our results support the notion that RTS decisions that incorporate limb symmetry in pediatric athletes should also consider 2 key characteristics of performance: (1) limb dominance and (2) preinjury capacity.
With respect to limb dominance, it matters which knee sustains an ACL tear. If the nondominant limb was injured, it would need to exceed its preoperative baseline level of performance to achieve ≥90% LSI. If, conversely, the dominant limb sustained an ACL injury, the injured limb could achieve 90% LSI without achieving its preoperative level of function, since it is being held to the “lower standard” of the nondominant limb. In the latter scenario, it is easy to see how the isolated use of LSI would allow an athlete to RTS before one achieves one’s preinjury level of function. It would therefore be helpful to know at the time of RTS decision-making whether the dominant or nondominant limb was injured. However, our results demonstrate that children and adolescents are not able to accurately self-report which limb is physically dominant. It is also possible that children have a different dominant limb for different tasks. Therefore, the only way to identify the physically dominant limb is through preinjury assessment of bilateral limb function.
The second consideration is the estimated preinjury capacity (EPIC), a measure of PPT performance of the nonoperative leg before ACL reconstruction. 29 This important metric has been described to account for the fact that even the uninjured leg becomes deconditioned after unilateral injury and, as such, may not be a stringent enough “control.” As a result, when LSI is used as an RTS metric, as many as 35% of athletes will be inappropriately assessed as ready for RTS based on meeting 90% LSI, but not 90% of EPIC. 29 Additionally, the use of EPIC as a target for RTS rather than the contralateral limb resulted in an improved ability to predict who would sustain a second ACL injury. 9 Therefore, athletes are assessed based on an underestimation of their preinjury capacity.
The discriminatory abilities of PPTs may be attenuated in young athletes because they often do not consider important contextual characteristics, such as limb dominance or preinjury capacity. This could be one reason that current PPTs poorly predict second ACL injuries in young athletes. 19 It may be possible to obtain a more comprehensive measure of neuromuscular performance and injury risk by integrating information about limb dominance, EPIC, limb symmetry, and age-adjusted PPT benchmarks. To do this effectively, it will be necessary to collect preinjury and/or presurgery data on all athletes, a paradigm that has been widely implemented in the context of concussion management. 6 If preinjury data improve the predictive abilities of PPT, it could lead to a significant change in the structure of preparticipation physicals at the secondary school level, specifically with the inclusion of neuromuscular testing.
This study has several strengths. Internal validity is supported by adequate a priori statistical power, rigorous inclusion and exclusion criteria, the use of a small group of assessors for the entire cohort, and a well-balanced cohort in terms of age and sex. This study is also not without limitations. External validity may be limited by the predominance of soccer athletes (∼50%) in our cohort, the singular geographic location, and the use of a single testing facility and surface.
Conclusion
Healthy athletes under the age of 18 years of age and younger
Footnotes
Final revision submitted April 28, 2020; accepted May 18, 2020.
One or more of the authors has declared the following potential conflict of interest or source of funding: J.C.R. has received consulting fees from Stryker and hospitality payments from Smith & Nephew and Stryker. AOSSM checks author disclosures against the Open Payments Database (OPD). AOSSM has not conducted an independent investigation on the OPD and disclaims any liability or responsibility relating thereto.
Ethical approval for this study was obtained from Duke University Health System (protocol No. Pro00080805).
Appendix
Participants With Higher Performance on Initial Limb

| Initial Limb Higher? | n (%) |
|---|---|
| Stork | |
| No | 30 (30.0) |
| Yes | 20 (20.0) |
| Tied | 50 (50.0) |
| Stork on Bosu | |
| No | 43 (43.0) |
| Yes | 39 (39.0) |
| Tied | 18 (18.0) |
| Single-leg squat | |
| No | 65 (65.0) |
| Yes | 33 (33.0) |
| Tied | 2 (2.0) |
| Single-leg squat on Bosu | |
| No | 56 (56.0) |
| Yes | 37 (37.0) |
| Tied | 7 (7.0) |
| Quadrant hop–clockwise | |
| No | 36 (36.0) |
| Yes | 59 (59.0) |
| Tied | 5 (5.0) |
| Quadrant hop–counterclockwise | |
| No | 36 (36.0) |
| Yes | 61 (61.0) |
| Tied | 3 (3.0) |
| Single-leg hop | |
| No | 59 (59.0) |
| Yes | 40 (40.0) |
| Tied | 1 (1.0) |
| 6-m timed hop | |
| No | 41 (41.0) |
| Yes | 58 (58.0) |
| Tied | 1 (1.0) |
| Triple crossover hop | |
| No | 55 (55.0) |
| Yes | 45 (45.0) |