
Abstract
Background:
Cartilage repair procedures using mesenchymal stem cells (MSCs) can provide superior cartilage regeneration in the medial compartment of the knee joint when high tibial osteotomy (HTO) is performed for varus knee osteoarthritis (OA). However, few studies have reported the factors influencing the outcomes of MSC implantation with concomitant HTO.
Purpose:
To investigate the outcomes of MSC implantation with concomitant HTO and to identify the prognostic factors that are associated with the outcomes.
Study Design:
Case series; Level of evidence, 4.
Methods:
A total of 71 patients (75 knees) were retrospectively evaluated after MSC implantation with concomitant HTO. Clinical and radiological outcomes were evaluated, and magnetic resonance imaging (MRI) was used to assess cartilage regeneration. Statistical analyses were performed to determine the effect of different factors on clinical, radiographic, and MRI outcomes.
Results:
Clinical and radiographic outcomes improved significantly from preoperatively to final follow-up (P < .001 for all), and overall cartilage regeneration was encouraging. Significant correlations were found between clinical and MRI outcomes. However, radiographic outcomes were not significantly correlated with clinical or MRI outcomes. Patient age and number of MSCs showed significant correlations with clinical and MRI outcomes. On multivariate analyses, patient age and number of MSCs showed high prognostic significance with poor clinical outcomes.
Conclusion:
MSC implantation with concomitant HTO provided feasible cartilage regeneration and satisfactory clinical outcomes for patients with varus knee OA. Patient age and number of MSCs were important factors that influenced the clinical and MRI outcomes of MSC implantation with concomitant HTO for varus knee OA.
Primary knee osteoarthritis (OA) is caused by a combination of risk factors, including increasing age and obesity, knee malalignment, increased biomechanical loading of joints, and/or genetics. 37 Among these risk factors, varus knee malalignment can lead to increased loads on the medial compartment and induce progressive cartilage degeneration, leading to medial compartmental knee OA. 5 For patients who have medial compartmental knee OA, high tibial osteotomy (HTO), which corrects the limb deformity by shifting the mechanical axis to the lateral side and decreasing contact pressure on the affected medial cartilage, can provide the adequate mechanical environment for preventing further degeneration of articular cartilage. 2,33,51 Although authors have reported encouraging short-term and midterm outcomes of HTO, 3,48,50 satisfactory long-term outcomes of HTO are questionable until adequate cartilage regeneration in the medial compartment of the knee joint is accomplished. 48,52 Therefore, several studies on additional cartilage repair procedures with concomitant HTO have emerged in an attempt to obtain more adequate regeneration of cartilage in the medial compartment of the knee joint. 13,15,44
Mesenchymal stem cells (MSCs) have been assessed as a potential cell-based therapy for the treatment of OA because of their capacity for differentiation into chondrocytes and their immunomodulatory properties. 16,29 It has been reported that the addition of MSC treatment is useful in achieving greater cartilage remodeling and better clinical outcomes in patients undergoing HTO, 24,25,28,49,55 which indicates that the outcomes of this combined procedure should be different from those of HTO alone. However, to date, no studies have assessed factors that influence the outcomes of MSC implantation in combination with HTO for varus knee OA. The identification of factors associated with favorable and unfavorable outcomes would provide patients with accurate expectations of this treatment. Accordingly, this study aimed to investigate the clinical, radiographic, and magnetic resonance imaging (MRI) outcomes of MSC implantation in combination with HTO in patients with varus knee OA and to identify the prognostic factors that are associated with the outcomes.
Methods
Patient Enrollment
This study was reviewed and approved by the institutional review board at our institution, and informed consent was obtained from all participants before study enrollment. We retrospectively reviewed the data of 83 consecutive patients (91 knees) who underwent MSC implantation in combination with HTO for varus knee OA between July 2017 and November 2018. The inclusion criteria, determined by medical records, plain radiographs, and MRI scans, were symptomatic knee pain unresponsive to nonoperative treatment, radiographs showing medial compartmental knee OA classified as Kellgren-Lawrence grade 3 or 4, 21 and varus deformity between the tibial and femoral mechanical axes as measured on a hip-to-ankle standing anteroposterior (AP) radiograph. 40 The exclusion criteria were previous surgery, cartilage lesions in the lateral or patellofemoral compartment, and other pathological diseases including rheumatoid arthritis, hemophilia, active knee infections, chronic anterior/posterior cruciate ligament instability, or meniscal tears. Of the 83 patients (91 knees), 12 patients (16 knees) were excluded: 9 patients (13 knees) did not meet the inclusion criteria, 2 patients (2 knees) were lost to follow-up, and 1 patient (1 knee) refused to undergo follow-up MRI. A total of 71 patients (75 knees) were ultimately included in the analysis (Figure 1). The baseline demographics of the patients are summarized in Table 1.

Flow diagram of patient involvement in the study. MRI, magnetic resonance imaging.
Patient Demographics and Characteristics a

a Values are expressed as mean ± SD (range) unless otherwise indicated. MSC, mesenchymal stem cell.
Preparation of MSCs
Subcutaneous adipose tissue samples were obtained through liposuction from the gluteal regions of the patients 1 day before MSC implantation with concomitant HTO. The liposuction material was aspirated by gentle suction, the gluteal fat pad was collected, and separation of the stromal vascular fraction (SVF) through centrifugation was performed in accordance with a previously reported method. 56 Stem cells were isolated from the lipoaspirate by enzymatic digestion and cultured to determine the characteristics of the adipose-derived stem cells. The adipose-derived stem cell immunophenotype was investigated using cell markers by analytical flow cytometry, 35 and the differentiation potentials of adipose-derived stem cells into adipogenic, osteogenic, and chondrogenic cell lineages were also assessed using specific inductive culture media. 35 These isolation and characterization procedures determined that the SVF contained adipose-derived MSCs, which made up 9.8% of this fraction. Consequently, a mean of 1.21×10⁸ cells in the SVF, which contained a mean of 1.19×10⁷ stem cells (9.8% of 1.21×10⁸ cells in the SVF; range, 7.21×10⁶ to 1.98×10⁷), were used for MSC implantation.
Surgical Procedure
The surgical procedure was identical in all patients and was performed as described previously. 23 The patients were placed in the supine position on the operating table, and thigh tourniquets were applied. Before MSC implantation, accurate debridement of all unstable and damaged cartilage in the lesion was performed. The prepared MSCs were loaded into the fibrin glue product (Greenplast Kit W; Green Cross), which was used as a scaffold for MSC implantation. After the arthroscopic fluid was extracted, MSCs mixed with fibrin glue were implanted into the lesion site under arthroscopic guidance. Next, the applied MSCs mixed with fibrin glue were manipulated using a probe to evenly cover the surface of the cartilage lesion. No marrow stimulation procedures such as microfracture, subchondral drilling, or abrasion arthroplasty were performed before this procedure. After the arthroscopic procedure, HTO was performed. During preoperative planning, the desired correction angle and wedge size were calculated using hip-to-ankle standing AP radiographs, with the aim of mild overcorrection. 11 Open-wedge HTO was performed with the angular-stable TomoFix plate (Synthes), and the osteotomy site was filled with a β-tricalcium phosphate wedge (Synthes), which is a synthetic resorbable substitute possessing compressive strength similar to that of cancellous bone, in compliance with the open space.
As a postoperative rehabilitation exercise, active and passive range of motion was initiated on the first postoperative day. The patients were allowed to move their knee from 0° to 90° after 2 weeks. Toe-touch weightbearing was allowed at 2 weeks after surgery, followed by partial weightbearing for 2 weeks. Full weightbearing was allowed at 4 weeks, after radiographic evidence of bone consolidation at the osteotomy site was confirmed. Sports and intense levels of activity were allowed at 3 months after surgery.
Clinical and Radiographic Evaluations
All patients were evaluated clinically and radiographically before surgery and postoperatively at 4 weeks, 3 months, 6 months, 1 year, and annually until the last follow-up visit (mean, 26.8 months [range, 24-34 months]). For the clinical evaluation, the Lysholm score 26 and the Knee injury and Osteoarthritis Outcome Score (KOOS) 47 were used to determine joint function and the ability to perform sports activities. Clinical outcome scores were collected by a special nurse who was blinded to the intention of this study. Radiographs of the knee joints were obtained and included AP views, true-lateral views at 30° of knee flexion, and AP long-leg weightbearing views. The femorotibial angle (the angle between the femoral and tibial shaft axes on AP radiographs) 40 and posterior tibial slope (the angle formed by the tangent to the medial tibial plateau and the line perpendicular to the tangent at the anterior tibial cortex) with the knee in 30° of flexion 39 were measured to analyze the mechanical effects of HTO.
MRI Evaluation
Preoperative and follow-up MRI was performed using a 3.0-T MRI scanner (Achieva 3.0-T SE; Philips) with a dedicated 8-channel knee coil. Follow-up MRI was performed at a mean of 18.5 months postoperatively. The following sequences were utilized: (1) proton density (PD) spectral presaturation with inversion recovery (SPIR) transversal image (repetition time/echo time [TR/TE], 4000/15 milliseconds; field of view [FOV], 150×150 mm; matrix, 308×249; slice thickness [SL], 3.5 mm with 0.35-mm gap), (2) PD SPIR coronal image (TR/TE, 3500/15 milliseconds; FOV, 150×150 mm; matrix, 260×240; SL, 3.0 mm with 0.5-mm gap), (3) T2 SPIR sagittal image (TR/TE, 3200/70 milliseconds; FOV, 150×150 mm; matrix, 240×192; SL, 3.0 mm with 0.3-mm gap), and (4) turbo spin echo T1-weighted sagittal image (TR/TE, 600/20 milliseconds; FOV, 150×150; matrix, 240×240; SL, 3.0 mm with 0.3-mm gap). To avoid potential bias, an independent observer, who was a musculoskeletal radiologist not involved in the care of patients and blinded to the intention of this study, evaluated the MRI scans. The size of the cartilage lesion was measured using preoperative MRI. On follow-up MRI, the MOCART (magnetic resonance observation of cartilage repair tissue) scoring system was used for the evaluation of repaired cartilage (Table 2). 36
MOCART Scoring System a

a MOCART, magnetic resonance observation of cartilage repair tissue.
Statistical Analysis
The principal dependent variables were the Lysholm score and KOOS at the final follow-up (clinical outcomes) as well as the postoperative MOCART score (MRI outcomes). Data are reported as means ± SDs unless otherwise indicated. The Wilcoxon signed-rank test was used to evaluate differences between the preoperative and final follow-up values. To assess the association of patients’ demographic characteristics with clinical and MRI outcomes, each category was divided into groups: age (<50, 50-59, 60-69, and ≥70 years), sex (male/female), side of involvement (right/left), body mass index (BMI; <20.0, 20.0-24.9, 25.0-29.9, and ≥30.0 kg/m2), cartilage lesion size (femoral condyle: <6.0, 6.0-6.9, 7.0-7.9, and ≥8.0 cm2; tibial plateau: <5.0, 5.0-5.9, 6.0-6.9, and ≥7.0 cm2), and number of MSCs (<1.0×10⁷, 1.0×10⁷ to 1.5×10⁷, and ≥1.6×10⁷). Differences between the groups were analyzed using the Mann-Whitney U test or the Kruskal-Wallis test for multiple comparisons.
The Spearman rank-order correlation test was used to evaluate the potential bivariate associations between the different factors to assess whether a statistically significant correlation existed. Multivariate logistic regression analyses were used to assess the factors that were independently associated with unsatisfactory clinical outcomes. We defined unsatisfactory clinical outcomes as a Lysholm score of <83 or KOOS subscores of <74 (Pain), 72 (Symptoms), 75 (Activities of Daily Living [ADL]), 54 (Sports and Recreation [Sports/Rec]), or 62 (Quality of Life [QoL]) because the mean Lysholm score at the final follow-up was 82.9, and the mean KOOS subscores were 73.4 for pain, 71.4 for symptom, 74.1 for ADL, 53.2 for Sports/Rec, and 61.1 for QoL, respectively. We calculated odds ratios and 95% CIs relative to a chosen reference group for the logistic regression models. Linear regression analyses were also used to evaluate the correlation between number of MSCs and MOCART score. Statistical analyses were performed using SPSS (Version 13.0; IBM), with significance defined as P < .05.
Results
Clinical, Radiographic, and MRI Outcomes
Before surgery, the mean clinical outcome scores were 55.1 ± 3.7 (Lysholm), 43.2 ± 2.4 (KOOS-Pain), 41.4 ± 2.4 (KOOS-Symptoms), 50.8 ± 2.2 (KOOS-ADL), 24.0 ± 4.4 (KOOS-Sports/Rec), and 39.2 ± 4.1 (KOOS-QoL). At the final follow-up, all mean scores improved significantly to 82.9 ± 3.8 (Lysholm), 73.4 ± 3.4 (KOOS-Pain), 71.4 ± 3.4 (KOOS-Symptoms), 74.1 ± 4.6 (KOOS-ADL), 53.2 ± 3.2 (KOOS-Sports/Rec), and 61.1 ± 4.5 (KOOS-QoL) (P < .001 for all). In addition, no clinically significant adverse event was noted. Radiographic outcomes at the final follow-up showed that knee joint alignment had been corrected. The mean femorotibial angle and posterior tibial slope were significantly changed from varus 3.3° ± 1.9° and 10.0° ± 1.0° to valgus 8.8° ± 2.4° and 10.3° ± 2.7°, respectively (P < .001 for both). Follow-up MRI was performed at a mean of 18.5 months postoperatively (Figure 2). Before surgery, the mean MOCART score was 35.7 ± 9.3 for the femoral condyle and 35.2 ± 9.7 for the tibial plateau. On follow-up MRI, the mean MOCART score improved significantly to 74.2 ± 8.6 for the femoral condyle and 74.1 ± 7.5 for the tibial plateau (P < .001 for both).
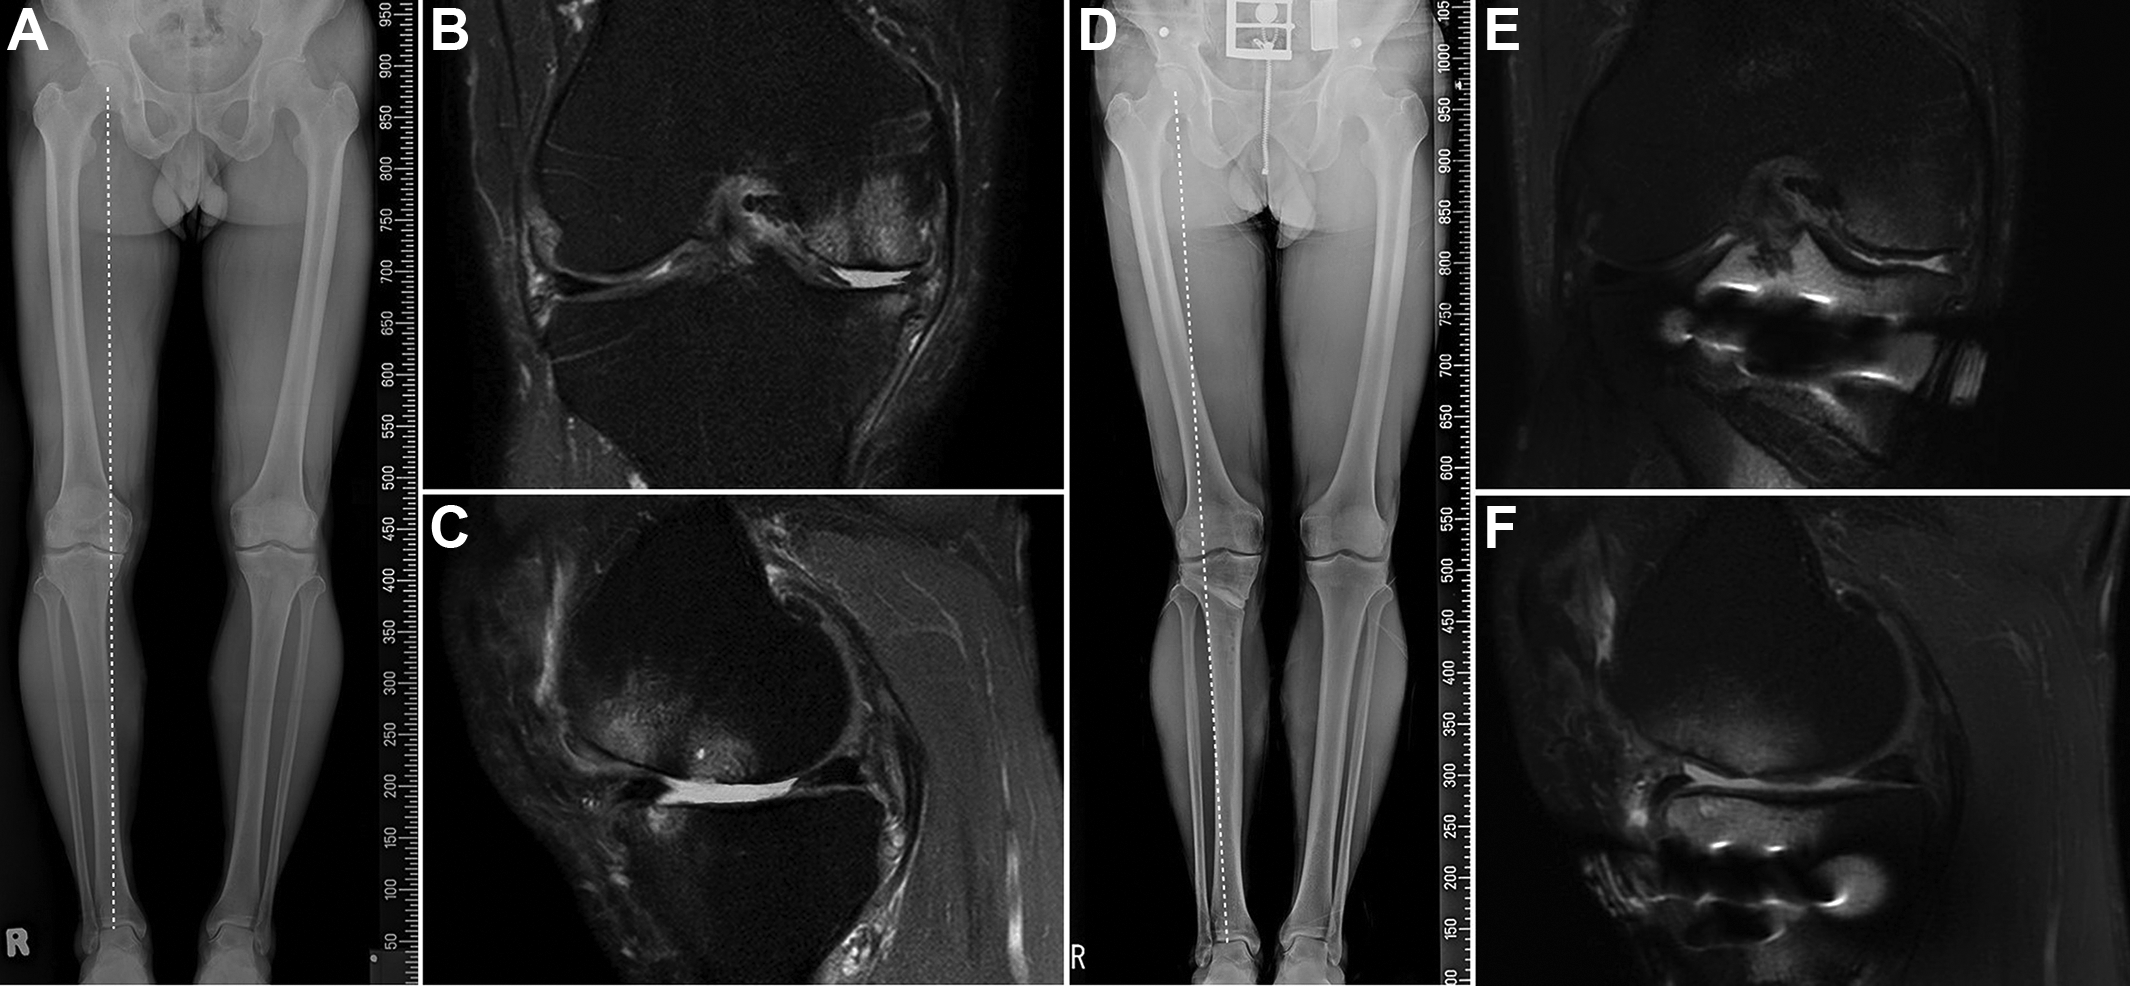
(A) Preoperative anteroposterior (AP) long-leg weightbearing view. Varus malalignment of the knee joint is observed. (B, C) Preoperative fat-saturated proton density coronal and sagittal images of the right knee of a 64-year-old female patient. Cartilage loss is observed in the medial femoral condyle and tibial plateau. (D) Follow-up AP long-leg weightbearing view shows the correction of varus malalignment of the knee joint. (E, F) Follow-up AP fat-saturated proton density coronal and sagittal images at 18 months after surgery. Cartilage regeneration along with favorable integration with adjacent native cartilage is observed.
Correlations Among Clinical, Radiographic, and MRI Outcomes
Significant correlations were found between the final clinical and MRI outcomes (all P < .05) (Table 3). The Lysholm and KOOS scores improved significantly as the level of repaired cartilage improved. However, the radiographic outcomes were not significantly correlated with clinical outcomes at the final follow-up. In addition, no significant correlation between the postoperative clinical, radiographic, and MRI outcomes was observed (Table 4).
Correlation Between Clinical and MRI Outcomes a

a Calculated using the Spearman rank-order test. KOOS, Knee injury and Osteoarthritis Outcome Score; MOCART, magnetic resonance observation of cartilage repair tissue; MRI, magnetic resonance imaging.
Correlation Between Clinical, Radiographic, and MRI Outcomes a

a Calculated using the Spearman rank-order test. KOOS, Knee injury and Osteoarthritis Outcome Score; MOCART, magnetic resonance observation of cartilage repair tissue; MRI, magnetic resonance imaging.
Association Between Patient Demographics and Clinical and MRI Outcomes
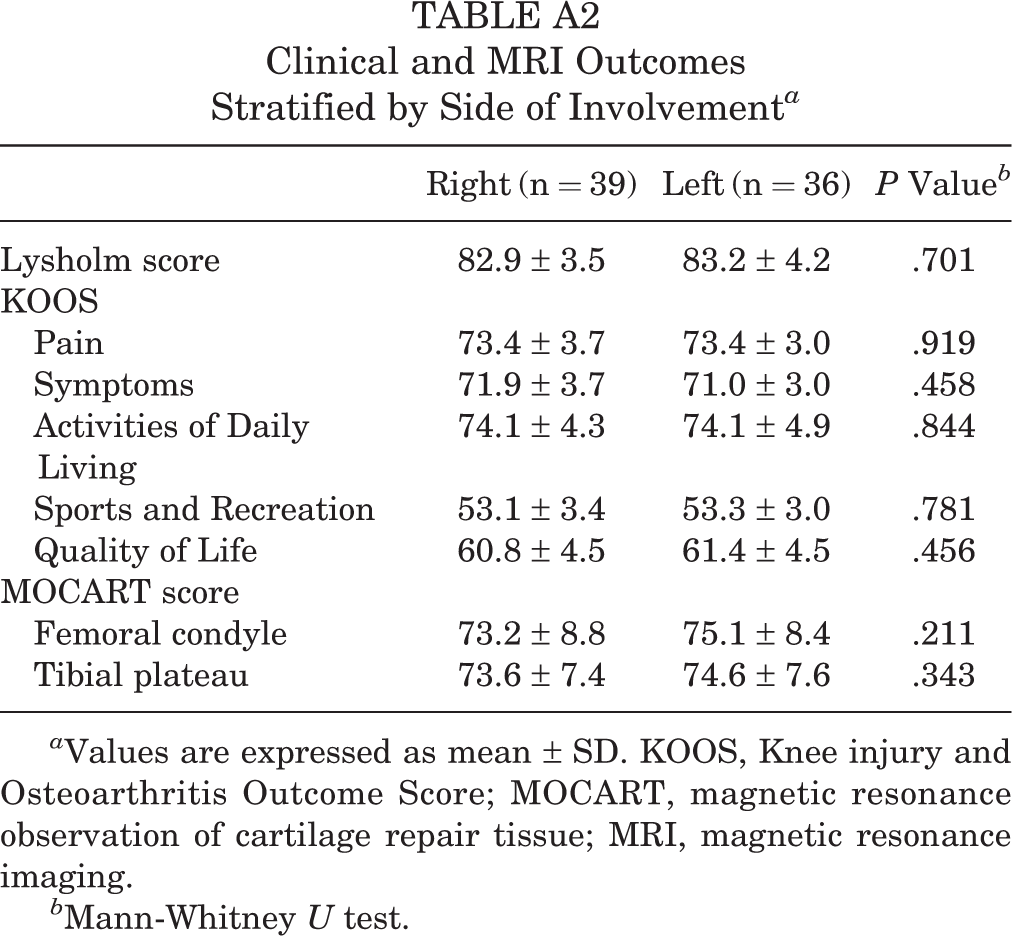
Significant differences were found in clinical outcomes and MOCART scores between the different age groups, with the exception of the KOOS-ADL and KOOS-QoL (Table 5). Significant differences were also found in clinical outcomes and MOCART scores with respect to the number of MSCs (Table 6). However, no significant differences were found in clinical outcomes and MOCART scores with respect to patient sex, side of involvement, BMI, or lesion size (Appendix Tables A1 -A5).
Clinical and MRI Outcomes Stratified by Age a
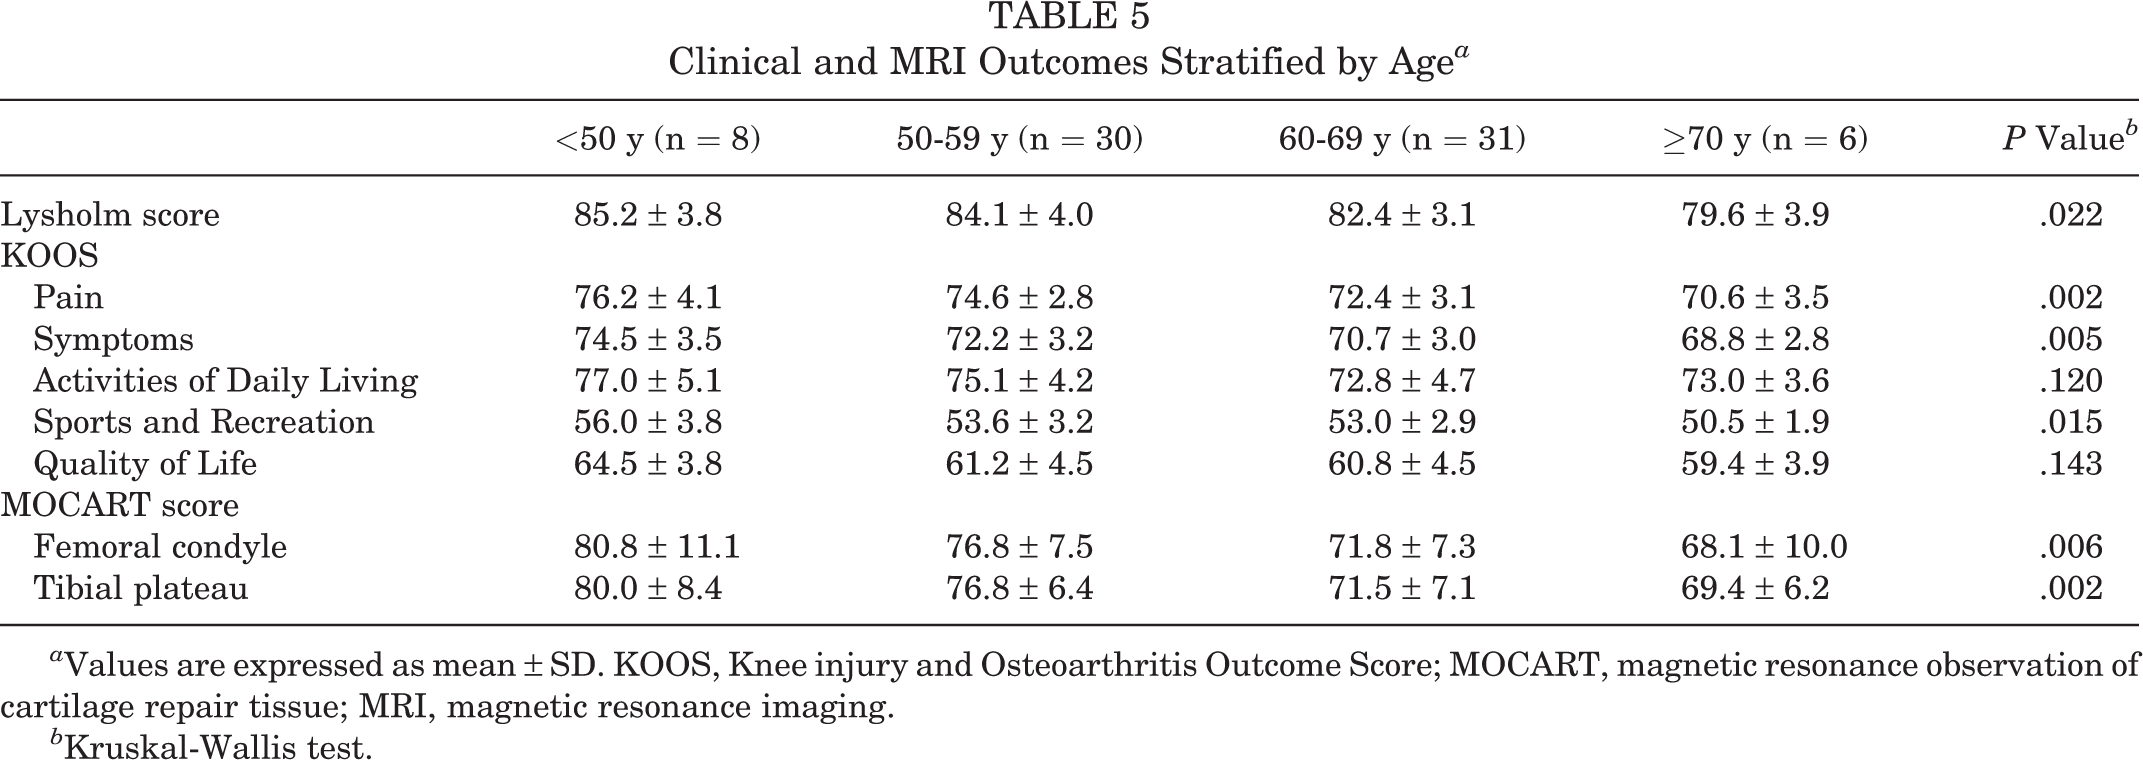
a Values are expressed as mean ± SD. KOOS, Knee injury and Osteoarthritis Outcome Score; MOCART, magnetic resonance observation of cartilage repair tissue; MRI, magnetic resonance imaging.
b Kruskal-Wallis test.
Clinical and MRI Outcomes Stratified by Number of MSCs a

a Values are expressed as mean ± SD. KOOS, Knee injury and Osteoarthritis Outcome Score; MOCART, magnetic resonance observation of cartilage repair tissue; MRI, magnetic resonance imaging; MSC, mesenchymal stem cell.
b Kruskal-Wallis test.
Multivariate logistic regression analyses were used to assess the factors that were independently associated with unsatisfactory clinical outcomes. All multivariate models were adjusted for differences in age and number of MSCs (Table 7). Patient age and number of MSCs were found to be independent predictors of clinical outcomes of MSC implantation with concomitant HTO (P = .014 and P = .037, respectively). Compared with patients aged <50 years, those aged 50-59 years were 2.211 times more likely to have unsatisfactory clinical outcomes (95% CI, 0.223-21.942), those aged 60-69 years were 10.599 times more likely to have unsatisfactory clinical outcomes (95% CI, 1.051-106.886), and those aged ≥70 years were 18.167 times more likely to have unsatisfactory clinical outcomes (95% CI, 0.771-428.211) after MSC implantation. Compared with patients with ≥1.6×10⁷ MSCs, those with MSCs between 1.0×10⁷ and 1.5×10⁷ were 2.819 times more likely to have unsatisfactory clinical outcomes (95% CI, 0.813-9.773), and those with <1.0×10⁷ MSCs were 5.153 times more likely to have unsatisfactory clinical outcomes (95% CI, 1.118-23.753) after surgery. The bivariate correlation analysis showed a statistically significant association between age and number of MSCs (r S = –0.479; P < .001).
Association of Patient Age and Number of MSCs With Clinical Outcomes a

a MSC, mesenchymal stem cell.
As illustrated in Figure 3, the number of MSCs was 1.2×10⁷ for the mean postoperative MOCART score (74.2 for the femoral condyle and 74.1 for the tibial plateau). According to the theoretical extrapolation of the correlation, the predicted number of MSCs for the highest possible MOCART score of 100 points was 2.5×10⁷ for the femoral condyle and 2.8×10⁷ for the tibial plateau.
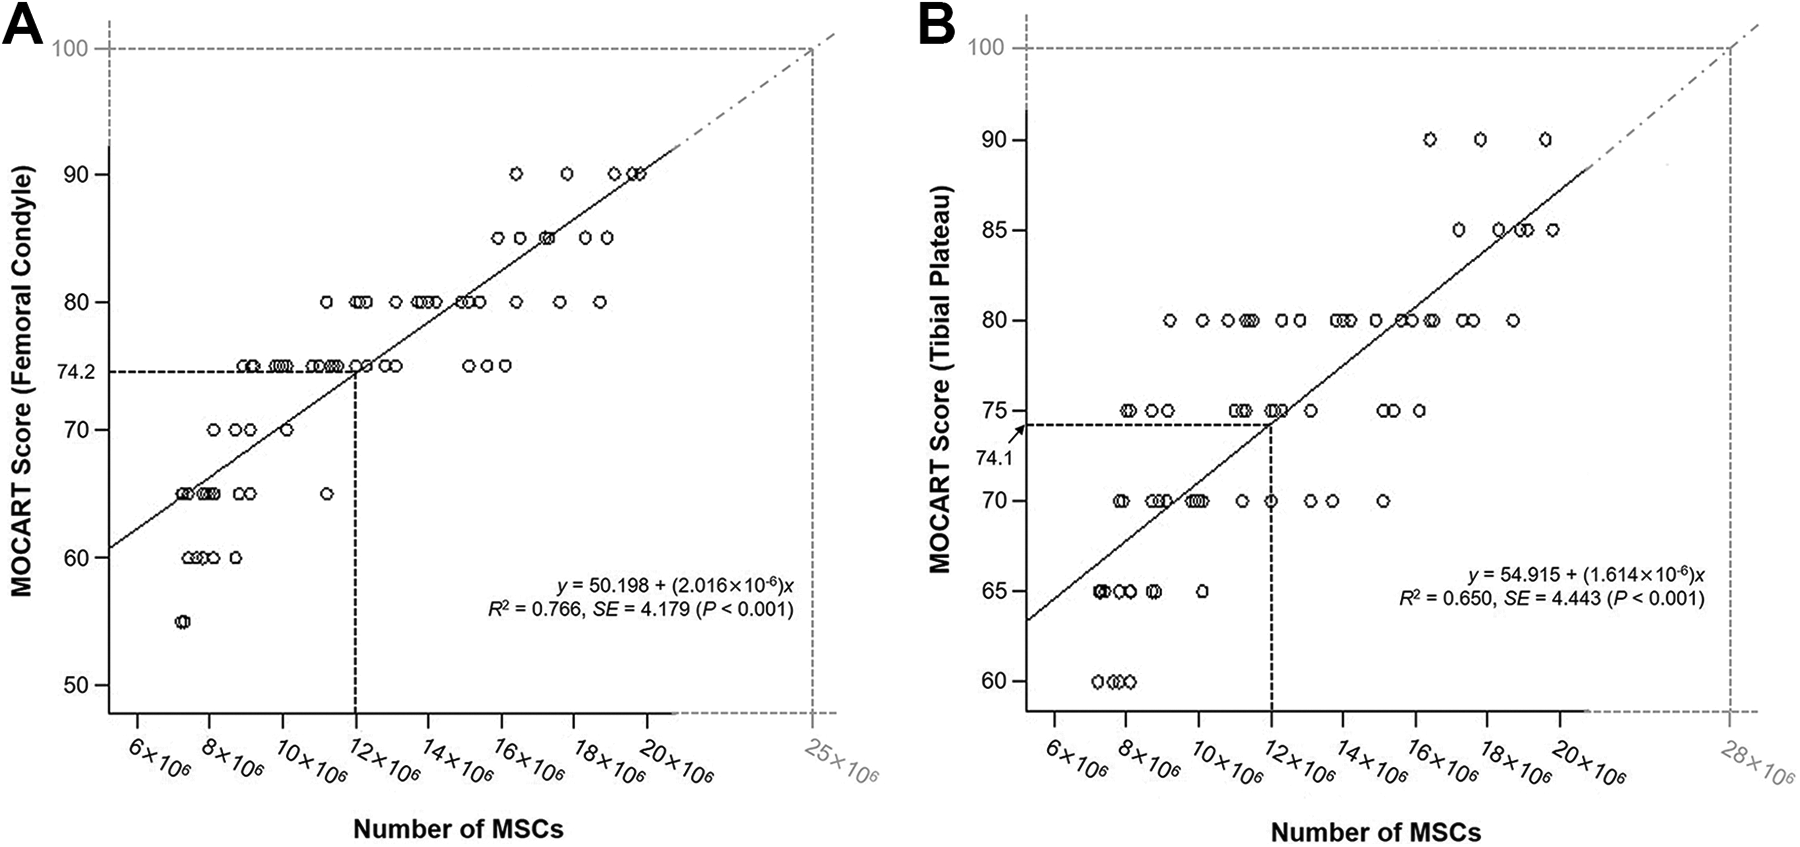
Correlation between the number of mesenchymal stem cells (MSCs) and postoperative MOCART (magnetic resonance observation of cartilage repair tissue) score for the (A) femoral condyle and (B) tibial plateau.
Discussion
The most important finding of this study was that patient age and number of MSCs were the principal prognostic factors that were significantly associated with the outcomes of MSC implantation with concomitant HTO (P = .014 and P = .037, respectively). Additionally, a statistically significant association was found between patient age and number of MSCs (r S = –0.479; P < .001). Although the application of MSCs is known to be beneficial for better cartilage regeneration, with improved clinical outcomes in patients undergoing concomitant HTO for varus knee OA, 4,25,28,49,55 we understand little about the contribution of known influential preoperative factors on the outcomes of MSC implantation with concomitant HTO. To our knowledge, this is the first study to assess the effect of patient demographic characteristics on the clinical and MRI outcomes after such a procedure.
Patient age is the main risk factor of OA. 37,42,45 In their study of 3,266,826 participants, Prieto-Alhambra et al 45 reported that the incidence rates of knee OA increased progressively with age, with the steepest slope in those aged 50-70 years, which then slowed down and peaked in those aged 75-85 years, with a slight decrease in the final years of life (≥85 years). Advanced age is not only a significant risk factor for OA, but it also affects the quality of MSCs. 10 Several studies have described an age-dependent effect on the properties of MSCs. 6,7 Chang et al 6 compared the number and function of MSCs in articular cartilage among human fetuses, healthy adults (aged 28-45 years), and elderly adults (aged 60-75 years), and they found that MSCs accounted for 94.69%, 4.85%, and 6.33% of the cells in articular cartilage, respectively (P < .001). They also reported that a lower chondrogenic differentiation of MSCs derived from elderly patients might be associated with the development of OA. 6 Choudhery et al 7 investigated the expansion and in vitro differentiation potential of MSCs in younger (<30 years), adult (35-50 years), and older (>60 years) patients, and they found that older MSCs displayed more senescent features than MSCs that were isolated from younger donors, concomitant with reduced viability, proliferation, and differentiation potentials. In the present study, significant differences were found in clinical and MRI outcomes among the 4 age groups, with the exception of KOOS-ADL and KOOS-QoL subscores (Table 5). In addition, we found that age was an independent predictor of clinical outcomes of MSC implantation (P = .014) (Table 7), and a significant association between patient age and number of MSCs was also found (r S = –0.479; P < .001). We consider that these findings are a consequence of the less favorable quality of the MSCs in older patients.
Obesity is a well-established risk factor for the development and progression of OA, especially in weightbearing joints. 10,37 Furthermore, obesity is known to reduce the capability of MSCs. Louwen et al 34 demonstrated that MSCs in obese patients have impaired functionalities including differentiation, proangiogenesis, motility, and immunomodulation, accompanied by alterations in their own undifferentiated state and metabolism. Roldan et al 46 examined MSCs from obese patients and showed a reduced proliferation rate, greater cell senescence, and reduced differentiation to multiple lineages, including chondrogenesis. In the present study, we divided the patients into 4 groups according to BMI, and we found no significant differences in the clinical and MRI outcomes among the BMI groups (Appendix Table A3). According to the 1998 “Clinical Guidelines on the Identification, Evaluation, and Treatment of Overweight and Obesity in Adults,” 8 overweight is defined as a BMI of 25.0 to 29.9 kg/m2 and obesity as a BMI of ≥30.0 kg/m2. In the present study, only 4 patients were in the obesity group, which means that MSCs from obese patients would not have influenced the outcomes; thus, no significant differences in the clinical and MRI outcomes were found among the BMI groups. Further studies comparing the outcomes between different BMI groups, including more patients with a BMI of ≥30 kg/m2, are needed to evaluate the independent effect of BMI on clinical and MRI outcomes of MSC implantation with concomitant HTO.
Although several clinical studies have focused on the use of MSCs as a cell-based treatment for OA, only a few have reported cartilage lesion size as a prognostic factor in using MSCs to treat knee OA. 22,23,27 Koh et al 27 performed MSC implantation under arthroscopic guidance and found that large lesion size (≥5.4 cm2) was a factor that resulted in incomplete cartilage repair and poor clinical outcomes. Kim et al 23 evaluated 54 patients (56 knees) who underwent second-look arthroscopic surgery after MSC implantation for cartilage lesions in their OA knees and reported that large lesion size (≥5.7 cm2) was a significant predictor of poor clinical and arthroscopic outcomes. Kim et al 22 evaluated 49 patients (55 knees) who underwent MSC implantation for knee OA and suggested that a lesion size of 6.0 cm2 was the upper limit for obtaining encouraging outcomes of MSC implantation.
In the present study, we found no significant differences in clinical and MRI outcomes between lesion size groups (Appendix Tables A4 and A5). In this study, the mean lesion sizes were 7.1 cm2 for the femoral condyle and 6.2 cm2 for the tibial plateau, which were larger than those in previous studies. 22,23,27 Furthermore, the distribution boundary of the lesion size was narrow compared with that of previous studies, 22,23,27 in which most lesion sizes were ≥6.0 cm2 (61/75 knees) for the femoral condyle and ≥5.0 cm2 (69/75 knees) for the tibial plateau—definitely large lesion sizes considering the medial tibiofemoral joint contact area reported by Tummala et al. 53 Therefore, we speculate that lesion size did not influence the clinical and MRI outcomes of surgery in the current study.
Several studies have documented the biomechanical improvements in the knee joint that can be achieved by restoring joint orientation and axial alignment, with satisfactory clinical outcomes of HTO for varus knee OA. 3,17,31,48 Although cartilage regeneration in the medial compartment of the knee joint has been reported to be achieved after HTO, 19,51 the quality of the regenerated cartilage was mostly insufficient for the load-bearing functions of articular cartilage. 20 In addition, a positive correlation between cartilage regeneration and clinical outcomes after HTO has been reported, 28,30,43 indicating that the biochemical properties of the regenerated cartilage are as important as its biomechanical properties. In this regard, conventional cartilage repair procedures with concomitant HTO have been performed to obtain better cartilage regeneration 15,44 ; however, such procedures have only been shown to stimulate the growth of fibrocartilage, which cannot withstand mechanical stresses as well as native hyaline cartilage. 32,38 Thus, several recent studies have suggested the application of MSCs for superior cartilage regeneration, reporting satisfactory clinical outcomes of concurrent MSC therapy with HTO. 4,24,25,28,49,55 Moreover, Saw et al 49 performed a histological evaluation after chondrogenesis with stem cells in combination with HTO, and they found that the regenerated cartilage closely resembled native articular cartilage. From this viewpoint, we believe that MSC implantation plays a role in the restoration of the essential biomechanical and biochemical properties of diseased cartilage in the medial compartment of the knee joint.
A review of the literature revealed that the number of MSCs used for the treatment of OA is another important prognostic factor of the outcomes. 1,16 According to Afizah and Hui, 1 who reviewed the use of bone marrow–derived MSCs for OA treatment, studies used the following numbers of MSCs: 8×10⁶ as the lowest number 9 and 1.46×10⁷, 55 1.3×10⁷, 54 2.0×10⁷ to 2.4×10⁷, 12 and 4×10⁷ as the highest numbers, 41 and markedly better results were observed in most studies 12,41,54,55 except for the study that used the lowest number of MSCs (8×10⁶). 9 Considering these results, Afizah and Hui concluded that >1×10⁷ of bone marrow–derived MSCs are required to achieve significantly better repair. In terms of adipose-derived MSCs, Kim and Koh 25 reported improved cartilage regeneration with better clinical outcomes after injection of adipose-derived MSCs (4.26×10⁶) with concurrent HTO for varus knee OA. Jo et al 18 performed intra-articular injection of adipose-derived MSCs with 3 different amounts of MSCs (1×10⁷, 5×10⁷, and 1×10⁸) for knee OA and found that only patients injected with 1×10⁸ MSCs demonstrated a decrease in articular cartilage defects by the regeneration of hyaline-like articular cartilage.
In the present study, 1.19×10⁷ cells were used, on average, for MSC implantation, and we assessed whether the number of MSCs influenced the clinical and MRI outcomes of MSC implantation. Accordingly, we found significant differences in clinical and MRI outcomes among groups according to the number of MSCs (Table 6). Furthermore, we found that number of MSCs was an independent predictor of clinical outcomes (Table 7). Although the optimal number of MSCs to be applied remains unknown, we believe that a larger number is required to obtain adequate cartilage regeneration. We used bivariate correlation analysis to predict the required number of MSCs for a MOCART score of 100 points, and our results suggested that an approximate minimum of 2.5×10⁷ cells is necessary to obtain encouraging cartilage regeneration after MSC implantation with concomitant HTO (see Figure 3).
This study had some limitations. First, the small number of study participants may have limited the power to detect other prognostic factors. For example, given our sample size, we cannot conclude that there is no relationship between lesion size or BMI and our primary clinical and MRI outcomes. However, given that no similar studies of this size have been published, we believe that these data are valuable for the assessment of prognostic factors influencing the outcomes of MSC implantation with concomitant HTO. In addition, this ongoing study can be strengthened in the future, as the number of patients who underwent this treatment will increase over time. Second, because of the retrospective nature of this study, specific patient information that may have improved the quality of the data reported, such as underlying diabetes, smoking status, and the use of anti-inflammatory medication, could not be assessed.
A third limitation was that we did not conduct a histological evaluation to assess the quality of regenerated cartilage. Because MSCs are a heterogeneous population of cells with variable growth potentials and distinct morphological and functional characteristics, 14 the quality of MSCs needed to achieve adequate cartilage regeneration should be identified to predict the outcomes of MSC implantation. In this study, we found that number of MSCs was a prognostic factor that influenced clinical outcomes, and the optimal number of MSCs is expected to obtain better cartilage regeneration. However, a future study that estimates other characteristics of MSCs that influence the clinical outcomes of MSC implantation is needed to more accurately assess influential prognostic factors. Finally, follow-up MRI was performed at about 18 months postoperatively. It is unknown how regenerated cartilage will behave over time, and changes in the influential factors after 18 months cannot be predicted.
Conclusion
The study results showed improved clinical and MRI outcomes of MSC implantation with concomitant HTO for varus knee OA. Furthermore, patient age and number of MSCs were important factors that influenced the clinical and MRI outcomes. Identifying these factors may provide a more accurate screening tool for surgeons to better assess which patients are good candidates for MSC implantation with concomitant HTO.
Footnotes
Final revision submitted August 9, 2020; accepted August 11, 2020.
The authors declared that there are no conflicts of interest in the authorship and publication of this contribution. AOSSM checks author disclosures against the Open Payments Database (OPD). AOSSM has not conducted an independent investigation on the OPD and disclaims any liability or responsibility relating thereto.
Ethical approval for this study was obtained from Yonsei Sarang Hospital (project No. 19-E003-005).
APPENDIX
Clinical and MRI Outcomes Stratified by Patient Sex a

| Male (n = 35) | Female (n = 40) | P Value b | |
|---|---|---|---|
| Lysholm score | 82.5 ± 3.9 | 83.5 ± 3.8 | .301 |
| KOOS | |||
| Pain | 73.1 ± 3.8 | 73.7 ± 3.1 | .477 |
| Symptoms | 71.0 ± 3.5 | 71.8 ± 3.2 | .290 |
| Activities of Daily Living | 74.1 ± 5.1 | 74.2 ± 4.1 | .898 |
| Sports and Recreation | 53.6 ± 3.0 | 52.9 ± 3.8 | .351 |
| Quality of Life | 61.2 ± 4.2 | 61.0 ± 4.7 | .613 |
| MOCART score | |||
| Femoral condyle | 73.7 ± 8.9 | 74.6 ± 8.4 | .562 |
| Tibial plateau | 73.0 ± 8.2 | 75.1 ± 6.7 | .184 |
a Values are expressed as mean ± SD. KOOS, Knee injury and Osteoarthritis Outcome Score; MOCART, magnetic resonance observation of cartilage repair tissue; MRI, magnetic resonance imaging.
b Mann-Whitney U test.
Clinical and MRI Outcomes Stratified by Side of Involvement a
| Right (n = 39) | Left (n = 36) | P Value b | |
|---|---|---|---|
| Lysholm score | 82.9 ± 3.5 | 83.2 ± 4.2 | .701 |
| KOOS | |||
| Pain | 73.4 ± 3.7 | 73.4 ± 3.0 | .919 |
| Symptoms | 71.9 ± 3.7 | 71.0 ± 3.0 | .458 |
| Activities of Daily Living | 74.1 ± 4.3 | 74.1 ± 4.9 | .844 |
| Sports and Recreation | 53.1 ± 3.4 | 53.3 ± 3.0 | .781 |
| Quality of Life | 60.8 ± 4.5 | 61.4 ± 4.5 | .456 |
| MOCART score | |||
| Femoral condyle | 73.2 ± 8.8 | 75.1 ± 8.4 | .211 |
| Tibial plateau | 73.6 ± 7.4 | 74.6 ± 7.6 | .343 |
a Values are expressed as mean ± SD. KOOS, Knee injury and Osteoarthritis Outcome Score; MOCART, magnetic resonance observation of cartilage repair tissue; MRI, magnetic resonance imaging.
b Mann-Whitney U test.
Clinical and MRI Outcomes Stratified by Body Mass Index a
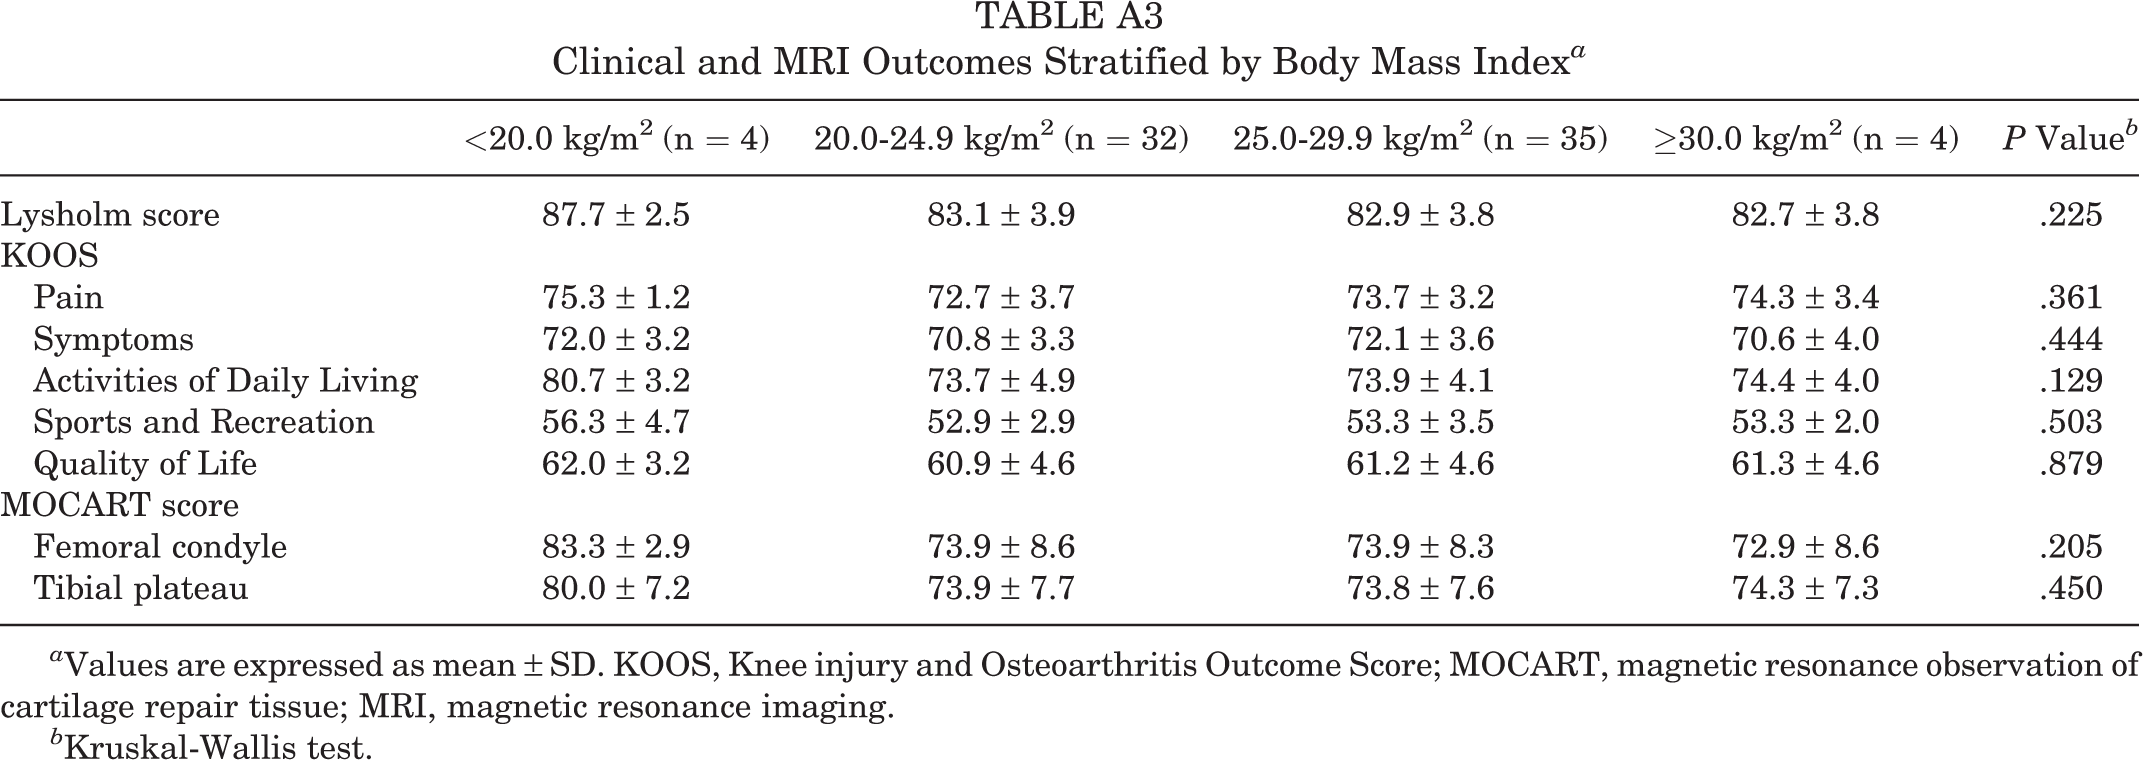
| <20.0 kg/m2 (n = 4) | 20.0-24.9 kg/m2 (n = 32) | 25.0-29.9 kg/m2 (n = 35) | ≥30.0 kg/m2 (n = 4) | P Value b | |
|---|---|---|---|---|---|
| Lysholm score | 87.7 ± 2.5 | 83.1 ± 3.9 | 82.9 ± 3.8 | 82.7 ± 3.8 | .225 |
| KOOS | |||||
| Pain | 75.3 ± 1.2 | 72.7 ± 3.7 | 73.7 ± 3.2 | 74.3 ± 3.4 | .361 |
| Symptoms | 72.0 ± 3.2 | 70.8 ± 3.3 | 72.1 ± 3.6 | 70.6 ± 4.0 | .444 |
| Activities of Daily Living | 80.7 ± 3.2 | 73.7 ± 4.9 | 73.9 ± 4.1 | 74.4 ± 4.0 | .129 |
| Sports and Recreation | 56.3 ± 4.7 | 52.9 ± 2.9 | 53.3 ± 3.5 | 53.3 ± 2.0 | .503 |
| Quality of Life | 62.0 ± 3.2 | 60.9 ± 4.6 | 61.2 ± 4.6 | 61.3 ± 4.6 | .879 |
| MOCART score | |||||
| Femoral condyle | 83.3 ± 2.9 | 73.9 ± 8.6 | 73.9 ± 8.3 | 72.9 ± 8.6 | .205 |
| Tibial plateau | 80.0 ± 7.2 | 73.9 ± 7.7 | 73.8 ± 7.6 | 74.3 ± 7.3 | .450 |
a Values are expressed as mean ± SD. KOOS, Knee injury and Osteoarthritis Outcome Score; MOCART, magnetic resonance observation of cartilage repair tissue; MRI, magnetic resonance imaging.
b Kruskal-Wallis test.
Clinical and MRI Outcomes Stratified by Lesion Size of the Femoral Condyle a

| <6.0 cm2 (n = 14) | 6.0-6.9 cm2 (n = 23) | 7.0-7.9 cm2 (n = 23) | ≥8.0 cm2 (n = 15) | P Value b | |
|---|---|---|---|---|---|
| Lysholm score | 82.3 ± 4.5 | 83.4 ± 3.3 | 83.4 ± 3.0 | 83.2 ± 3.9 | .887 |
| KOOS | |||||
| Pain | 74.2 ± 3.1 | 73.0 ± 3.4 | 73.7 ± 3.6 | 72.7 ± 3.5 | .881 |
| Symptoms | 73.4 ± 2.8 | 71.2 ± 3.6 | 71.0 ± 3.6 | 70.2 ± 2.4 | .081 |
| Activities of Daily Living | 75.3 ± 5.1 | 72.4 ± 4.7 | 75.6 ± 4.3 | 73.4 ± 3.4 | .052 |
| Sports and Recreation | 55.2 ± 3.9 | 52.4 ± 3.0 | 53.2 ± 2.6 | 52.6 ± 2.9 | .095 |
| Quality of Life | 62.7 ± 4.5 | 61.4 ± 5.0 | 60.8 ± 4.2 | 59.3 ± 3.7 | .172 |
| MOCART score | |||||
| Femoral condyle | 77.7 ± 8.3 | 72.2 ± 8.0 | 75.2 ± 9.6 | 72.1 ± 7.5 | .166 |
| Tibial plateau | 76.3 ± 8.3 | 73.5 ± 6.5 | 74.1 ± 8.6 | 72.9 ± 6.1 | .439 |
a Values are expressed as mean ± SD. KOOS, Knee injury and Osteoarthritis Outcome Score; MOCART, magnetic resonance observation of cartilage repair tissue; MRI, magnetic resonance imaging.
b Kruskal-Wallis test.
Clinical and MRI Outcomes Stratified by Lesion Size of the Tibial Plateau a

| <5.0 cm2 (n = 6) | 5.0-5.9 cm2 (n = 25) | 6.0-6.9 cm2 (n = 32) | ≥7.0 cm2 (n = 12) | P Value b | |
|---|---|---|---|---|---|
| Lysholm score | 83.5 ± 3.3 | 82.6 ± 4.1 | 83.5 ± 4.1 | 83.3 ± 3.9 | .765 |
| KOOS | |||||
| Pain | 74.5 ± 3.0 | 73.6 ± 3.3 | 73.3 ± 3.4 | 72.6 ± 4.1 | .966 |
| Symptoms | 74.0 ± 2.8 | 72.1 ± 3.6 | 70.9 ± 3.2 | 70.2 ± 3.1 | .061 |
| Activities of Daily Living | 74.3 ± 4.3 | 73.8 ± 5.3 | 74.7 ± 4.2 | 72.9 ± 4.5 | .386 |
| Sports and Recreation | 57.5 ± 3.0 | 53.1 ± 3.6 | 53.4 ± 2.8 | 51.5 ± 2.3 | .056 |
| Quality of Life | 62.8 ± 5.9 | 61.8 ± 4.8 | 61.5 ± 4.2 | 58.7 ± 2.6 | .053 |
| MOCART score | |||||
| Femoral condyle | 78.8 ± 4.8 | 73.8 ± 8.9 | 74.3 ± 9.1 | 73.2 ± 7.5 | .549 |
| Tibial plateau | 72.5 ± 6.5 | 74.6 ± 7.3 | 73.7 ± 8.2 | 74.2 ± 7.5 | .899 |
a Values are expressed as mean ± SD. KOOS, Knee injury and Osteoarthritis Outcome Score; MOCART, magnetic resonance observation of cartilage repair tissue; MRI, magnetic resonance imaging.
b Kruskal-Wallis test.