
Abstract
Background:
Machine learning (ML) allows for the development of a predictive algorithm capable of imbibing historical data on a Major League Baseball (MLB) player to accurately project the player's future availability.
Purpose:
To determine the validity of an ML model in predicting the next-season injury risk and anatomic injury location for both position players and pitchers in the MLB.
Study Design:
Descriptive epidemiology study.
Methods:
Using 4 online baseball databases, we compiled MLB player data, including age, performance metrics, and injury history. A total of 84 ML algorithms were developed. The output of each algorithm reported whether the player would sustain an injury the following season as well as the injury’s anatomic site. The area under the receiver operating characteristic curve (AUC) primarily determined validation.
Results:
Player data were generated from 1931 position players and 1245 pitchers, with a mean follow-up of 4.40 years (13,982 player-years) between the years of 2000 and 2017. Injured players spent a total of 108,656 days on the disabled list, with a mean of 34.21 total days per player. The mean AUC for predicting next-season injuries was 0.76 among position players and 0.65 among pitchers using the top 3 ensemble classification. Back injuries had the highest AUC among both position players and pitchers, at 0.73. Advanced ML models outperformed logistic regression in 13 of 14 cases.
Conclusion:
Advanced ML models generally outperformed logistic regression and demonstrated fair capability in predicting publicly reportable next-season injuries, including the anatomic region for position players, although not for pitchers.
Baseball is one of the richest data-driven sports, in which a seemingly countless number of metrics exist to quantify player performance. Major League Baseball (MLB) represents a “national pastime” focused on analytics that drive not only the fan base and franchise’s personnel decisions but also the orthopaedic and sports medicine literature. 14,22,27,28 With the increased attention to baseball injuries, outcomes, and performance, MLB, its players’ union, and minor league affiliates reached an agreement to create the MLB Health and Injury Tracking System (HITS) in 2010. While the goal of this system is to better understand player safety, access to the raw data is safeguarded, the database lacks prior injury data and is provided without the context of performance metrics. 1
From the perspective of MLB franchises and athletes, Conte et al 11 reported that the total annual cost of injuries from disabled list (DL) placement for franchises averaged more than US$423 million. In an industry where a single injury carries health, performance, and financial consequences for athletes, and in a sport laden with “big data,” the advent of machine learning (ML) arrives at an auspicious time to manage the growing performance and injury databases to answer complex questions. ML is a subset of artificial intelligence that uses computational algorithms that learn and improve from experience. 4,11 In its most simplistic form, this involves using sets of real-world data to predict or estimate an outcome. 2,4,11 These data sets represent “training sets” that the machine is then able to study and draw inferences from, or “learn,” using pattern recognition to make decisions on its own. 4 Such conclusions are compared with a testing set of actual outcomes to quantify the accuracy of the algorithm. As the data in the training sets grow and the number of testing repetitions increases, akin to “experiential learning,” the machine’s algorithm becomes more accurate and predictive.
Logistic regression (LR) represents the most primitive form of ML and has been frequently applied in the literature. 6,7 However, regression analysis is static and not predictive, meaning that it does not autoregulate to “learn” from complex data relationships, especially when more data inputs are added. This study represents the first foray, to our knowledge, in the sports medicine literature applying complex ML algorithms in which LR is compared against different ML algorithms. In this study, player characteristics, injuries, and performance metrics from 2000 to 2017 served as the initial training set from which the machine learned relationships to predict the most likely outcome for future players with similar profiles from a testing set. We hypothesized that, despite the complex scenarios that result in injuries and placement on the DL, an ML model trained in historical injury data may be capable of assessing the future injury risk in MLB players with high validity. Moreover, the anatomic location of the injury may be correctly predicted to target prevention. We believe that modern ML algorithms will be more representative models than primitive LR analyses in all clinical scenarios. For the purpose of leveraging available analytics to permit data-driven injury prevention strategies and informed decisions, the objective of this study of MLB players was to (1) characterize the epidemiology of injury trends on the DL from 2000 to 2017, (2) determine the validity of an ML model in predicting the injury risk for the subsequent year and anatomic injury location, and (3) compare the performance of modern ML algorithms versus LR analyses.
Methods
Data Source and Database Creation
The data for this study were obtained from several readily accessible and validated sources previously studied in the literature: Baseball-Reference, 19 FanGraphs, 12 MLB’s Baseball Savant, 3 and Professional Baseball Transactions Archive. 21 These databases were cross-referenced to validate their content, and redundant variables were kept only if they were the same to a margin of error of less than 1%. Data from Baseball-Reference and FanGraphs were downloaded using the open-source pybaseball package, and a custom Python (Version 3.7.3; Python Software Foundation) programming language script was developed to download data from both MLB’s Baseball Savant and Professional Baseball Transactions Archive. 21 Injury data were coded by the designated list (10-day, 15-day, or 60-day DL) to which the player was assigned (if applicable), the site of injury (knee, back, hand, foot/ankle, shoulder, elbow), if the injury required surgery, whether the injury required placement in the minor league for rehabilitation, or whether the injury resulted in the player’s being unable to play for the rest of the season. The total number of days away from sport was also tabulated as the sum of the total days on the DL plus 1 day for every injury labeled as a day-to-day injury (eg, if the player had an upper respiratory infection). Rookies, for whom prior injury data were unavailable, were not included in the study.
Once the raw data were collected, they were compiled using R (Version 3.5.1; R Foundation for Statistical Computing) and Python. 24,25 All player injuries were grouped by year and summed to arrive at the total number of injuries for that year. These data were then paired to player statistics for each season, resulting in a list of player statistics and injuries for each season in which they were in the major leagues. The full data-processing code can be viewed at https://github.com/JaretK/BaseballInjuryLearning.
Data Processing and Feature Selection
Age, performance data, professional injury history, and DL data were inputted for each player across every MLB year that he played. Performance data included sabermetrics for hitting (eg, walks, strikeouts, home runs, slugging percentage, total bases, number of hits per base, runs batted in), pitching (eg, walks, strikeouts, number of innings pitched, number of pitches thrown per pitch type, number of intentional walks), and overall (eg, wins above replacement, win probability added, leverage index, clutch score). Sabermetrics are standardized metrics used to track baseball player performance (more details on each metric can be found at https://library.fangraphs.com/). Unique players were extracted from the databases using their MLB identification number. 19,21
ML Algorithm Outputs
Algorithms were developed to predict each of the following 7 different outputs related to the subsequent season: next-season injury, next-season knee injury, next-season back injury, next-season hand injury, next-season foot/ankle injury, next-season shoulder injury, and next-season elbow injury.
ML Model Development and Calibration
Separate models were built for position players and pitchers. For each player group, we built models to predict 1 of the 7 clinical outcomes (next-season injury, next-season knee injury, next-season back injury, next-season hand injury, next-season foot/ankle injury, next-season shoulder injury, and next-season elbow injury). For each clinical outcome, 6 different model algorithms were created: LR, random forest, k-nearest neighbors, Naïve Bayes, XGBoost, and top 3 ensemble. 10,17 Thus, a total of 84 models were formed: (2[players and pitchers] × 7[clinical outcomes] × 6[different model algorithms]). Models were built using the scikit-learn Python library (Version 0.20.3) and XGBoost (Version 1.0.2). 18,20,25,26 The ensemble classifier is a combination of the top 3 performing models (“top 3 ensemble”) for each clinical outcome. The ensemble classifier was built using “soft voting,” in which the model decided to classify a patient as “yes injury” or “no injury” on the average of each model’s predicted probability of an injury. All available data were fed into each model, including year of play to account for any temporal trends in the injury incidence. Each model utilized a 10 k-fold strategy to cross-validate the model output; 10 k-folds require that 90% of the data be used to train the model, and the remaining 10% is used to test the model in an unbiased fashion. This step is repeated a total of 10 times, using a separate 10% of the data each iteration. This way, all of the data are eventually used to test the model without also being used to train each model (ie, 10% used to test the model per iteration, with 10 total iterations). Feature importance was calculated using the XGBoost model using the Gini importance metric. Figure 1 illustrates the flow of algorithm development and testing, with application to new player data.

Schematic demonstrating machine learning algorithm development and testing.
All ML algorithms must be calibrated. The algorithms were tested for calibration against one another to ensure that the probability of a player injury was appropriately calculated.
Statistical Analysis
Descriptive statistics were calculated for the cohort. The weight of the input variables contributing to the overall injury risk was calculated using SHAP (SHapley Additive exPlanations) scores. 9 Receiver operating characteristic (ROC) curves and probability calibration curves were created for each outcome. Each model was compared using accuracy, area under the ROC curve (AUC), F1 score, and Brier score loss (BSL). 15 AUC values of <0.7 are poor, ≥0.7 are fair, ≥0.8 are good, and ≥0.9 are excellent. 30 The accuracy of the model summarizes the number of players correctly classified divided by the total number of players in each analysis. An F1 score represents the weighted average of precision and recall. 13 Poor F1 scores are closer to 0, whereas better F1 scores are closer to 1. 13 A lower BSL indicates a superior model and signifies the mean squared difference between the predicted probability and the actual probability. 15 Because actual probabilities are necessarily 0 or 1, a perfect BSL (indicating a perfectly calibrated model) is 0 when predicted probabilities are equal to actual probabilities. Conversely, a BSL of 1 means that the predicted probabilities are the opposite of the actual probabilities. 8 R was used for all statistical analyses.
Results
Player Cohort
The position player group consisted of 9325 player-years (1931 unique players with a mean of 4.83 years of participation in MLB) from 2000 to 2017. Player injury characteristics are summarized in Table 1. A total of 4091 (44.0%) position player–years had prior injuries requiring loss of playing time, while 5225 (56.0%) had no evidence of injuries. Of the injuries that we collected, 147 player-years (1.6%) had at least 1 placement on the 10-day DL, 1859 (19.9%) had at least 1 placement on the 15-day DL, and 496 (5.3%) had at least 1 placement on the 60-day DL. A total of 3052 player-years (32.7%) had injuries that were designated as day to day but missed at least 1 game because of an injury.
The pitcher group consisted of 4657 player-years (1245 unique pitchers with a mean of 3.74 years played) from 2000 to 2017. A total of 2030 (43.6%) pitcher-years had prior injuries requiring loss of playing time (including day-to-day injuries). Of the injuries that we collected, 88 player-years (1.9%) had at least 1 placement on the 10-day DL, 1040 (22.3%) had at least 1 placement on the 15-day DL, and 319 (6.9%) had at least 1 placement on the 60-day DL. A total of 1004 player-years (21.6%) had injuries that were designated as day to day but missed at least 1 game because of an injury.
Injuries were subanalyzed by anatomic location and are summarized in Table 1. Overall, 37.2% of all knee injuries required DL placement, as did 27.2% of all back injuries, 34.8% of hand injuries, 35.0% of foot and ankle injuries, 50.4% of shoulder injuries, and 56.6% of elbow injuries. The 3176 players who were injured spent a total of 108,656 days injured, resulting in a mean of 34.21 total days per player for the duration of the study.
Player Injury Characteristics a

a Values in brackets indicate those requiring DL placement. DL, disabled list.
Predicting Next-Season (Future) Injuries
We predicted next-season injuries utilizing the injury and performance data from each player’s most recent season. Each player-year was treated independently from every other (ie, past injuries were not propagated through to future years). Each player-year was used to train the model using the performance data for the current year to predict injuries in the subsequent year. Thus, if a player was in the league for 5 complete years, his data would be used to train the model a total of 4 times (the last year was not used to train the model, as he would not have available future injury data). 8,9 The model with the highest AUC for position players was the top 3 ensemble, with a mean AUC across 10 k-fold iterations of 0.76 ± 0.02. This model also had the best accuracy, at 70.0% ± 2.0%. Other models with their associated metrics are shown in Table 2. The top 3 ensemble’s ROC curves for each k-fold and the mean ROC curve are shown in Figure 2. Variables ranked by relative importance for predicting future position player injuries are shown in Figure 3.
Models Predicting Future Injuries Among Position Players a

a Values are reported as mean ± SD across 10 k-folds. AUC, area under the receiver operating characteristic curve.

Position player receiver operating characteristic (ROC) curve for predicting future injuries based on prior-season performance and injuries, with sensitivity on the y-axis and 1-specificity on the x-axis. Area under the ROC curve (AUC) values of <0.7 are poor, ≥0.7 are fair, ≥0.8 are good, and ≥0.9 are excellent.
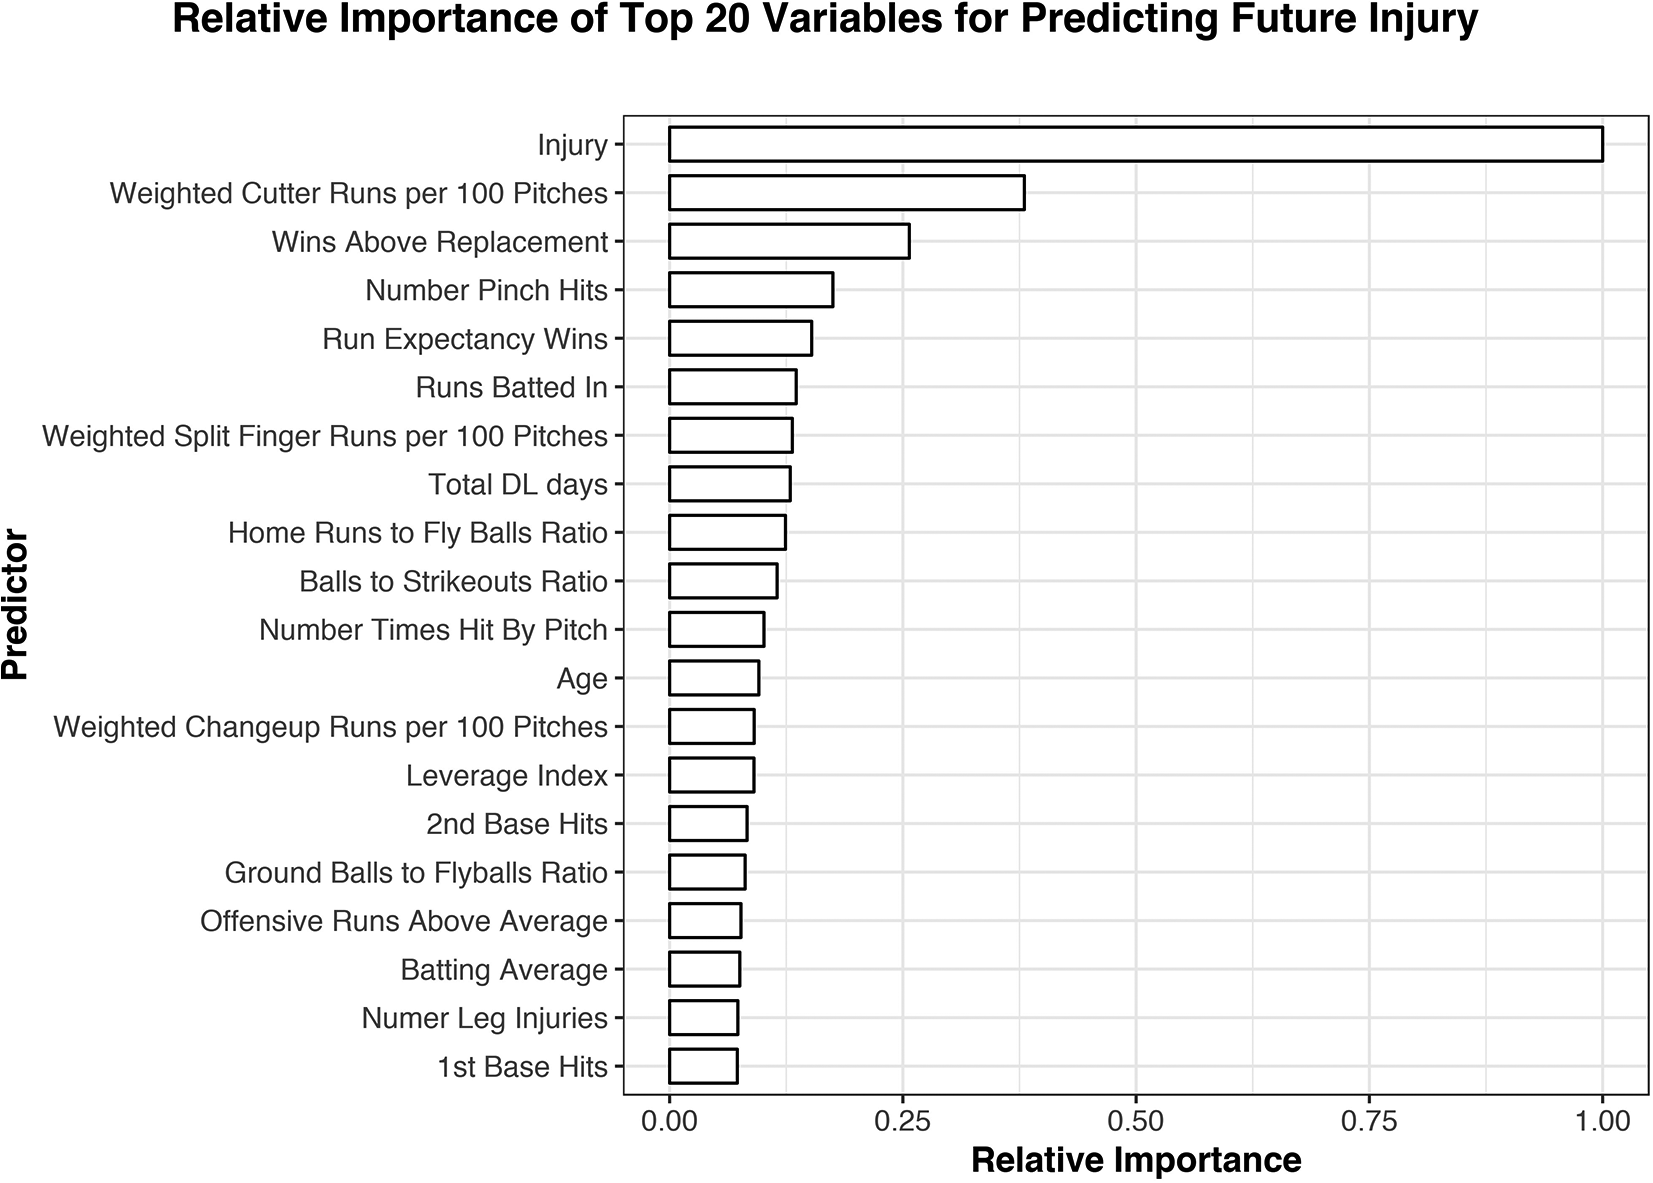
Variables ranked by relative importance for predicting future injuries among position players. Previous injuries and weighted cutter runs per 100 pitches were the most important variables in predicting outcomes. The relative importance is expressed as a fraction based on the weight of each variable, with 1.0 being the most important and 0.0 having no contribution to the model. DL, disabled list.
The models with the highest AUC for pitchers were random forest and the top 3 ensemble, both with a mean AUC across 10 k-fold iterations of 0.65 ± 0.02. The top 3 ensemble model had the highest accuracy, at 63.7% ± 2.0%. Other models with their associated metrics are shown in Table 3. The top 3 ensemble’s ROC curves for each k-fold and the mean ROC curve are shown in Figure 4.
Models Predicting Future Injuries Among Pitchers a

a Values are reported as mean ± SD across 10 k-folds. AUC, area under the receiver operating characteristic curve.

Pitcher receiver operating characteristic (ROC) curve for predicting future injuries based on prior-season performance and injuries, with sensitivity on the y-axis and 1-specificity on the x-axis. Area under the ROC curve (AUC) values <0.7 are poor, ≥0.7 are fair, ≥0.8 are good, and ≥0.9 are excellent.
Predicting Location of Injury
For position players, the top 3 ensemble was the best predictive model for future injuries of each anatomic region, with the exception of the elbow, based on the AUC. Elbow injuries were best predicted with LR, with an accuracy of 63.0% ± 3.6% and an AUC of 0.61 ± 0.08. Table 4 shows the accuracy, AUC, F1 score, and BSL of the models with the highest AUCs for predicting future anatomic injuries. Based on the AUC, the top 3 ensemble was the best predictive model among pitchers for each of the 4 anatomic regions studied, as seen in Table 5. Given the lower AUCs with pitchers, the determinants of predicting an injury were not calculated.
Best Performing Models Predicting Future Injuries Among Position Players, as Determined by the Highest AUC a

a Values are reported as mean ± SD across 10 K-folds.
Best Performing Models Predicting Future Injuries Among Pitchers, as Determined by the Highest AUC a
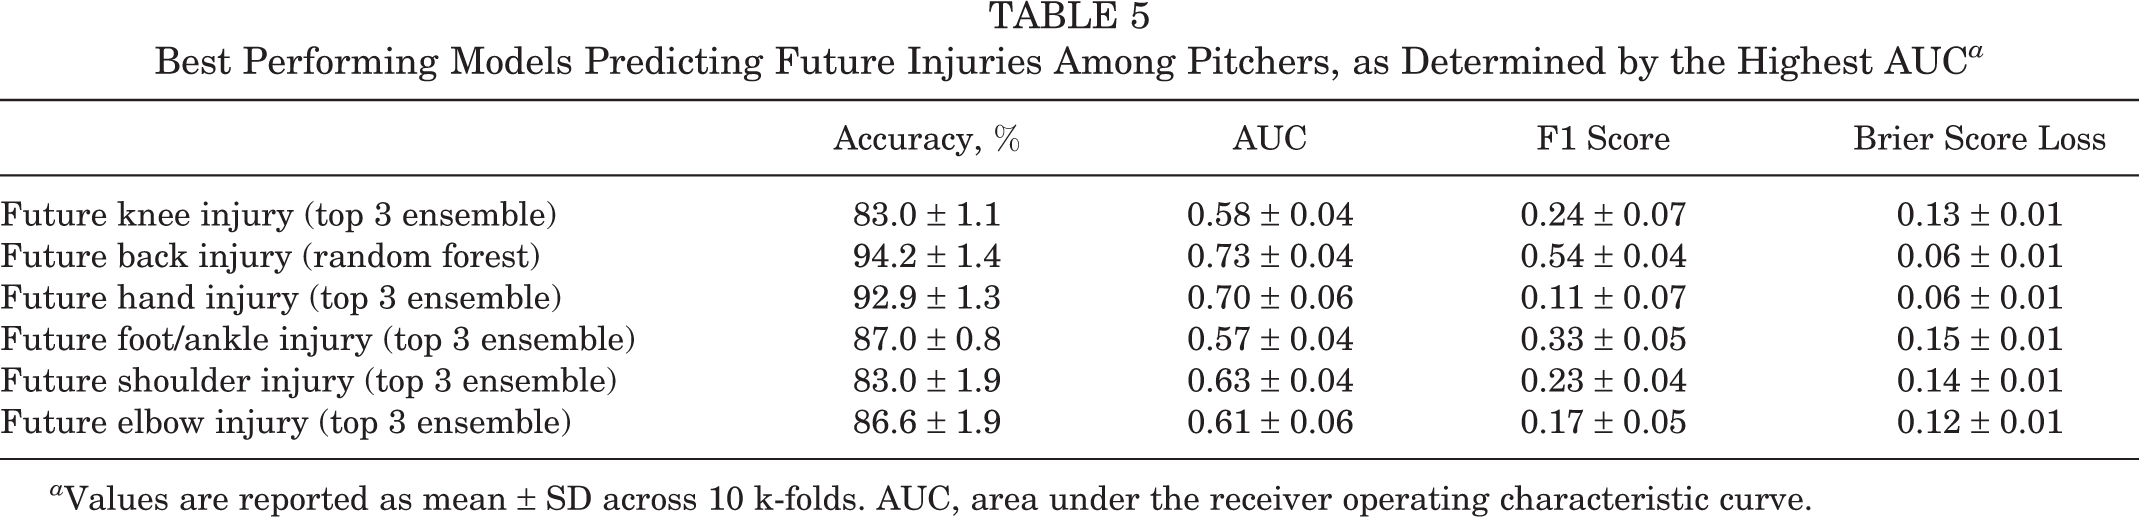
a Values are reported as mean ± SD across 10 k-folds. AUC, area under the receiver operating characteristic curve.
Discussion
ML and performance-related big data surrounding MLB, colloquially known as “sabermetrics,” have reached an echelon in which both may be symbiotically applied to answer questions previously thought to be unanswerable. After building a database requiring careful compilation of data from 13,982 player-years of performance and injury data from 1931 position players and 1245 pitchers, we analyzed usage of the DL over the past 17 seasons. From this, we found that 44.0% of position players and 43.6% of pitchers had prior injuries. The hand and back were the most commonly injured regions among position players, whereas shoulder and elbow injuries occurred most frequently in the pitcher group. Once this database using publicly reported injuries was complete, we applied LR and advanced ML techniques to assess viability using an algorithm capable of predicting injuries among MLB players before they occurred. Using age, performance data, injury history, and DL data from 17 seasons, we found that our provisional models were predictive of next-season injuries with fair reliability (AUC = 0.71-0.80) among position players and poor reliability (AUC = 0.61-0.69) in pitchers using the top 3 ensemble model. The expected anatomic region of injury demonstrated poor to fair reliability depending on the site. The most important determinants of injury prediction for the subsequent year, in descending order, were as follows: prior injury, weighted cutter runs per 100 pitches, wins above replacement, and player age. Models for pitchers had lower reliability compared with the position player models, perhaps because of the limited data specific to overuse injuries available among modern pitcher databases. Importantly, however, we established that advanced ML models are superior to LR, as advanced ML models, usually the top 3 ensemble and random forest, outperformed LR in terms of the AUC in 13 of the 14 cases.
With the ubiquity of computing power and the availability of large patient data sets, ML represents a form of artificial intelligence that warrants expansion into sports injury prevention and risk management using data-driven predictive analytics. While the simultaneous analysis of thousands of player profiles cannot be fully explained, and the “black box” phenomenon is created with ML models, these dynamic algorithms are not unlike the clinical experience of an evolving surgeon in that they improve with additive data or “experience.” This study does not represent the first attempt to apply ML to baseball. Yang and Swartz 29 created a Bayesian model expressed as a Markov chain that predicted division winners partway through a single season by combining prior winning percentages, overall batting ability, and the starting pitcher’s earned run average. Several ML analyses are well-described (ie, LR and random forest) in the literature already and may assist the team physician in predicting injuries or identifying subclinical abnormalities. 5,16,17,23,27
Given the array of classic (ie, LR, random forest) and advanced modeling techniques, the results of this study demonstrate 3 important takeaway points to guide future orthopaedic and sports medicine research in this new frontier of injury modeling. First, a single predictive model is not necessarily ideally suited for all clinical questions posed. Specifically, the top 3 ensemble was the model with the highest AUC for predicting next season’s injury risk among position players and pitchers, but random forest was superior in predicting back injuries among pitchers. Thus, no single model represents a panacea, and we recommend that an advanced data engineer work in concert with professional franchises and medical professionals to determine the best-suited model for the clinical question. Second, we illustrated that with more iterations, the algorithm continued to improve or “learn.” After the 10th iteration of the next-season injury risk model for position players, the AUC improved to 0.80, reaching good validity, and was proven to be dynamic (unlike static LR analyses). Third, this is the first study in the sports medicine literature to demonstrate that regression analysis is not necessarily the gold standard when forecasting and predicting risk, especially in the intersecting world of big data, in which performance metrics, injury profiles, and sports medicine interventions are increasingly valued.
Beyond the analytic aspect of ML, how can these findings guide care of these elite MLB athletes? This algorithm offers the orthopaedic surgeon longitudinally caring for these players to more synchronously work with coaching and franchise management using quantitative, not qualitative, metrics. The model may identify players at risk for a shoulder injury during the subsequent year and prompt earlier targeted examinations, ushering in the era of “precision medicine” on the field. Earlier guided interventions may offer targeted medical attention that reduces time away from the game during critical moments, such as the playoffs. This approach offers key integration points with the growing wearable market and certain companies that are applying ML algorithms to study human activities (including pitching and batting in real time) through sensors on the shoulder and elbow. As we continue to work with professional MLB franchises and acquire more specific pitcher data, this will certainly improve and may identify injuries in this specific population during practice to guide an athlete’s availability and risk profile. This may allow team physicians and franchise personnel to make strategic decisions to withhold a pitcher from a rotation and quantify the value of rest and recovery, opening a new frontier that may provide a new perspective on how we approach recovery protocols and postoperative restrictions. For franchises seeking to identify at-risk players, individual player data may be uploaded into the algorithm and can provide the franchise and medical personnel with up to 70% accuracy on whether the player will sustain an injury the following year, allowing the franchise to make informed recruiting decisions. Team physicians may similarly use these tools in expectation management and patient counseling, with the ability to discuss the statistical likelihood of future injuries with players. To a lesser degree, ML was capable of identifying the anatomic region where the injury was likely to occur. This finding may be readily applied to provide the player in question with targeted physical therapy and neuromuscular adaptations. 27
While current injury predictive modeling demonstrates limitations that make current deployment untenable, future refinement of these algorithms offers tangible potential utility. Knowledge of which players are likely to incur an injury has the potential of offering not only early interventions but also informed decision making for the organization before signing players to multiyear, multimillion-dollar contracts. 28 Certainly, the ethics of predicting injuries merits a discussion. The implication of assigning a player such a value runs the risk of diminishing the player’s value to a franchise. However, a player’s predisposition to injuries has always been under qualitative consideration; this algorithm simply applies a quantitative probability of an injury. Conversely, players who are less likely to sustain injuries may experience an increase in value for availability. This algorithm may be used as a risk-management tool for professional players from the franchise’s perspective. It is conceivable that applying player-specific data to develop algorithms may not be in the best interest of the MLB Players Association (MLBPA) and may cause sufficient concern to highly regulate the development of these advanced models.
Our study had several limitations. First, we were limited by the granularity of available data. Because of inabilities to determine nuanced injury characteristics, such as imaging and physical examination findings, we could not discern at this stage whether the future injury would be attributed to, for example, an elbow sprain versus a complete tear of the medial ulnar collateral ligament. Additionally, we were unable to capture the impact that chronic, lingering injuries may have on future injuries, as team-reported injuries are generally acute and severe enough to withdraw players from games. We also acknowledge that the lack of anatomic specificity of our data prediction algorithm does highlight the limited immediate clinical utility of such a model. However, this proof-of-concept study provides the framework for future studies that, with more granular data, may potentially explore more specific injury prediction. The large size of our database, sourced from multiple databases across the entire MLB population for 17 years and cross-referenced for accuracy, gives confidence that our advanced ML model can deduce future injury prediction with meaningful accuracy in the absence of a formal power analysis.
Another limitation was the sources of input of the databases utilized to obtain MLB player injury history and performance data. As previously stated, information was collected from 4 online baseball databases: Baseball-Reference, FanGraphs, MLB’s Baseball Savant, and Professional Baseball Transactions Archive. Both Baseball-Reference and FanGraphs are privately owned entities that compile information from a variety of sources, including companies that specialize in sports data acquisition and commerce. No public information is available on Professional Baseball Transactions Archive’s method of data collection. These 3 databases are not regulated by MLB and should naturally be evaluated with a degree of uncertainty. Baseball Savant, on the other hand, is endorsed by MLB; however, this database only publishes statistics starting in 2015. Moreover, we did not use the official MLB HITS data, as the HITS contains 6 years of data and is presently restricted from any performance-based analyses upon query and requires MLBPA approval. While public databases are certainly prone to inaccuracy and underreporting, a larger database with publicly reported DL and injury data is more than sufficient to preliminarily determine that these advanced computational techniques are predictive of future injuries, superior to regression analysis, and warrant further exploration. Compared with the position player data, the pitcher data were relatively less specific in terms of predictive variables, as factors such as practice pitch count, throwing form, and prior treatment modalities specific to this niche population were not included in the database. The current data set is limited to only game metrics and contains no wearable-based throwing motion data. Additional pitcher data, including pitch count and pitch type, may be readily added into our dynamic algorithm in the future to strengthen its accuracy and prediction confidence.
Despite the limitations of the present study, ML may have potential to play a role in the future of sports medicine. We found that player characteristics such as age, injury history, and performance metrics quantitatively predicted the injury risk for the subsequent year among MLB position players. The location of injury exhibited fair reliability, particularly with the back and hand in position players and pitchers. For pitchers, the prediction algorithms were shown to be less predictive than those used to make the position player models. This is likely because of generalized input parameters that require position-specific optimization to this niche population. While more data for the dynamic algorithm are required to strengthen insights predictive of injuries among these elite athletes, the prospect of applying ML to an elite sports population warrants further exploration, as it demonstrates superiority to the previous gold standard regression analysis, offers quantitative risk management for franchises, and presents an opportunity for targeted preventive interventions for medical personnel.
Conclusion
This study affirms the potential of ML in the prediction of the next-season injury risk for MLB players as well as the prediction of the injury’s anatomic location. Advanced ML models generally outperformed LR and demonstrated fair capability of predicting whether a publicly reportable injury was likely to occur the next season, including anatomic region, for position players, although not for pitchers. This study is one example of the potential integration of ML into the practice of clinical sports medicine and provides a foundation for future studies.
Footnotes
Final revision submitted April 21, 2020; accepted June 1, 2020.
One or more of the authors has declared the following potential conflicts of interest or source of funding: P.M.S. has received educational support from Arthrex, consulting fees from DJO and DePuy, nonconsulting fees from Arthrex, and hospitality payments from the Musculoskeletal Transplant Foundation. S.J.F. has received grant payments from Arthrex and DJO and educational support from Arthrex and Rock Medical. K.L.S. has received educational support from Arthrex; consulting fees from Molnlycke Health Care; nonconsulting fees from Horizon Pharma; honoraria from Fidia Pharma; and hospitality payments from Biomet Orthopedics, the Musculoskeletal Transplant Foundation, Ramsay Medical, and Stryker. L.D.F. has received consulting fees from Zimmer Biomet and hospitality payments from the Musculoskeletal Transplant Foundation. B.U.N. has received educational support from Smith & Nephew and hospitality payments from Stryker, Wright Medical, and Zimmer Biomet. N.N.V. has received educational support from Medwest; consulting fees from Arthrex, Medacta, and Smith & Nephew; nonconsulting fees from Arthrex and Smith & Nephew; and royalties from Smith & Nephew. E.C.M. has received educational support from Pinnacle (Arthrex), consulting fees from Smith & Nephew, and hospitality payments from Stryker. M.S.S. has received consulting fees and nonconsulting fees from Arthrex. AOSSM checks author disclosures against the Open Payments Database (OPD). AOSSM has not conducted an independent investigation on the OPD and disclaims any liability or responsibility relating thereto.
Ethical approval was not sought for the present study.