
Abstract
Background:
Anterior cruciate ligament (ACL) injuries are relatively common among younger athletes, with significant physical, psychological, and financial consequences. Research has largely focused on female athletes by identifying specific risk factors for an ACL injury, including variation in pubertal growth timing. There is less known about risk factors in males, and little is known about the effects of pubertal development on ACL injury risk in men.
Purpose/Hypothesis:
The purpose of this study was to analyze the relationship between an indicator of pubertal growth timing (age at adult height) and biomechanical risk for ACL injuries in men. We hypothesized that earlier age at adult height is correlated with riskier landing biomechanics during a drop vertical jump (DVJ) in men.
Study Design:
Cross-sectional study; Level of evidence, 3.
Methods:
A total of 21 recreationally active male students (age range, 20-33 years) were included. Participants completed a questionnaire on age at adult height and limb dominance, and anthropometric measurements were taken. There were 6 DVJ tests performed, with participants landing on a force plate while digital cameras recorded kinematic data from retroreflective markers placed according to the Helen Hayes marker system. Primary outcomes were sagittal and frontal plane knee kinematics and kinetics during contact. Data were analyzed using Pearson product-moment correlation.
Results:
In both limbs, age at achieving adult height was significantly negatively correlated with knee flexion/extension angle at toe-off (dominant: r = –0.79, P < .01; nondominant: r = –0.74, P < .01) and with peak flexion (dominant: r = –0.63, P < .01; nondominant: r = –0.70, P < .01) and extension (dominant: r = –0.66, P < .01; nondominant: r = –0.56, P = .01) angles during contact. In the nondominant limb, age at adult height was significantly negatively correlated with varus/valgus angle at initial contact (r = –0.43; P = .05) and toe-off (r = –0.44; P = .04) and was positively correlated with peak varus moment during contact (r = 0.42; P = .06). Age at adult height was also positively correlated with peak vertical ground-reaction force (r = 0.58; P < .01).
Conclusion:
Later age at adult height was correlated with riskier landing profiles in this study. This suggests that males with later or longer pubertal growth may have increased mechanical risk for ACL injuries. A better understanding of the effects of pubertal growth on landing biomechanics can improve the early identification of male athletes at greater risk for injuries.
Noncontact injuries to the anterior cruciate ligament (ACL) are relatively common among younger athletes, are significantly disabling, and are associated with prolonged and intensive rehabilitation after surgery. There are also long-term health consequences, including an increased risk of future injuries to the same knee, 15 a high prevalence of long-term knee pain, 7 osteoarthritis, 34 and functional impairment 10 to 20 years after the injury. 33 Additionally, there are significant financial implications over the course of an athlete’s lifetime after sustaining an ACL injury. 38 Therefore, working to prevent ACL injuries is in the best interest of the athlete.
Neuromuscular training interventions have been shown to be an effective method of reducing ACL injury risk, and their effectiveness may be age dependent. 42 Increasing prevention effectiveness requires a clear understanding of risk factors for ACL injury, which can help identify high-risk patients who might benefit from the timely initiation of interventions. 20 One such factor widely understood to affect ACL injury risk is biological sex: studies frequently report higher injury rates in female athletes compared with male athletes playing the same sports. 7,28,40,59 As with a range of sex-based differences, this disparity in ACL injury rates arises during puberty and is established by adolescence. The observed disparity in injury rates results from multiple developmental inputs. Risk factors that are elevated in females during puberty include quadriceps dominance, 45 greater ligament laxity, 17,47 narrower femoral notches, 54 and altered neuromuscular control. 43,44,46
Also emerging during puberty are a suite of biomechanical risk factors that can be ascertained from a laboratory-based drop vertical jump (DVJ) test and that have been shown to be predictive of ACL injury risk (although some results differ). 19,30 A substantial body of literature has shown that postpubertal females exhibit a tendency toward more valgus knee angles and loading than do males during the DVJ. 10,16,21,23,27,63 Greater valgus angulation and loading among females generate high frontal plane shear stress on the ACL, 26 making “valgus collapse” the most common mode of female injuries. 48 There also appears to be a relationship between the timing of pubertal development and the emergence of biomechanical risk factors in females. Previous research has shown that girls with earlier age at menarche exhibit higher valgus angles and loads during adolescence compared with their later-developing peers. 14
In contrast, within males, the tendency toward less valgus, or even varus, angulation and loading during the DVJ and other screening tests has been interpreted as protective against ACL injuries. 21,64 Nevertheless, a substantial number of adolescent and young adult male athletes sustain noncontact ACL injuries and suffer their long-term health consequences. 5,24,39,57,58 Developmental differences between males and females may point to different foci for risk screening, as primary injury mechanisms appear to differ between the sexes. Although frontal plane loading is likely important in the cause of at least some male noncontact ACL injuries, the ligament’s primary role is to limit anterior tibial translation, leading to high tensile loads in the sagittal plane. 37,67 These loads are especially high during periods of forceful quadriceps contraction 6 and when the knee is within 30° of full extension. 37
Evidence suggests that sagittal plane loading may be more important as a primary factor in male injuries than in female injuries. For example, video analysis of 30 basketball ACL injuries found that male athletes maintained a significantly more extended knee than female athletes during noncontact injuries. 29 This same pattern was found in a sample of male and female collegiate athletes with varying knee injury histories who performed a DVJ: male athletes were significantly more likely than female athletes to land with less than 30° of knee flexion. 31 Moreover, the frequency of extended landings was roughly 3 times higher in male athletes with prior severe injuries compared with uninjured peers. 31
Given the above background, we sought to explore the impact of growth timing on ACL injury risk in males. To the best of our knowledge, this has not been previously studied. If early puberty is a risk factor for ACL injuries (as it appears to be in females), then signs of male early-onset puberty could identify those at high risk, who could enter injury prevention programs. The benefits of such programs are likely not limited to females, and it is important to elucidate male-specific screening tools using data on pubertal development and ACL injury risk. 2,58 The purpose of this study was to test the hypothesis that earlier age at achieving adult height, an indicator of the timing of pubertal growth, is related to biomechanical risk factors for ACL injury in male adults. If the results support this hypothesis, it would suggest that earlier (ie, preadult) assessments of pubertal timing could potentially assist in the identification of male athletes at an increased risk for ACL injuries.
Methods
Procedures were approved by the local institutional review board before the initiation of study activities, and participants provided informed consent before data collection. Data were collected between January and November 2017. Participants were recruited using flyers, email, and word of mouth. Because of recruitment constraints, the study relied on a convenience sample of adult medical students and undergraduates aged ≥18 and ≤35 years. This recruitment pool was older than the target age of the clinical population of high school and collegiate athletes at the greatest risk for ACL injuries. Inclusion criteria also required that participants engaged in at least recreational physical activity (≥1000 MET·min/wk, assessed by a questionnaire). Participants were excluded for a history of ACL injuries, musculoskeletal diseases, mobility limitations, movement disorders, or significant musculoskeletal injuries in the past year.
Participants attended a single study visit at which they completed a questionnaire, had anthropometric data taken, and performed a series of DVJ tests. The questionnaire assessed pubertal growth by asking the participants to recall the age at which they achieved adult height. Age at achieving adult height has been strongly correlated with age at peak height velocity (PHV; n = 52; r = 0.98; P < .001) (unpublished data). Similar observations linking these variables have been reported by Roche and Sun 50,51 and by Malina and colleagues. 35 Age at PHV is a key indicator of pubertal timing, which has also been shown to be related to the onset of sex-biased biomechanical risk for ACL injury. 21 Thus, in the present study, age at achieving adult height was used as a proxy for age at PHV to assess variations in pubertal timing. Participants also answered a question about which foot they would use to kick a soccer ball, which we treated as the dominant limb. Height and sitting height were measured using a digital stadiometer, and subischial leg length was calculated as height – sitting height. Body weight was measured using a digital scale, and body mass index was calculated as kg/m2.
Kinematic and kinetic properties of the knee during the DVJ were collected using a 6-camera, 3-dimensional quantitative motion analysis system (Osprey; Motion Analysis). Cameras were set to a frame rate of 120 Hz and captured the motion of 21 retroreflective markers placed on anatomic landmarks following the Helen Hayes marker system. Cameras were synchronized with a piezoelectric force plate (Kistler Instrument) for kinetic measurements. Cortex 6.0 software (Motion Analysis) was used for data collection and postprocessing, and the MacGait 1.0 plug-in was used to calculate kinematic and kinetic variables during the contact phase of the DVJ from initial contact (IC) to toe-off (TO). Reported moments are net external moments and were calculated using inverse dynamics with normalization to body weight. The ground-reaction force (GRF) is expressed as multiples of body weight. Directional conventions for each osteokinematic motion are as follows: positive values indicate flexion and adduction (varus), and negative values indicate extension and abduction (valgus).
Before performing the DVJ, each participant completed a static trial, standing with feet shoulder width apart, to estimate joint center locations. Joint center coordinates were used to calculate additional anthropometric variables, including thigh segment length (hip joint center to knee joint center), leg segment length (knee joint center to ankle joint center), and standing static frontal plane knee angle (angle of the leg segment relative to the thigh segment axis). The crural index was calculated as (leg segment length × 100)/thigh segment length. These data were used to determine the effects of pubertal timing on segmental growth and alignment.
Performance of the DVJ involved dropping down from a plyometric box (31 cm) onto the force plate, landing with both feet simultaneously but with only 1 foot on the force plate, and immediately jumping straight upward while raising both arms as if attempting to rebound a basketball (full shoulder flexion and elbow extension with neutral wrists; no overhead goal). Before data collection, the motion was explained to the participant, and ≥1 practice jumps were performed until the participant understood how to correctly perform the motion. Each participant then performed 3 DVJ trials per limb, with a brief rest between each trial. Any trials with poor force plate contact, lack of adherence to the DVJ protocol, or poor marker recognition were discarded. Remaining trials were postprocessed and averaged for analysis of angles and moments at IC and TO in both the frontal (varus/valgus: VVIC and VVTO) and sagittal planes (flexion/extension: FEIC and FETO) as well as maximum and minimum values during the contact period (VVMAX, VVMIN, FEMAX, FEMIN) and peak vertical GRF (vGRFMAX). Data from dominant and nondominant limbs were analyzed separately, except for vGRFMAX, which was summed across limbs.
Statistical analysis was performed in SAS 9.4 (SAS Institute). From previous results in female participants, 14 we estimated a target sample size of 30 participants, providing 80% power to detect moderate Pearson r values of ≥0.50 at a significance level (alpha) of .05 (SAS Power and Sample Size; SAS Institute). Because of the exploratory nature of this study and to preserve statistical power, we did not correct for multiple comparisons. Descriptive statistics (mean ± SD) were computed for all age-related, anthropometric, and biomechanical variables. Interlimb asymmetry for each biomechanical variable was assessed with paired t tests. Pairwise Pearson product-moment correlations between anthropometric variables and between each biomechanical variable and age at achieving adult height were determined. Qualitative interpretations of correlation coefficients were as follows: weak, r ≤ 0.35; moderate, r = 0.36 to 0.67; and strong, r ≥ 0.68. 60
On the basis of the anthropometric correlation results, a secondary analysis was performed to determine relationships between body proportions, age at adult height, and landing mechanics. A single anthropometric index representing simultaneous variation in height, sitting height, thigh segment length, and leg segment length was developed using principal component analysis (eigenvalue, 79.2; variance explained, 86.6%). Higher index values indicate greater heights and longer segments, whereas lower values of the index are associated with shorter heights and segment lengths. Correlations between this anthropometric index, age at adult height, and biomechanical outcomes were analyzed.
Results
A total of 21 participants met the inclusion and exclusion criteria and completed data collection. Descriptive statistics for ages and anthropometric variables are presented in Table 1. Several anthropometric variables exhibited significant, moderate positive correlations with age at adult height (Table 2), including current height (r = 0.47; P = .03), subischial leg length (r = 0.48; P = .02), and thigh segment length (r = 0.44; P = .04). Leg segment length exhibited a nonsignificant positive trend with later age at adult height (r = 0.40; P = .07). A number of anthropometric variables were also strongly positively correlated, including height, sitting height, subischial leg length, and segment lengths (Table 2). Static frontal plane knee alignment was not significantly correlated with age at adult height or with any anthropometric variable (r ≤ 0.30 for each; P ≥ .19 for each). The anthropometric index was also significantly, moderately positively correlated with age at adult height (r = 0.46; P = .04).
Participant Characteristics (N = 41)
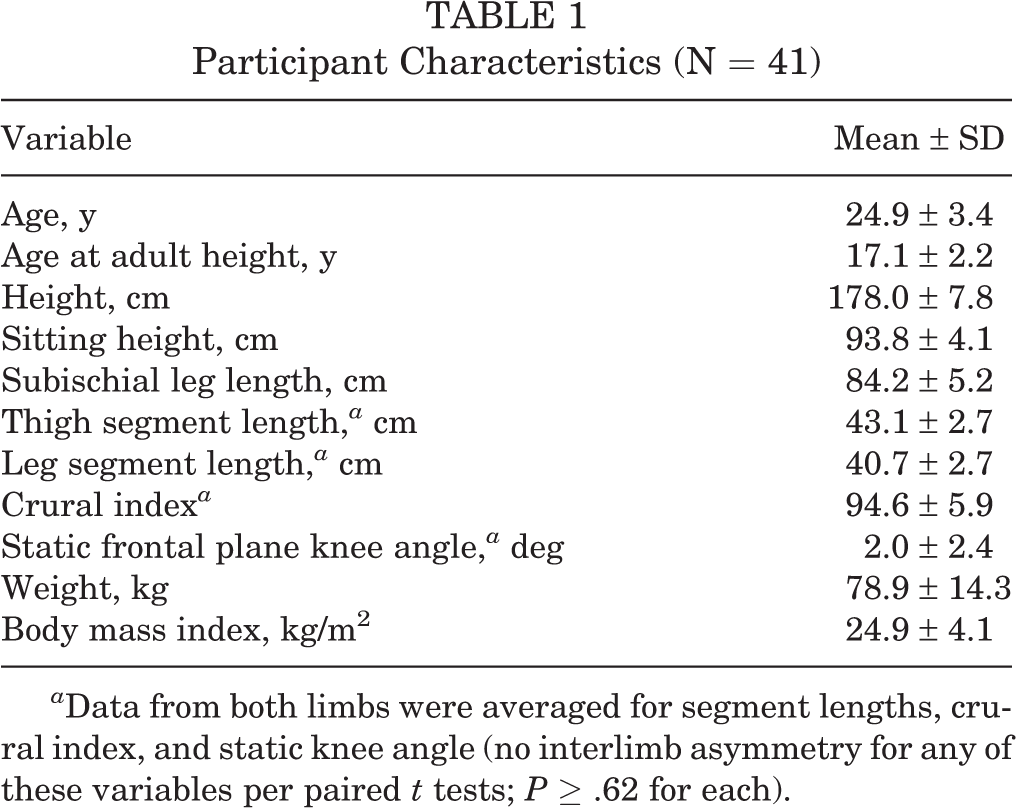
a Data from both limbs were averaged for segment lengths, crural index, and static knee angle (no interlimb asymmetry for any of these variables per paired t tests; P ≥ .62 for each).
Pearson Correlation Coefficients for Age at Adult Height and Anthropometric Variables a

aP > .05 unless otherwise indicated.
b Statistically significant: P < .05.
c Statistically significant: P < .001.
d Statistically significant: P < .01.
e For the purposes of this analysis, data from both limbs were averaged for segment lengths, crural index, and static knee angle.
Descriptive statistics for biomechanical variables are shown in Table 3. On average, participants landed with slight varus angulation and roughly 30° of knee flexion. At TO, mean frontal plane angles remained slightly varus, and flexion was reduced by approximately 7° relative to IC. Kinematic and kinetic variables showed no significant interlimb asymmetry (P ≥ .11 for each). Age at adult height was positively correlated with vGRFMAX (r = 0.58; P < .01) (Figure 1), as was the anthropometric index (r = 0.63; P < .01).
Kinematic and Kinetic Results a

a Data are shown as mean ± SD. IC, initial contact; TO, toe-off.
bP values are from paired t tests for interlimb asymmetry.
c Positive values indicate varus and negative values indicate valgus.
d Positive values indicate flexion and negative values indicate extension.
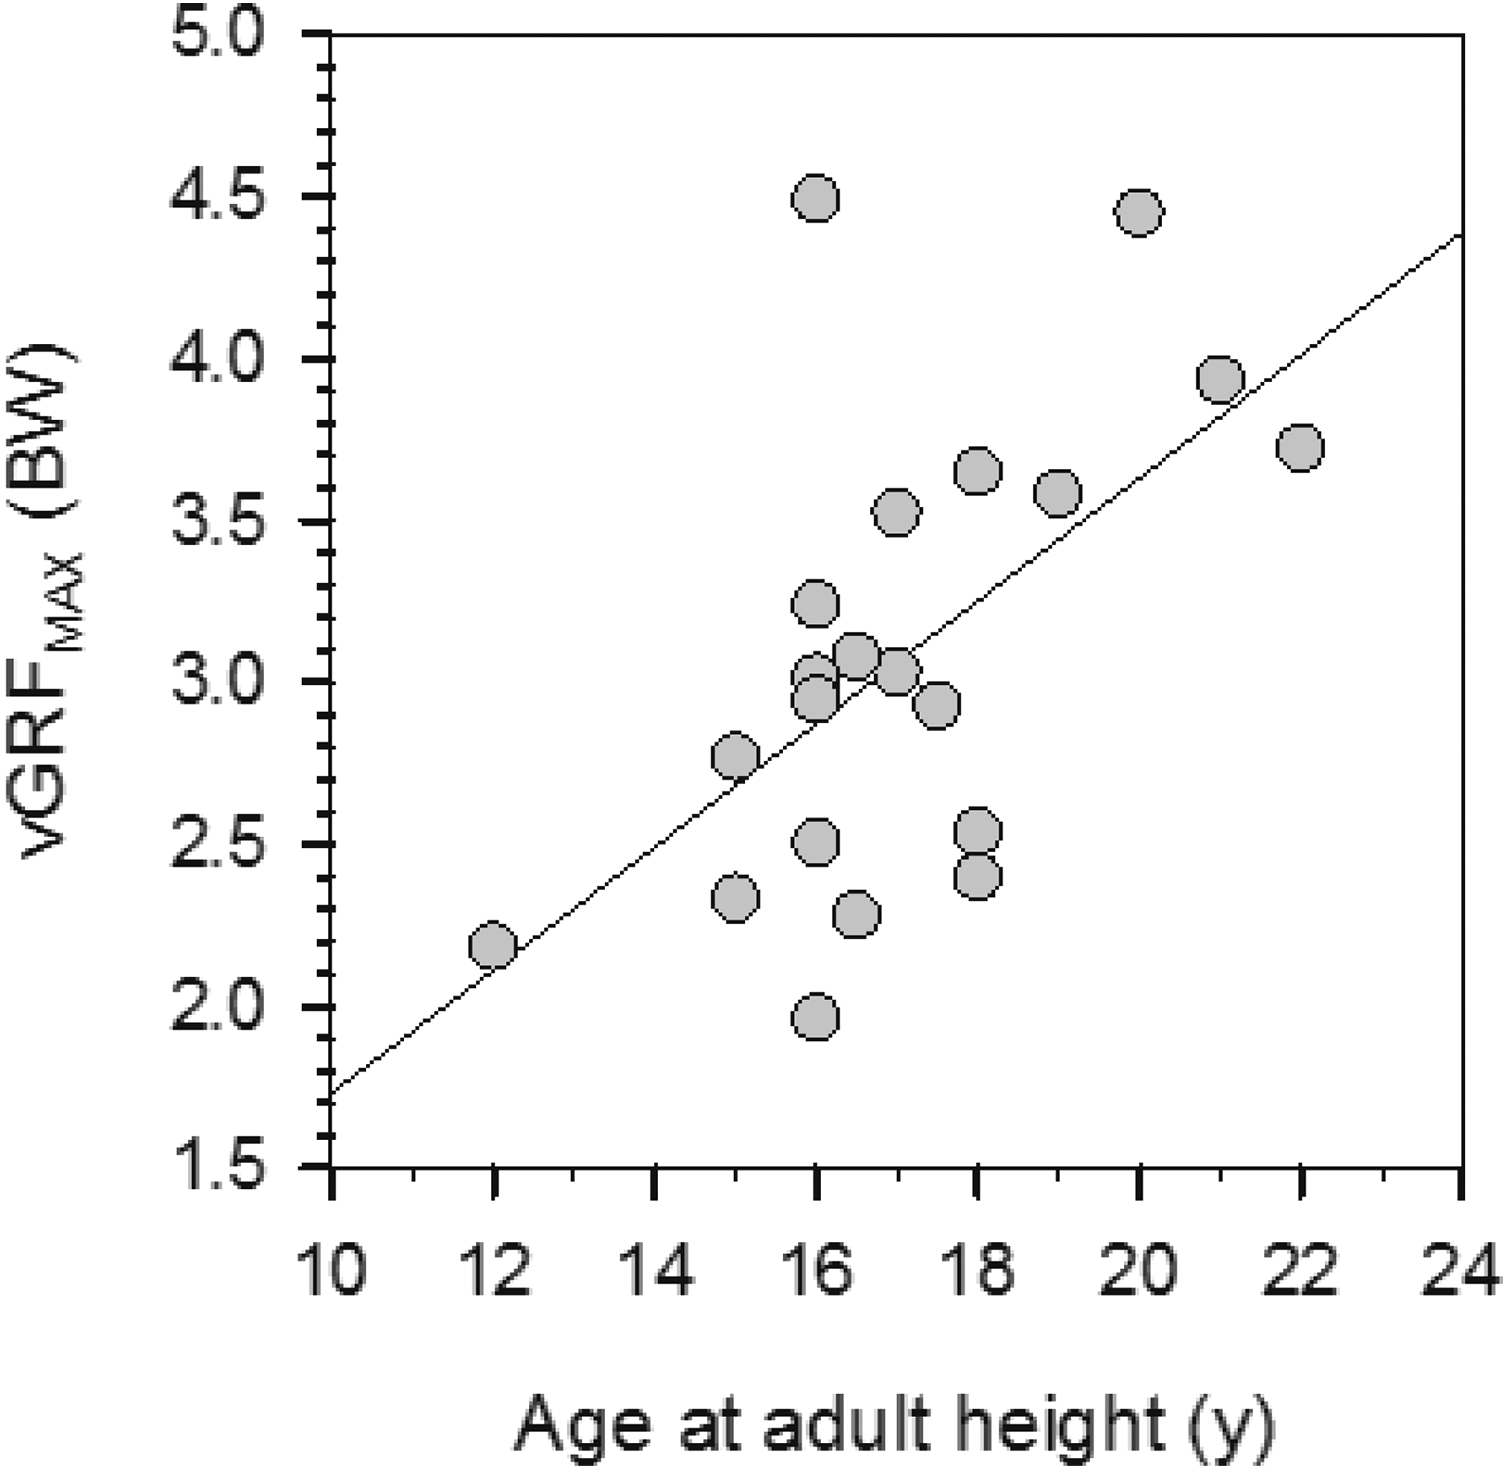
Peak vertical ground-reaction force (vGRFMAX) versus age at achieving adult height. Age at adult height was positively correlated with vGRFMAX (r = 0.58; P < .01). The line is for least squares linear regression (r 2 = 0.34). BW, body weight.
Sagittal Plane Kinematics
Sagittal plane kinematic data are plotted against age at adult height in Figure 2. In both the dominant and nondominant limbs, age at adult height was significantly negatively correlated with FE angle at TO (FETO angle: dominant: r = –0.79, P < .01; nondominant: r = –0.74, P < .01) as well as peak flexion angle (FEMAX angle: dominant: r = –0.63, P < .01; nondominant: r = –0.70, P < .01) and peak extension angle (FEMIN angle: dominant: r = –0.66, P < .01; nondominant: r = –0.56, P = .01) during contact. There were also weak trends in both limbs for less flexion at IC with later age at adult height (FEIC angle: dominant: r = –0.30, P = .18; nondominant: r = –0.28, P = .22).
Results for the anthropometric index were similar to those for age at adult height. In both limbs, the index exhibited moderate to strong negative correlations with FE angle at TO (FETO angle: dominant: r = –0.50, P = .02; nondominant: r = –0.58, P < .01) and with peak flexion angle (FEMAX angle: dominant: r = –0.52, P = .02; nondominant: r = –0.67, P < .01). In the nondominant limb, the index was also moderately negatively correlated with peak extension angle (FEMIN angle: r = –0.65, P < .01), but this correlation was not present in the dominant limb (FEMIN angle: r = –0.24, P = .29). Correlations between the index and FE angle at IC were not significant (FEIC angle: dominant: r = 0.12, P = .60; nondominant: r = –0.11, P = .63).

Plots of sagittal plane kinematics versus age at adult height. Dominant and nondominant limb data for (A and B) flexion/extension (FE) angle at initial contact, (C and D) FE angle at toe-off, (E and F) peak flexion angle during contact, and (G and H) peak extension angle during contact. Lines are for least squares linear regression. IC, initial contact; MAX, maximum; MIN, minimum; TO, toe-off.
Sagittal Plane Kinetics
Sagittal plane kinetic data are plotted against age at adult height in Figure 3. In both limbs, age at adult height was, at most, weakly correlated with FE moment at IC (FEIC moment: dominant: r = 0.09, P = .69; nondominant: r = 0.28, P = .23) and similarly with peak extension moment (FEMIN moment: dominant: r = –0.03, P = .90; nondominant: r = –0.14, P = .56). Peak flexion moment exhibited moderate positive correlations with age at adult height in both limbs (FEMAX moment: dominant: r = 0.31, P = .18; nondominant: r = 0.36, P = .11). Knee FE moment at TO was moderately negatively correlated with age at adult height in the dominant limb (r = –0.39; P = .11) and weakly in the nondominant limb (r = –0.11; P = .65). However, none of these relationships were statistically significant. For both limbs, the anthropometric index exhibited significant, moderate positive correlations with peak flexion moment (FEMAX moment: dominant: r = 0.59, P < .01; nondominant: r = 0.63, P < .01) but not with any other sagittal plane kinetic variables (r ≤ 0.37 for each; P ≥ .10 for each).

Plots of sagittal plane kinetics versus age at adult height. Dominant and nondominant limb data for (A and B) flexion/extension (FE) moment at initial contact, (C and D) FE moment at toe-off, (E and F) peak flexion moment during contact, and (G and H) peak extension moment during contact. Lines are for least squares linear regression. IC, initial contact; MAX, maximum; MIN, minimum; TO, toe-off.
Frontal Plane Kinematics
Frontal plane kinematic data are plotted against age at adult height in Figure 4. In the dominant limb, each of the frontal plane kinematic variables was, at most, weakly correlated with age at adult height (VVIC: r = 0.18, P = .43; VVMIN: r = –0.05, P = .83; VVMAX: r = 0.01, P = .99; VVTO: r = –0.08, P = .75). In the nondominant limb, age at adult height was moderately and significantly negatively correlated with VV angle at IC and TO (VVIC: r = –0.43, P = .05; VVTO: r = –0.44, P = .04). In contrast, peak varus and peak valgus angles in the nondominant limb exhibited essentially no correlations with age at adult height (VVMIN: r = 0.01, P = .97; VVMAX: r = –0.01, P = .96). Anthropometric index results mirrored those for age at adult height. In the nondominant limb, the index exhibited significant, moderate negative correlations with VV angle at IC and TO (VVIC: r = –0.51, P = .02; VVTO: r = –0.65, P < .01). No other frontal plane kinematic variables were significantly correlated with the anthropometric index (r ≤ 0.37 for each; P ≥ .10 for each).

Plots of frontal plane kinematics versus age at adult height. Dominant and nondominant limb data for (A and B) varus/valgus (VV) angle at initial contact, (C and D) VV angle at toe-off, (E and F) peak varus angle during contact, and (G and H) peak valgus angle during contact. Lines are for least squares linear regression. IC, initial contact; MAX, maximum; MIN, minimum; TO, toe-off.
Frontal Plane Kinetics
Frontal plane kinetic data are plotted against age at adult height in Figure 5. There was a moderate positive correlation between peak varus moment during contact and age at adult height in the nondominant limb (VVMAX moment: r = 0.42, P = .06). Remaining frontal plane kinetic variables exhibited only weak associations with age at adult height (r ≤ 0.18 for each; P ≥ .43 for each). None of the frontal plane kinetic variables were significantly correlated with the anthropometric index (r ≤ 0.27 for each; P ≥ .23 for each).
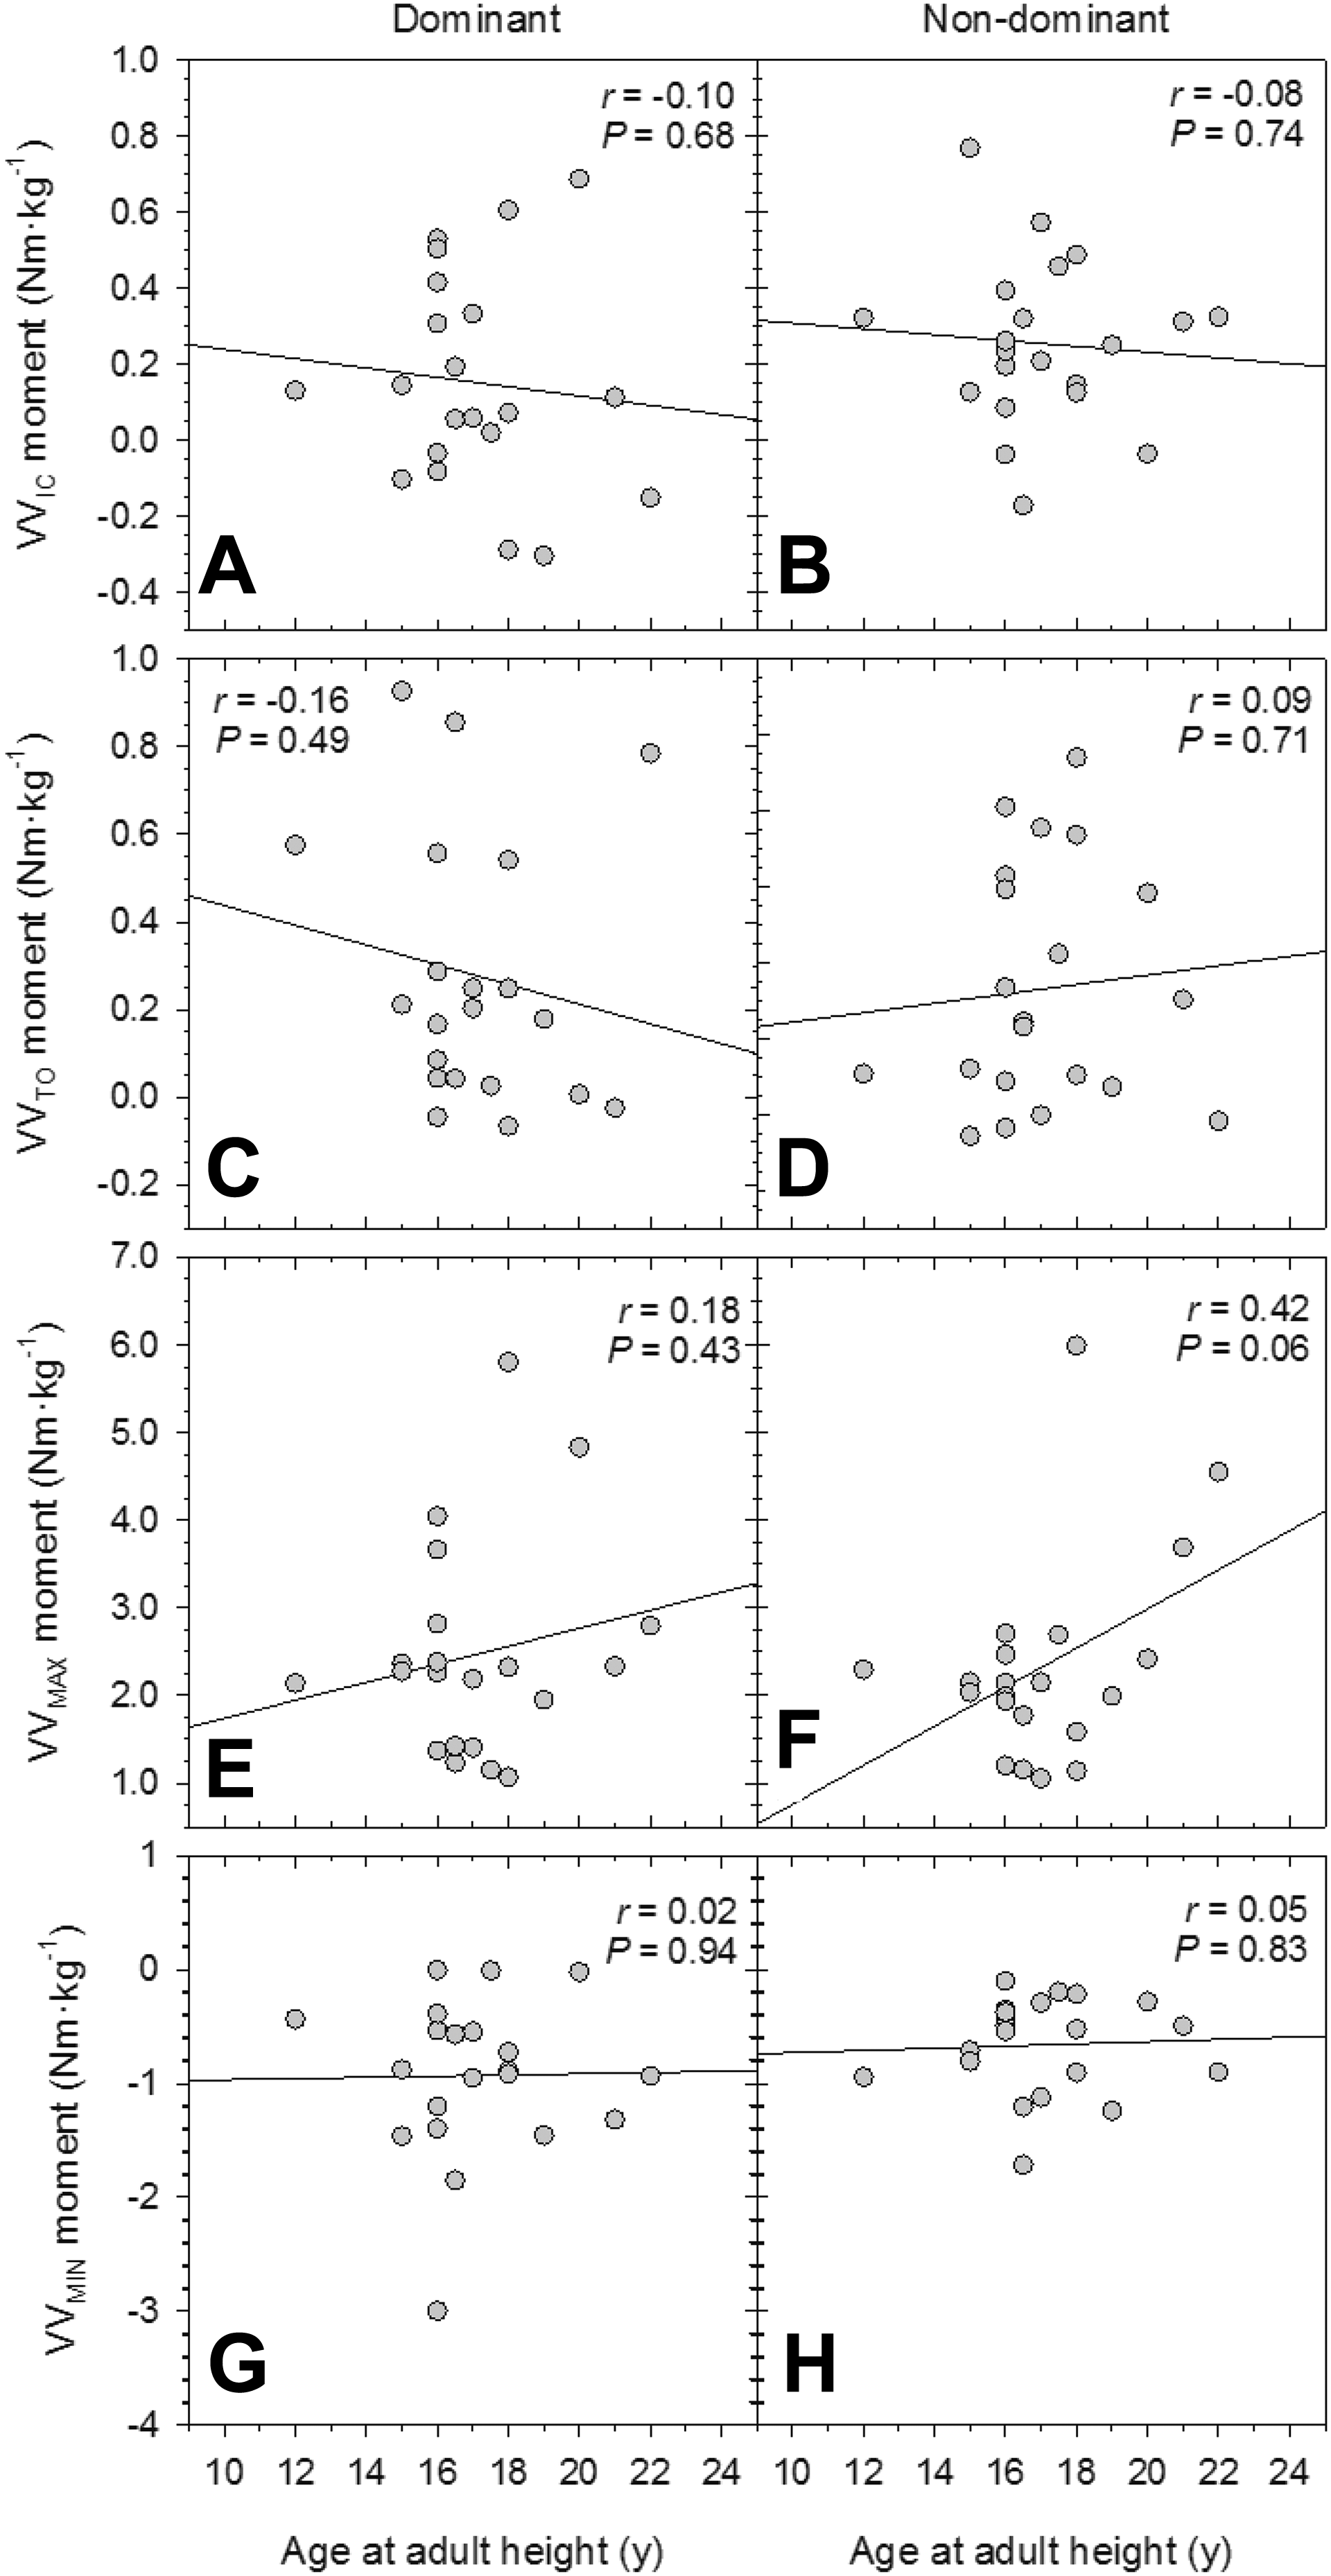
Plots of frontal plane kinetics versus age at adult height. Dominant and nondominant limb data for (A and B) varus/valgus (VV) moment at initial contact, (C and D) VV moment at toe-off, (E and F) peak varus moment during contact, and (G and H) peak valgus moment during contact. Lines are for least squares linear regression. IC, initial contact; MAX, maximum; MIN, minimum; TO, toe-off.
Discussion
The present study explored the relationship between pubertal development and DVJ biomechanics associated with ACL injury risk in men. Our hypothesis was that earlier pubertal development would be related to elevated injury risk, following our previous research in female participants. 14 The results did not support this hypothesis. Instead, we found significant relationships in the opposite direction: later-developing males exhibited a suite of biomechanical characteristics consistent with elevated ACL injury risk. This runs counter to expectations but is not entirely surprising given other substantial peripubertal and postpubertal developmental and biomechanical differences between males and females. Furthermore, results of the secondary analysis of anthropometric data suggest that, in males, the effects of growth timing on biomechanical outcomes are closely related to effects on overall height and segment lengths.
Jump performance results in this study were generally consistent with previous research. Past studies of young males and adult males (age range, 10-27 years) have shown peak knee flexion angles ranging from approximately 75° to 95° and peak valgus angles from –1° to –4°. 8,21,32 Our participants’ means fell approximately in the middle of both of these ranges, and the mean flexion angle at IC was similar to that of male adults in previous research. 32 Our participants also exhibited similar knee flexion values compared with a meta-analysis of female DVJs 12 both at IC (female: ∼28°) and for the peak value during contact (female: ∼83°). In the frontal plane, however, our participants were consistently less valgus, on average, than females at IC (female: –0.3°) as well as for the peak value during contact (female: –8.7°). Even later-developing males, who had a tendency toward greater valgus angulation in the nondominant limb, did not reach female levels.
In terms of anthropometric traits reflective of the timing and duration of growth, the results of this study mirrored those of previous work in females. Later age at adult height was positively correlated with greater height, longer subischial leg lengths, and longer lower limb segments. In contrast to females, however, in which earlier puberty was associated with more valgus static knee alignment, 14 in males there was only a weak trend toward more valgus static alignment with later development (not statistically significant). The tendency toward more valgus alignment, however, was more pronounced under the dynamic conditions of the DVJ. Later-developing male participants had significantly more valgus alignment in the nondominant limb at IC and TO, coupled with a tendency for higher peak varus moments during contact. These same relationships were absent in the dominant limb, and this does not appear to be an issue of statistical power, as the effect sizes were quite small (less than half of the nondominant limb’s moderate effects).
This finding contrasts with previous results in females in which earlier developing participants coupled greater valgus angulation with higher valgus moments at IC and in their dominant limb. It is possible that sex-specific patterns of lateral and medial muscle contraction 43,44 explain these differences in laterality, but it is beyond this study’s scope to address that hypothesis. It is also unclear why the relationship would be observed in the nondominant limb, but not the dominant limb, in males. A possible explanation is that the nondominant limb is more frequently or actively involved in postural support and stabilization. 52 Part of this adaptation may be a tendency for more valgus alignment of the nondominant limb, which is advantageous for stability in that it brings the single limb base of support more directly under the center of gravity. The advantage may be greater in longer legged individuals with higher centers of gravity, as in our sample’s later-developing males.
The above frontal plane factors may be less relevant to men in any case because it appears that valgus collapse is less frequently the cause of ACL injuries in males than in females. 21,29,31,64 Instead, sagittal plane mechanisms contribute more often to male ACL injuries, specifically in the form of greater knee extension and stiffer (ie, more extended) lower limb posture during ground contact. As with frontal plane mechanics, later age at adult height in our male sample was associated with riskier sagittal plane landing strategies. Across the contact period, later-developing male participants tended to maintain stiffer, more extended knees, including at IC (although not statistically significant) and TO, along with smaller peak flexion and greater peak extension angles during contact. This pattern suggests greater and possibly earlier activation of the quadriceps overall to maintain a less flexed knee, which increases tensile loading of the ACL. This is also consistent with higher vGRFMAX among later developers as well, produced by the transmission of greater quadriceps muscular force into the ground.
The anthropometric index results suggest that observed relationships between age at adult height and DVJ biomechanics are at least in part a consequence of the effects of developmental timing on height and segment lengths. The anthropometric index derived from this sample was such that higher index values were related to greater height, greater sitting height (ie, longer trunk segment), and longer thigh and leg segment lengths. Age at adult height was positively correlated with the index, and correlations between DVJ mechanics with age at adult height and with the index were almost identical. Longer lower extremity lever arms have been associated with higher joint loads. 49 Furthermore, studies have shown moderate positive correlations between thigh segment length and knee extension moment 62 as well as between stature and knee extensor strength in male adults. 56 Thus, a longer period of growth resulting in greater stature and longer thigh segment lengths may manifest as greater quadriceps strength and thus a tendency toward greater extension during landing. Additionally, taller participants with longer segments also tended to experience higher peak external flexion moments, which may have resulted in stronger quadriceps activation to better control the landing.
On the other hand, it is also reasonable to suspect that greater stature or thigh length should have similar effects on hamstring strength, which would in theory balance out increased quadriceps strength. In that case, longer/later growth would not easily explain the observed tendency toward greater extension. Another possibility is that the variation in circulating sex steroid hormones (androgens and estrogens) during and after puberty also has effects on relative hamstring and quadriceps strength. There are well-known effects of sex steroid hormones on pubertal timing and skeletal growth, and substantial evidence points to a role for these hormones in sex differences in the neuromuscular development of the thigh. 66 It stands to reason that variation within each sex in relative levels of androgens and estrogens may also contribute to variability within each sex in these same developmental outcomes.
Generally speaking, female adults tend to have weaker hamstrings relative to their quadriceps (quadriceps dominance) compared with male adults, who have more balanced hamstring-to-quadriceps (H:Q) ratios. 9,18 Before puberty, males and females do not differ for overall hamstring or quadriceps strength, nor for the H:Q ratio. 1,18 With the onset of puberty and divergence in typical androgen and estrogen levels, males, on average, develop considerably stronger quadriceps and hamstrings, while females tend to increase quadriceps strength more moderately and exhibit even more modest increases in hamstring strength. 1,18 Female deficits in hamstring strength are particularly pronounced at higher angular velocities, 9,22 which are typical of sports participation, and at knee angles closer to full extension, when ACL injuries most commonly occur. 9 Moreover, females who have sustained ACL injuries have particularly weak hamstrings, even versus other female peers, while simultaneously exhibiting quadriceps strength at levels similar to males. 41 Reduced relative hamstring strength likely contributes to riskier, more extended landings during DVJs 41 and has also been shown to contribute to frontal plane instability, 65 both of which increase combined ACL loading.
Males, similar to females, may exhibit variations in H:Q ratios because of variation in hormonal profiles. It is possible that interindividual variation in androgen and estrogen levels during male development results in linked variation in skeletal growth, neuromuscular development, and muscle activation patterns during physical activity. Although we are not aware of any studies specifically testing this hypothesis, available data suggest that there are complex interactions between androgens, estrogens, and growth hormones. 11,13,61 These interactions are in turn related to age at PHV and the timing of other key events in pubertal growth 25,55 as well as trade-offs between long bone linear growth and the timing of epiphyseal closure. 4,13,36,53,55 A recent study showed that testosterone supplementation positively affects peak internal knee flexion and extension torques, with proportionally greater effects on knee flexion torque than on extension torque. 3 Thus, variations in testosterone may contribute to variability in the H:Q ratio and, by extension, sagittal plane knee kinematics during landing and jumping. Although we did not measure hormone level, or thigh muscle activity and strength in the present study, these are potentially important targets of future research that may help explain the observed results.
The limitations of this study include a relatively small sample: recruitment challenges and time constraints led to the study falling short of its target sample of 30 participants, which may have limited statistical power for some analyses. Additionally, this was an observational, cross-sectional study of healthy adults, and thus, the results cannot speak directly to considerations of injury risk during puberty. The recall of age at achieving adult height incorporates some degree of measurement error, and this variable was being used as a proxy for age at PHV, which may be more relevant to biomechanical outcomes. 21 Additionally, the age range of our participants was older than that of the clinical target population, which may diminish the ecological validity of the study’s results. Finally, discussion points with regard to muscle activation patterns were inferred from observed kinematics and kinetics rather than directly assessed using electromyography.
Conclusion
Our conclusions are correspondingly tempered in light of the limitations detailed above, and we consider the results of this study to be hypothesis generating more than a demonstration of clear support for a particular hypothesis. Complex interactions between skeletal growth, neuromuscular maturation, and pubertal timing still need to be unpacked with regard to how they affect intersex differences, as well as intrasex variation, in ACL injury risk. The present study, however, offers an important first step in that process by presenting pilot data that demonstrate relationships between estimated age at adult height, growth outcomes, and DVJ biomechanics. That similar results (albeit in the opposite direction) have also been found in females suggests that further study of the effects of variation in pubertal timing on ACL injury risk is warranted. Clinically, a more complete understanding of how variability in pubertal growth affects adolescent and young adult body proportions and biomechanical outcomes could be crucial to developing better screening tools and training interventions. If pubertal growth markers provide early indicators of future risk, such interventions can be implemented at the outset of a young athlete’s career, ideally reducing ACL injury risk as they complete growth and begin to engage in higher levels of competition.
Footnotes
Acknowledgment
The authors thank the study participants.
Final revision submitted March 18, 2020; accepted March 26, 2020.
One or more of the authors has declared the following potential conflict of interest or source of funding: This project received financial support from the Dayton Area Graduate Medical Education Community (DAGMEC) and Wright State University’s Boonshoft School of Medicine (BSOM). DAGMEC funds were used to cover participant compensation costs as well as nonreusable laboratory supplies. Wright State University’s BSOM funds covered laboratory maintenance and licensing costs during the project. Z.D. received educational support from CDC Medical, grant support from Arthrex, and hospitality payments from Zimmer Biomet. AOSSM checks author disclosures against the Open Payments Database (OPD). AOSSM has not conducted an independent investigation on the OPD and disclaims any liability or responsibility relating thereto.
Ethical approval for this study was obtained from Wright State University (reference No. 3406).