
Abstract
Background:
Reversibility of rotator cuff atrophy after surgical repair is controversial. Traditionally, the cross-sectional area (CSA) of the rotator cuff was measured in conventional Y-view (CYV) via magnetic resonance imaging (MRI) to evaluate reversibility. However, it has been suggested that scanning axis inconsistency in CYV was overlooked and that the CSA in CYV reflects not only atrophy but also rotator cuff retraction.
Hypothesis:
Discrepancies between scanning axes in CYV cause significant errors when one is evaluating changes in the CSA of the supraspinatus (SS) using preoperative and postoperative MRI scans. A more medial section than the Y-view is not influenced as much by retraction recovery after repair.
Study Design:
Cohort study (diagnosis); Level of evidence, 3.
Methods:
The study included 36 patients with full-thickness SS tear and retraction who underwent arthroscopic complete repair with preoperative MRI and immediate postoperative MRI (within 5 days after rotator cuff repair). Angles between CYV planes in the preoperative and immediate postoperative MRI scans were measured. MRI scans were reconstructed perpendicular to the scapular axes by multiplanar reconstruction. Differences between the CSAs of the SS in preoperative and postoperative Y-view on the original and reconstructed MRI scans were compared, and changes in CSAs of the SS muscles after repair in 2 sections medial to the reconstructed Y-view (RYV) were compared.
Results:
The mean angle between CYV planes in preoperative and postoperative MRI scans was 13.1° ± 7.1°. Mean pre- to postoperative increase in the CSA of the SS was greater in CYV than in RYV (95 ± 72 vs 75 ± 62 mm2; P = .024). Furthermore, pre- to postoperative CSA differences in the 2 medial sections were less than in RYV. For the most medial section, crossing the omohyoid origin, the CSA differences were not significant (434 ± 98 vs 448 ± 98 mm2; P = .061).
Conclusion:
Scanning axes inconsistencies in CYV cause unacceptable errors in CSA measurements of the SS after repair. We recommend reconstruction along a consistent axis by multiplanar reconstruction when evaluating postoperative changes in SS atrophy and the use of sections more medial than the scapular Y-view to reduce errors caused by tendon retraction.
Atrophy of the rotator cuff is one of the most important prognostic factors of anatomic and clinical results after surgical repair. 1,10,12,13,23,25 Many researchers have studied the effect of preoperative atrophy in rotator cuff tear on outcomes after surgical repair, but relatively less attention has been paid to its reversibility after repair. However, postoperative reversibility of atrophy should be considered to predict the outcome after rotator cuff repair more accurately. Furthermore, detailed information about reversibility of atrophy would make it possible to refine the surgical indication for rotator cuff repair. Therefore, some researchers have tried to determine whether atrophy reversal occurs after rotator cuff repair by describing postoperative change of atrophy, but reports disagree as to whether atrophy is reversible 2,9,26,29 or not. 6,11,13,14,21
Traditionally, atrophy of the rotator cuff muscle has been evaluated by the cross-sectional area (CSA) measured at the scapular Y-view (the most lateral section, where the scapular spine contacts the body) on oblique-sagittal, T1-weighted magnetic resonance imaging (MRI) scans. 7,12,19,24,31 Lehtinen et al 20 revealed that the CSA of the rotator cuff in the scapular Y-view is highly correlated with actual rotator cuff muscle volume. Generally, setting a scanning axis is performed by a technician using a scout image but can result in the use of different axes and can cause substantial errors in rotator cuff CSA measurements, especially when the CSAs obtained at different times are compared. Previous studies that used conventional the Y-view (CYV) to evaluate the reversibility of rotator cuff atrophy after repair did not consider scanning axis discrepancies, ‡ and we believe that these discrepancies may explain differences in the results of previous studies on atrophy changes after rotator cuff repair.
Previous studies have another limitation in that rotator cuff CSAs on preoperative and postoperative MRI scans (obtained months or even years after surgery) were simply compared and, thus, immediate changes in the CSA caused by the elimination of tendon retraction after surgery were overlooked. Recently, it has been reported that immediate postoperative changes caused by repair and reduction of retracted rotator cuffs to their original anatomic position can increase the CSAs in the scapular Y-view in the absence of a volumetric muscle change. 15,17,18,28 Therefore, we considered it important that the confounding effect of tendon retraction be eliminated when examining changes in rotator cuff atrophy after repair. An alternative was suggested in the studies by Yoo et al 30 and Fukuta et al, 8 who found that sections more medial than the scapular Y-view were less influenced by retraction. We believe that measurement of rotator cuff CSAs using such sections might provide a way of eliminating the confounding effect of tendon retraction.
The first hypothesis of this study was that discrepancies between scanning axes in CYV cause significant errors when one is evaluating changes in the CSA of the supraspinatus (SS) using preoperative and postoperative MRI scans. The second hypothesis was that there is a more medial oblique-sagittal section than scapular the Y-view in which the CSA of the SS does not change immediately after repair, if evaluated by a more consistent scanning axis.
Methods
Patient Selection and Demographics
In this prospective case series, conducted from January 2015 to May 2016, we performed MRI after rotator cuff repair on consecutive patients who (1) had a full-thickness rotator cuff tear and retraction beyond the vertex of the humeral head (Patte grade 2 or higher) 27 confirmed by preoperative MRI and (2) underwent arthroscopic complete rotator cuff repair. Inclusion criteria were established to evaluate the effect of tendon retraction on measurement of the CSA of the SS. We excluded patients who had (1) a full-thickness subscapularis tear, (2) any previous shoulder surgery, (3) incomplete repair or medialization of repair, or (4) commitment interval slide or marginal convergence procedure. Exclusion criteria were adopted to eliminate possible confounders. A total of 46 patients were initially included and underwent immediate postoperative MRI (ie, within 5 days of surgery), but we subsequently excluded 10 patients whose preoperative or immediate postoperative MRI scans had insufficient medial side coverage for multiplanar reconstruction. Accordingly, 36 patients constituted the study cohort, and we reviewed 72 shoulder MRI scans (36 preoperative scans and 36 immediate postoperative scans). The institutional review board of our institute approved this study.
There were 16 male and 20 female patients and 29 right and 7 left shoulders. Mean ± SD patient age was 64 ± 5 years, and ages ranged from 55 to 82 years. Preoperative MRI scans showed that all 36 shoulders had a complete SS tear. The retraction grades of the SS were determined via the Patte classification 27 on oblique-coronal T2-weighted MRI scans, in which grade 1 refers to a retracted stump close to the bony insertion, grade 2 to a retracted stump beyond the vertex of the humeral head, and grade 3 to a retracted stump beyond the level of the glenoid. There were 30 cases of grade 2 and 6 cases of grade 3 retraction.
Fatty infiltration of the SS, determined through use of the Fuchs et al 7 and Goutallier et al 12 classification, was grade 0 in 2 cases, grade 1 in 9 cases, grade 2 in 22 cases, grade 3 in 3 cases, and grade 4 in 0 cases. All radiologic evaluations of preoperative MRI scans were performed by use of archived radiologic reports, which were doubly or triply confirmed by musculoskeletal radiologists not otherwise involved in the study.
Preoperative and Immediate Postoperative MRI Acquisition
Since January 2011, extended T1-weighted oblique-sagittal images have been used for routine shoulder MRI evaluations at our institution. These images extend scan coverage to the medial border of the scapula and make it possible to cover the far medial portion of the rotator cuff muscles beyond the CYV.
At our institution, preoperative MRI is a routine protocol for patients who undergo rotator cuff repair. Of the 36 preoperative MRI scans in the present study, 34 were obtained at our institution, and 2 were obtained at outside institutions. All authors agreed to include these 2 MRI scans after checking their coverage for reconstruction. All immediate postoperative MRI scans were subject to the same protocol used for routine shoulder MRI at our institution. All shoulder MRI examinations were performed with a 1.5-T or 3.0-T MRI scanner with dedicated shoulder coils with 3-mm slice thickness. Of the 36 preoperative MRI scans, 11 were obtained via 1.5-T MRI and 25 were obtained via 3.0-T MRI; of the 36 postoperative MRI scans, 29 were obtained by 1.5-T MRI and 7 by 3.0-T MRI. No difference in results regarding the CSA of the SS was detected between cases using 1.5-T MRI versus 3.0-T MRI (data not shown).
All of the postoperative MRI scans were obtained at a maximum of 5 days after rotator cuff repair. The mean time from preoperative to postoperative MRI was 34 ± 32 days (range, 2-128 days). No immediate failure of repair was detected.
Radiologic Measurement of the CSA of the SS and MRI Reconstruction
All measurement and reconstruction were performed by 2 orthopaedic surgeons (Y.H.J. and H.J., with 7 and 5 years of orthopaedic experience, respectively), under the supervision by the senior author (S.H.K.), who had more than 10 years of experience of treating shoulders after fellowship training.
As shown in Figure 1, the CSAs of the SS in CYV were measured by drawing SS boundaries on the most lateral oblique-sagittal T1-weighted MRI scan in which the scapular spine was in contact with the scapular body, using the CSA measuring tool in a picture archiving and communications system workstation.
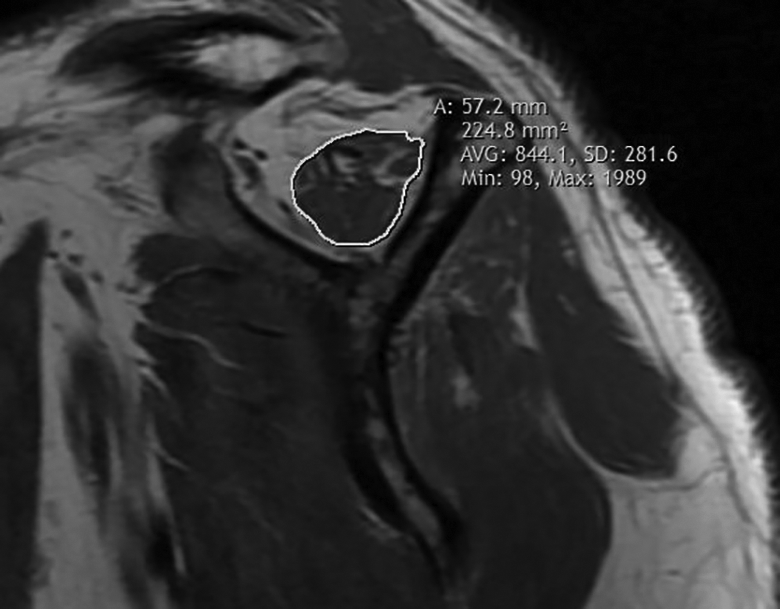
Measurement of the cross-sectional area of the supraspinatus in conventional Y-view.
Multiplanar reconstruction was used to reconstruct 36 pairs (pre- and postoperative) of oblique-sagittal T1-weighted MRI scans perpendicular to a redefined scapular axis. Image reconstruction was performed by use of 3D Slicer version 4.10.2 software (a National Institutes of Health–funded open source software package for image analysis; http://www.slicer.org). 4 Instead of using the Friedman line (the line between the center of the glenoid and the medial border of scapular spine), which is commonly used as a scapular axis, 5 we decided to define a new scapular axis to include MRI scans with less coverage. Because a full MRI scan of the whole scapula is needed to define the Friedman line, we set a scapular axis from a point on the base of the scapular spine (point A) to a point on the spinoglenoid notch (point B) (Figure 2). To ensure reproducibility, point A was defined as the centroid of the virtual triangle formed by the bony contour of the scapular base in the most medial section, in which the base of the scapular spine is triangular on oblique-sagittal MRI scans. A detailed explanation of how to identify these 2 points is provided in the online Video Supplement. Using the “endoscopy” and “volume reslice driver” modules of 3D Slicer, we obtained reconstructed oblique-sagittal T1-weighted MRI scans and then measured the CSAs of the SS in reconstructed Y-view (RYV) as performed in CYV. We also measured the angle between the planes in CYV on preoperative and immediate postoperative MRI scans (Figure 3).

Reconstruction of oblique-sagittal T1-weighted magnetic resonance images perpendicular to the new scapular axis. Superior view of the left scapula. The cube in the lower right corner indicates the orientation: A, anterior side; L, lateral side; S, superior side. Point A is on the base of the scapular spine and point B on the spinoglenoid notch. Line AB forms a new scapular axis. The cross-sectional areas of the supraspinatus were measured in 3 sections perpendicular to the axis.

Measurement of the angle between planes in conventional Y-view in preoperative and immediate postoperative magnetic resonance imaging (MRI) scans. The cube in the lower right corner indicates the orientation: L, lateral side; P, posterior side; S, superior side. The green plate represents the plane of the conventional Y-view for preoperative MRI and the red plate that for postoperative MRI. Two yellow lines are drawn perpendicular to each plate. The angle between the 2 yellow lines is equivalent to the angle between the planes in conventional Y-view in preoperative and postoperative MRI scans.
To check intraobserver reliability, 1 author (Y.H.J.) repeated the axis reconstruction and remeasured the CSAs of the SS in RYV on preoperative and immediate postoperative MRI scans after 4 weeks from the initial measurements, while being blinded to the first measurements. To check interobserver reliability, another author (H.J.) independently performed the axis reconstruction and measured the CSAs of the SS in RYV on preoperative and immediate postoperative MRI scans.
A further 2 measurements of the CSA of the SS (CSA2, CSA3) were obtained at the medial 2 sections on reconstructed oblique-sagittal MRI scans: a section crossing the deepest point of the suprascapular notch, and a section at the medial edge of the origin of the omohyoid muscle (Figure 4). Thus, CSA1 refers to the CSA of the SS measured in RYV, CSA2 refers to that in the section crossing the suprascapular notch, and CSA3 refers to that in the section crossing the omohyoid origin. An example of the reconstruction and comparison is presented in Figure 5.

The omohyoid muscle on a reconstructed oblique-sagittal magnetic resonance image. Consecutive sections from lateral to medial sides (from A to D) in reconstructed oblique-sagittal images, showing the omohyoid attachment to the superior border of the scapula. Asterisks indicate the omohyoid muscle. (D) is the most medial section that did not show omohyoid attachment to the scapula; in this section, supraspinatus cross-sectional area was measured as shown in Figure 1 (the section crossing the medial edge of the origin of the omohyoid).

(A) Conventional Y-view, (B) reconstructed Y-view, and (C and D) 2 medial sections on reconstructed oblique-sagittal images of a preoperative magnetic resonance imaging (MRI) scan (left) and an immediate postoperative MRI scan (right).
Surgical Procedures
All surgical procedures were conducted by 1 author (S.H.K.). The single-row technique was used for all repairs. Reparability was carefully checked for large to massive tears. If mobilization was needed, bursal and articular sides were released and the interval slide technique was not used. Margin convergence was not performed in any case. Incomplete repair was defined as incomplete coverage of the footprint. These cases were not included in the present study.
Statistical Analysis
Statistical analyses were performed via SPSS (Version 25.0; IBM SPSS Statistics). The analysis was performed through use of the Student paired t test. Intraobserver and interobserver reliabilities were evaluated via intraclass correlation coefficients (ICCs) using a 2-way random model with absolute agreement. All reported P values were 2-sided, and statistical significance was accepted for P values less than .05. Post hoc power analysis was performed by use of a 2-tailed test and an alpha = .05. G*power version 3.1.9.4 software 3 was used for calculations.
Results
Intraobserver and interobserver reliabilities expressed as ICCs are shown in Table 1. Both observer reliabilities were highly consistent in terms of preoperative and immediate postoperative measurements of the CSA of the SS in RYV.
Intra- and Interobserver Reliabilities for the Reconstruction and Measurement of the Cross-sectional Area (CSA) of the Supraspinatus (SS) in Scapular Y-View a

a Reliability was calculated by use of intraclass correlation coefficients (ICCs). Observer 1 was Y.H.J. and observer 2 was H.J. Observer 1-1 refers to the first measurement by observer 1, and 1-2 refers to the second measurement taken 4 weeks later. Results are presented as mean ± SD; MRI, magnetic resonance imaging.
b Analyses were conducted by use of a 2-way random model with absolute agreement.
The mean ± SD angle between the CYV plane in preoperative and immediate postoperative MRI scans was 13.1° ± 7.1° (range, 0.8°-32.7°).
As shown in Table 2, the CSAs of the SS measured in CYV were significantly greater than in RYV on both preoperative and immediate postoperative MRI scans. The mean preoperative to postoperative difference between CSAs of the SS in CYV was 95 ± 72 mm2, whereas that in RYV was 75 ± 62 mm2, Pre- to postoperative CSA differences for the 36 patients are provided in Figure 6.
Cross-sectional Area (CSA) of the Supraspinatus (SS) as Determined by the 2 Measurement Methods a

a Results are presented as mean ± SD (95% CI). CSA1, CSA measured in the scapular Y-view; MRI, magnetic resonance imaging.
b Analyses were conducted with the paired Student t test.
c Analyses were conducted via a 2-tailed test with alpha = .05.
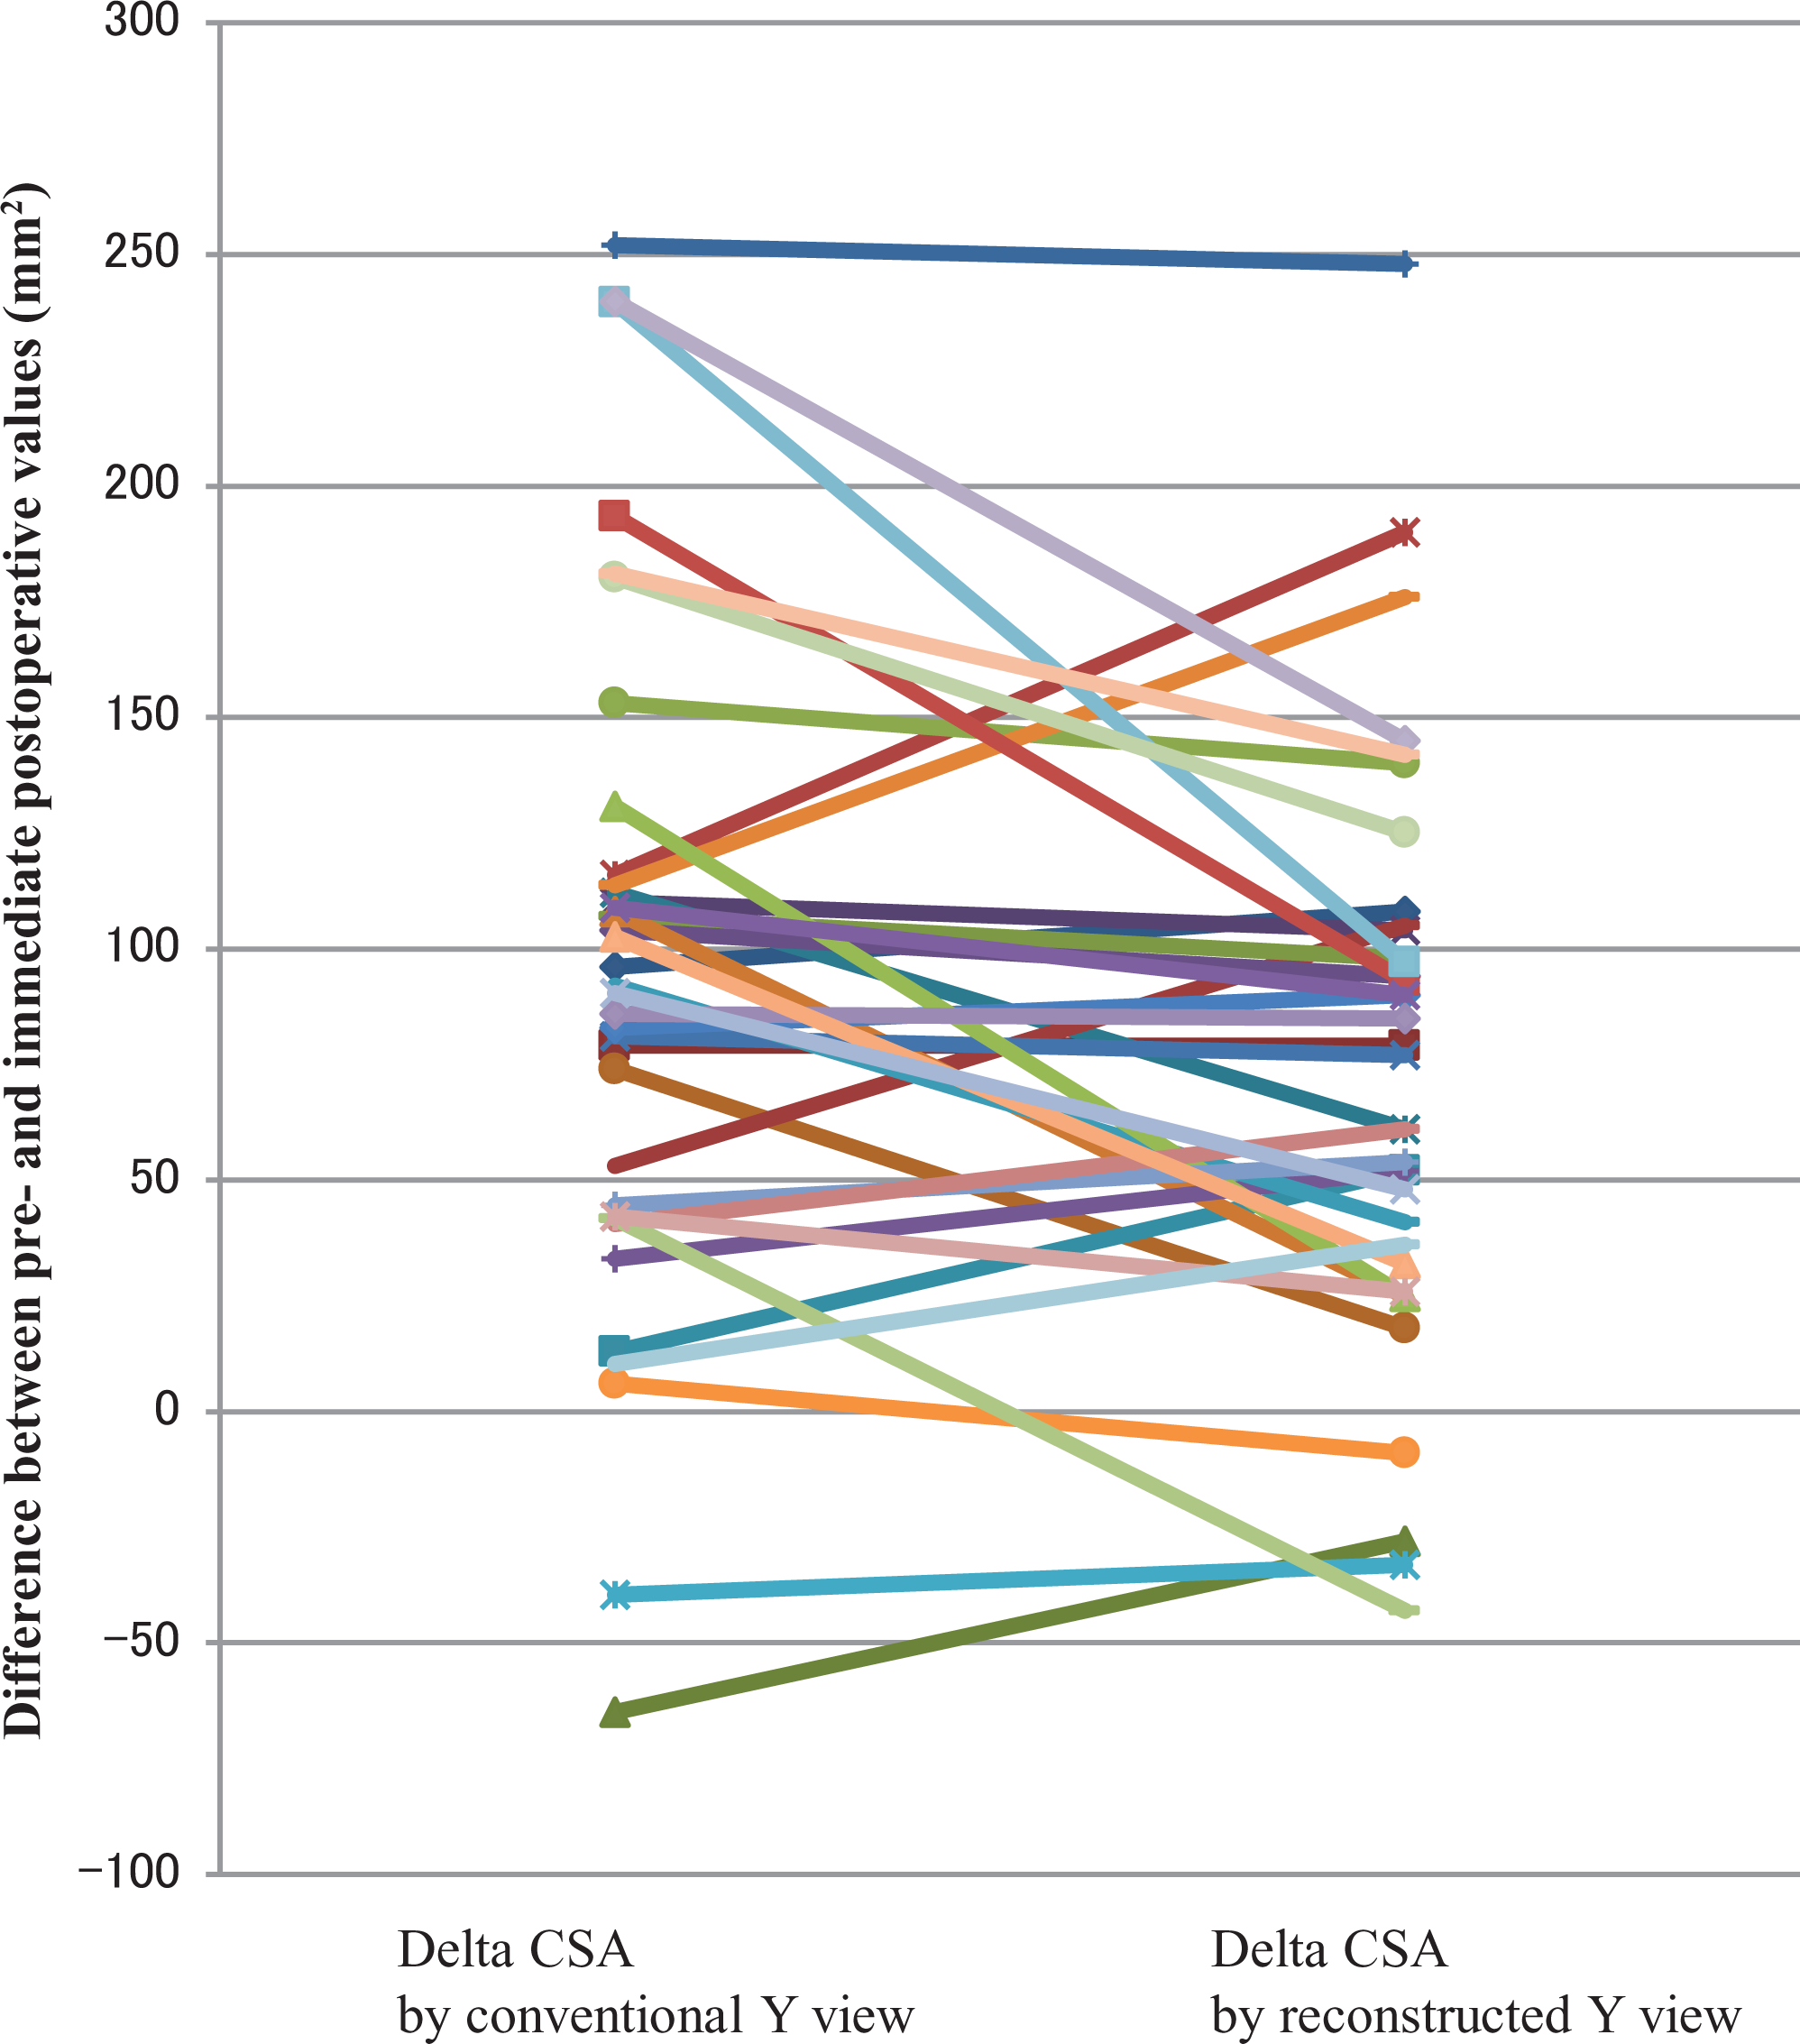
Preoperative to immediate postoperative differences between the cross-sectional areas (CSAs) of the supraspinatus (SS) measured in conventional Y-view and reconstructed Y-view. Delta CSA refers to CSA differences of the SS in preoperative and postoperative magnetic resonance images. A positive value means CSA increased postoperatively. Each line refers to a case. A positive or negative slope suggests that there may have been inconsistencies in the measurement of the conventional Y-view.
The pre- to postoperative differences between the CSAs of the SS measured in reconstructed sections crossing the deepest point of the suprascapular notch were smaller than those measured in RYV but remained significantly different. However, preoperative and postoperative CSAs of the SS were similar when measured in the reconstructed section crossing the medial edge of the origin of the omohyoid (Table 3).
Cross-sectional Area (CSA) of the Supraspinatus (SS) as Measured on the Reconstructed Oblique-Sagittal Magnetic Resonance Imaging (MRI) Scan a
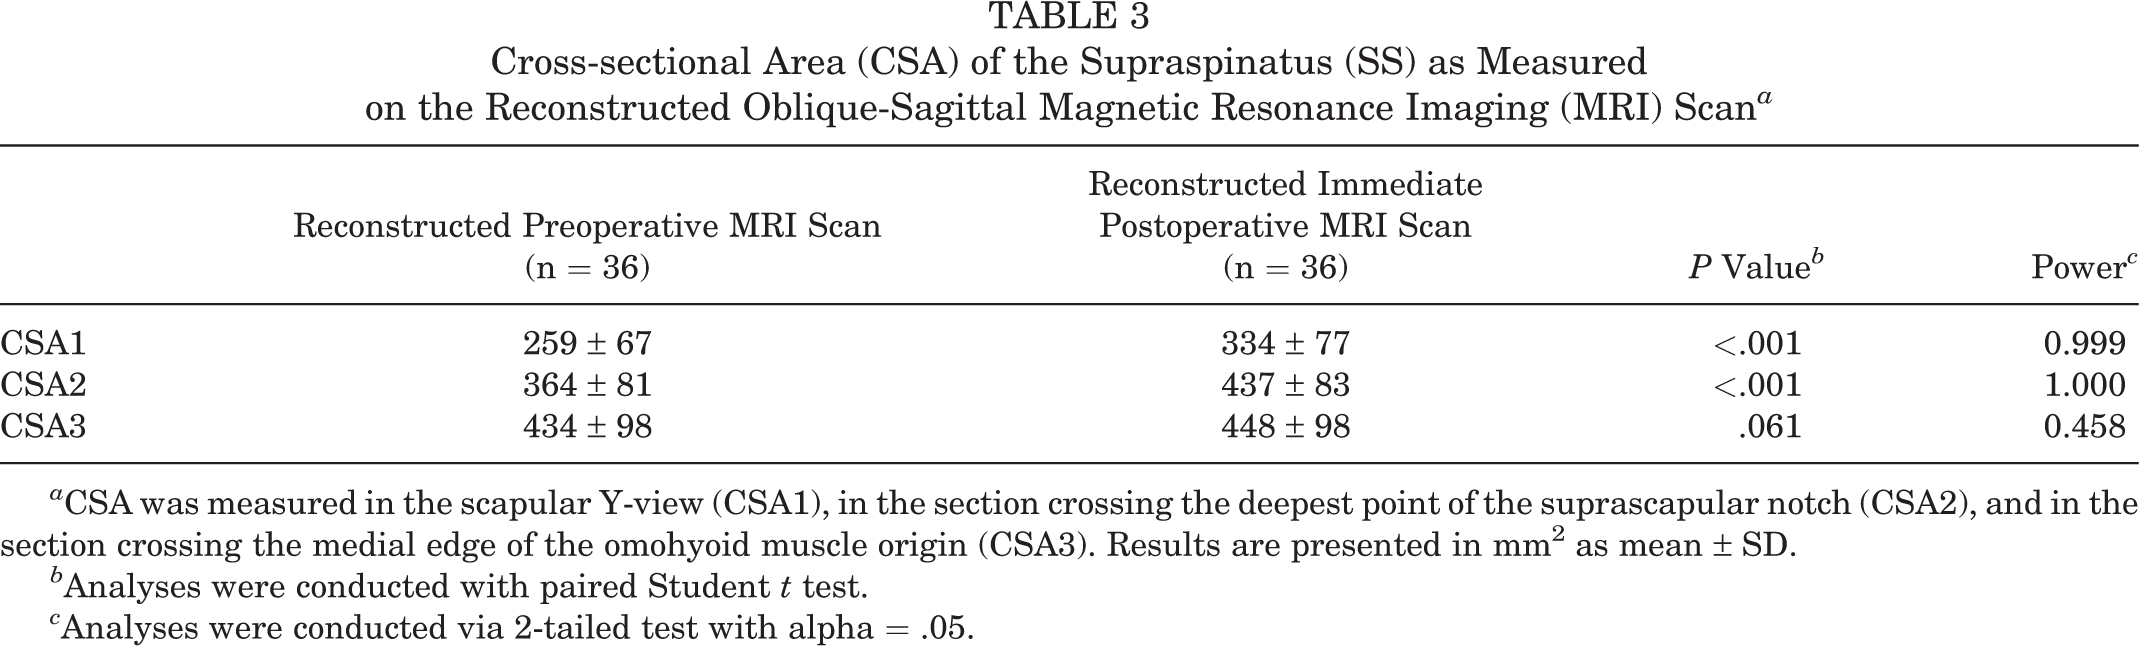
a CSA was measured in the scapular Y-view (CSA1), in the section crossing the deepest point of the suprascapular notch (CSA2), and in the section crossing the medial edge of the omohyoid muscle origin (CSA3). Results are presented in mm2 as mean ± SD.
b Analyses were conducted with paired Student t test.
c Analyses were conducted via 2-tailed test with alpha = .05.
As presented in Tables 2 and 3, post hoc power analysis showed that statistical power was high, except when comparing CSA3 (the CSA of the SS in the section crossing omohyoid origin), which had a power of 0.458.
Discussion
This study demonstrates that CYV in oblique-sagittal MRI scans may inconsistently slice the SS and that this can cause significant over- or underestimations of the CSA of the SS. In particular, this scanning axis discrepancy can cause substantial errors when one is assessing changes in SS atrophy after rotator cuff repair. We suggest the use of a more consistent scanning axis for MRI reconstruction to provide a more accurate assessment of rotator cuff volume change after surgical repair.
The present study shows that CSAs of the SS determined in sections more medial than RYV change little immediately after rotator cuff repair, in contrast to those in RYV. Several studies have reported that the CSA of the SS significantly increases immediately after surgery, presumably due to tendon retraction recovery. 8,15,17,18,28 Accordingly, to evaluate true volumetric SS changes using CSAs, this positional change–associated error should be eliminated. Therefore, we suggest that the CSA of the SS measured in a slice more medial than scapular Y-view, such as the slice crossing the medial edge of the omohyoid origin, should be used when evaluating atrophic changes of the SS after repair.
In the present study, statistical power for comparisons of CSA3 between preoperative and immediate postoperative MRI assessments was 0.458 (Table 3). However, the mean difference of CSA3 between the 2 assessments was 14 mm2 (434 vs 448 mm2) and the mean difference between the 2 observers was 23 mm2 when the CSAs of the SS were measured in RYV (data not shown). Thus, as the interobserver difference was substantially larger than the mean difference of CSA3 between MRI scans, we presumed that mean CSA3 differences were within the range of measurement error. Therefore, we would expect that CSA3 would be similar for preoperative and postoperative MRI scans, even when analyzed in larger populations.
There is no doubt that atrophy of the rotator cuff muscle affects outcomes after rotator cuff repair. 1,10,12,13,23,25 However, previous evaluation methods may reflect not only atrophy but also retraction of the cuff muscle. In other words, previous studies regarding postoperative changes of atrophy determined by the CSA measured at CYV after repair could be biased due to the confounding effect of rotator cuff retraction. 2,6,9,11,13,14,21,26,29 Because these studies measured the atrophy in CYV, discussion of the reversibility of atrophy is meaningless because CYV measurements may be affected more by repair integrity and recovery of retraction than by real muscle volume change. 8,15,17,18,28
In the same context, Jo et al 15 –17 demonstrated that rotator cuff CSA increases immediately after surgery, and they suggested that previous studies based on preoperative values overestimated atrophy recovery. As a result, those investigators suggested that the CSA measured in CYV on postoperative MRI scans should be used as a baseline when evaluating postoperative atrophy-associated rotator cuff changes. However, undergoing MRI immediately after surgery is not a practical proposition for all patients, and Jo et al 15 –17 did not consider the effects that different scanning axes would have on CSAs of the SS as determined from preoperative and immediate postoperative MRI scans.
A solution to the clinical infeasibility of obtaining MRI scans soon after surgical repair may have been found by Yoo et al. 30 Those investigators identified a section at the most lateral portion of the osseous origin of the SS at the scapula, which they called the supraspinatus origin view (SOV), and showed that the CSAs of the SS in SOV were less affected by tendon retraction than those determined in CYV. Although Yoo et al suggested the possibility of inherent errors when CYV is used to assess rotator cuff atrophy, they did not identify a section unaffected by retraction. In the present study, CSAs determined in SOV appear to be equivalent to CSAs measured in the section crossing the deepest point of the suprascapular notch. However, we also found that sections more medial than the SOV, for example the section crossing the medial edge of the omohyoid origin, are better candidate sections for measuring the CSAs of the SS that are unaffected by recovery of SS retraction.
The current study highlights 2 aspects overlooked by the previous method of evaluating rotator cuff atrophy and, therefore, could potentially contribute to clinical and surgical decision making. First, inconsistent scanning axes in scapular Y-view can cause significant errors in measured CSAs of the SS. Furthermore, this inconsistency remains even when experienced technicians perform MRI preoperatively and immediately postoperatively using a consistent protocol, because axes are set using a scout image before each imaging session. Therefore, we recommend the use of the same scanning axis when conducting oblique-sagittal MRI or when reconstructing images. Second, an immediate positional change of the rotator cuff after retraction recovery can cause errors when evaluating changes of rotator cuff atrophy. Therefore, we recommend that sections more medial than the scapular Y-view, such as the section crossing the medial edge of the omohyoid origin, be used to evaluate rotator cuff volumetric changes after repair using the CSAs of the SS.
This study has some limitations. First, we included only 36 cases in the analysis. Nevertheless, inconsistencies of scanning axis in MRI scans obtained preoperatively and immediately postoperatively reached statistical significance, which enabled us to draw the conclusion that scanning axis inconsistencies confound the evaluation of CSA changes after repair. Although as mentioned above, statistical power for comparisons of CSA3 in preoperative and postoperative MRI scans was only 0.458, the mean difference was within the range of measurement error, which predicts that CSA3 determined by preoperative and postoperative MRI would be similar even if analyses were conducted in larger populations. Second, the time interval between pre- and postoperative MRI should be minimal. Nevertheless, we believe that 128 days or less is acceptable because rotator cuff degenerative changes reportedly occur at 1 year or more after surgery. 22 Third, we did not determine the nature of the relationship between the CSAs of the SS and actual volumes of the SS. Unfortunately, we were unable to do this because some MRI scans did not cover the entire extent of the SS. Further study is needed to confirm the relationship between the CSAs of the SS in medial sections and SS volumes. Fourth, we could not analyze the CSAs of the other 3 rotator cuff muscles for the same reason. Although the field of view of the MRI unit at our institution is extended medially as much as possible, scanning to the scapular border in some patients was not feasible because of coil size and resolution limitations. Nonetheless, we believe that the findings of the present study are probably valid for other rotator cuff muscles.
Conclusion
Scanning axes inconsistencies in CYV cause unacceptable errors in CSA measurements of the SS after rotator cuff repair. We recommend reconstruction along a more consistent scanning axis by multiplanar reconstruction when evaluating postoperative changes in SS atrophy and the use of sections more medial than scapular Y-view to reduce errors caused by tendon retraction.
A Video Supplement for this article is available at http://journals.sagepub.com/doi/suppl/10.1177/2325967120930660.
Footnotes
Final revision submitted February 10, 2020; accepted February 24, 2020.
The authors declared that there are no conflicts of interest in the authorship and publication of this contribution. AOSSM checks author disclosures against the Open Payments Database (OPD). AOSSM has not conducted an independent investigation on the OPD and disclaims any liability or responsibility relating thereto.
Ethical approval was granted from Seoul National University College of Medicine (No. H-1605-134-765).
Notes
References
Supplementary Material
Please find the following supplemental material available below.
For Open Access articles published under a Creative Commons License, all supplemental material carries the same license as the article it is associated with.
For non-Open Access articles published, all supplemental material carries a non-exclusive license, and permission requests for re-use of supplemental material or any part of supplemental material shall be sent directly to the copyright owner as specified in the copyright notice associated with the article.