
Abstract
Background:
The “killer turn” effect after posterior cruciate ligament (PCL) reconstruction is a problem that can lead to graft laxity or failure. Solutions for this situation are currently lacking.
Purpose:
To evaluate the clinical outcomes of a modified procedure for PCL reconstruction and quantify the killer turn using 3-dimensional (3D) computed tomography (CT).
Study design:
Case series; Level of evidence, 4.
Methods:
A total of 15 patients underwent modified PCL reconstruction with the tibial aperture below the center of the PCL footprint. Next, 2 virtual tibial tunnels with anatomic and proximal tibial apertures were created on 3D CT. All patients were assessed according to the Lysholm score, International Knee Documentation Committee (IKDC) Subjective Knee Evaluation Form, Tegner score, side-to-side difference (SSD) in tibial posterior translation using stress radiography, and 3D gait analysis.
Results:
The modified tibial tunnel showed 2 significantly gentler turns (superior, 109.87° ± 10.12°; inferior, 151.25° ± 9.07°) compared with those reconstructed with anatomic (91.33° ± 7.28°; P < .001 for both comparisons) and proximal (99° ± 7.92°; P = .023 and P < .001, respectively) tibial apertures. The distance from the footprint to the tibial aperture was 16.49 ± 3.73 mm. All patient-reported outcome scores (mean ± SD) improved from pre- to postoperatively: Lysholm score, from 46.4 ± 18.87 to 83.47 ± 10.54 (P < .001); Tegner score, from 2.47 ± 1.85 to 6.07 ± 1.58 (P < .001); IKDC sports activities score, from 19 ± 9.90 to 33.07 ± 5.35 (P < .001); and IKDC knee symptoms score, from 17.87 ± 6.31 to 25.67 ± 3.66 (P < .001). The mean SSD improved from 9.15 ± 2.27 mm preoperatively to 4.20 ± 2.31 mm postoperatively (P < .001). The reconstructed knee showed significantly more adduction (by 1.642°), less flexion (by 1.285°), and more lateral translation (by 0.279 mm) than that of the intact knee (P < .001 for all).
Conclusion:
Lowering the tibial aperture during PCL reconstruction reduced the killer turn, and the clinical outcomes remained satisfactory. However, SSD and clinical outcomes were similar to those of previously described techniques using an anatomic tibial tunnel.
Isolated posterior cruciate ligament (PCL) tear is an infrequent injury with an annual incidence of 1.8 per 100,000. 31 Most cases occur as a result of sports trauma or motor vehicle accident. 29 After PCL injury, patients may experience pain or impaired function or develop degenerative changes over the long term. 10,19 Therefore, reconstruction remains the most important method for treating PCL injury. However, the failure rate of PCL reconstruction has been reported to be fairly high, and the revision rate has been reported to be up to 11.7%. 3,14
The anatomic transtibial technique is the most commonly used method for PCL reconstruction. 26 However, an acute angle forms after this procedure at the posterior tibia where the graft exits the tibial tunnel and traverses toward the femur. This sharp angle of the graft at the tunnel exit, the so-called killer turn, is an overstressed area and is considered one of the causes of the failure of surgical treatment. 17,25,36,37 Fanelli et al 7 reported a technique that placed the tibial tunnel even lower relative to the footprint area, based on the theory that this approach could break the 1 acute killer turn into 2 gentler angles.
However, to the best of our knowledge, the clinical outcomes of this technique using a lower tibial tunnel have not been reported. Furthermore, although quantitative radiological assessments of the killer turn 15,18,20,27,28,34 have been reported, the angles were measured on 2-dimensional coronal, sagittal, or axial projections, which yield different results from the true angles in 3-dimensional (3D) space.
The purposes of the present work were to (1) report the surgical technique of a modified procedure for PCL reconstruction that lowers the placement of the tibial tunnel relative to the footprint; (2) evaluate the graft-tunnel angle posterior to the tibia (ie, the killer turn) in 3D coordinates using 3D computed tomography (CT) and compare the angles created via different procedures using different tibial tunnel placements; and (3) report the postoperative clinical outcomes compared with the preoperative results.
Methods
Patient Selection and Study Design
Data for patients who experienced an isolated PCL injury and underwent transtibial PCL reconstruction via an arthroscopic 1-bundle technique via hamstring tendon autografts at our center were retrospectively collected for this study. The diagnosis was confirmed using physical examination, side-to-side difference (SSD), and magnetic resonance imaging (MRI). Reconstruction was suggested when the patient had more than 8 mm of SSD in posterior translation as measured using preoperative stress radiography. 22
Ethical approval was obtained from the ethics committee of Sichuan University. All patients were informed about the study and consented to participate. The study inclusion criteria were as follows: Isolated PCL injury with posterior translation SSD greater than 8 mm Less than 5° of increased external or internal rotatory laxity at 30° of flexion Normal varus/valgus stress MRI with no evidence of anterior cruciate ligament (ACL), medial collateral ligament, or posterior-lateral complex injury Failure of nonoperative treatment
Patients with any of the following conditions were excluded: PCL injury combined with meniscal or cartilage injuries confirmed using arthroscopy Multiligament injury, bone fracture, severe osteoarthritis or revision PCL reconstruction Incomplete follow-up data
Surgical Technique
A modified technique for PCL reconstruction was used wherein a lower tibial tunnel was created and a single hamstring tendon autograft bundle was used. 7 Through use of standard anterolateral and anteromedial portals, routine arthroscopic examination was performed to confirm the diagnosis (Figure 1A) and the presence of concomitant injuries, such as meniscal injury. Then, a hamstring tendon autograft (gracilis tendon and semitendinosus tendon) longer than 26 cm was harvested. The tendons were sutured by use of No. 5 nonabsorbable sutures (Ethibond; Ethicon) and folded into a 13-cm, four-strand tendon graft.

Arthroscopic posterior cruciate ligament (PCL) reconstruction with a lower tibial technique. (A) View through the anterolateral portal (AL): lax PCL after injury (blue arrow). (B) View through the posteromedial portal (PM): a stripper (blue arrow) was used to strip the posterior articular capsule. (C) View through the PM, 20 mm from the proximal edge of the footprint to the intra-articular tibial aperture, as shown on the tibial guide. (D) A 2-mm guide pin was drilled into and exited the posterior tibial cortex approximately 15 mm distal and close to the extension line of the lateral intercondylar tubercles. (E) A double-stranded guide wire was placed to introduce the graft into the tibial tunnel from the anteromedial portal. (F) The center of the femoral tunnel was 5 mm posterior to the articular edge. (G) After reconstruction, the graft (blue arrow) was mostly covered by the PCL remnant at the aperture of the femoral tunnel. (H) The reconstructed graft could be viewed. ACL, anterior cruciate ligament.
After routine arthroscopic examination, a posteromedial portal was created to identify the tibial PCL footprint. Then, the articular capsule posterior to the PCL remnant was stripped through use of a stripper (Smith & Nephew) (Figure 1B) to expose the posterior tibial cortex. With the PCL drilling guide (Smith & Nephew), a 2-mm guide pin was drilled from 40 to 50 mm below the tibial plateau with an angle of 60° to 15 to 18 mm distal and slightly lateral to the center of the tibial PCL footprint (Figure 1, C and D) under the view of a 30° arthroscope through the posteromedial portal. According to the diameter of the PCL grafts, reaming drills were used to enlarge the tibial tunnel, with the tibial guide placed between the tibial aperture and neurovascular bundles to protect them. After the tibial tunnel was completed, a guide wire was introduced from the extra-articular aperture of the tibial tunnel. Subsequently, this guide wire was used to introduce the tibial side of the graft from the anteromedial portal (Figure 1E).
The femoral tunnel was drilled according to the original PCL femoral footprint, which was 5 mm posterior to the articular edge with the patient’s knee at 90° of flexion (Figure 1F). A 2-mm guide pin was drilled through the anterolateral portal under the view of a 30° arthroscope through the anteromedial portal. According to the diameter of the grafts (8 or 9 mm in diameter), reaming drills were used to enlarge the femoral tunnel. The length of the femoral tunnel was approximately 35 mm, and the loop was 15 mm. The PCL remnant was well-preserved during enlargement (Figure 1G). Then, the graft was placed into the femoral and tibial tunnels through the anteromedial portal and fixed at a position of 60° (Figure 1H). The femoral end of the graft was fixed by use of an Endobutton (Smith & Nephew), and the tibial end was fixed via an interface screw (Smith & Nephew) and tied on a cortical bone screw near the outer aperture.
Postoperative Rehabilitation
The knee was immobilized at full extension with a hinge PCL brace for 4 weeks after surgery, and the patients were encouraged to perform quadriceps isometric contraction training during immobilization. Partial weightbearing was allowed at 2 weeks after surgery, and full weightbearing was allowed at 6 weeks. At 4 to 6 weeks after the surgery, the patients were allowed to slowly bend their knee to 90°. They were permitted to try to bend their knee to 120° when the posterior drawer test was negative at 6 to 8 weeks after surgery. At 3 to 4 months after surgery, the PCL brace was removed, and at 6 months, the patients were allowed to jog. Competitive sports were prohibited for the first 12 months after the surgery.
Quantitative Measurements on 3D CT
At the latest postoperative follow-up, all operated knees of patients were examined using CT (Siemens) by means of a technique optimized for 3D reconstruction. Open-source software (3D Slicer; 4.9.0-2018-08-20, https://github.com/Slicer/Slicer) was used for 3D reconstruction. All images were based on universal Digital Imaging and Communications in Medicine clinical image standards. After reconstruction, all 3D images were imported into 3ds Max 2014 (Autodesk) for further processing, measurement, and calculation.
The density was adjusted until the reconstructed graft was visible on the 3D image, and then the pathway of the graft was marked manually (Figure 2A). Following the pathway of the graft, 2 gentler turns (superior turn [ST] and inferior turn [IT], respectively) instead of 1 acute turn were formed (Figure 2, B and C).

Three-dimensional (3D) computed tomography reconstruction, modification, and assessment. (A) The pathway of the graft was delineated on the reconstructed 3D image. (B) The curved pathway was represented as 2 turns geometrically. The arrows indicate the superior turn (ST) and inferior turn (IT) created by the modified procedure. (C) Sagittal image of a patient with a lower tibial tunnel. The red lines represent 2 turns formed posterior to the tibia. (D) Two virtual tibial tunnels, the anatomic tunnel (AT; blue) and the proximal tibial tunnel (PT; yellow), were created according to the location of the footprint. Two virtual angles (PT and AT) were formed. (E) The bony landmarks were used to draw the outline of the footprint. An inscribed circle was drawn in the polygon of the footprint, and the center of the circle was set as the center of the footprint. (F) 3D scatter plot of the center of the aperture of the lower tibial tunnels. The red sphere represented the average coordinates of all apertures.
The same method was used on the opposite intact knee in the same patient to identify the native PCL footprint. Apart from the visible reconstructed graft, the landmarks on the tibial plateau were also used to draw the outline of the footprint 9 (Figure 2E). Subsequently, an inscribed circle was drawn in the polygon of the footprint. The center of the circle, point A, was set as the center of the footprint (Figure 2E). A theoretical anatomic transtibial tunnel (AT) from the center of the footprint to the same spot as the real tunnel was drilled (Figure 2D). Then, the killer turn (angle AT), where the graft exited into the joint, was formed (Figure 2D). Another virtual tunnel proximal to the anatomic tunnel, as described by Okoroafor et al, 26 was drilled, forming a third angle, angle PT, at the turn (Figure 2D).
We made 3 pathways for grafts, 1 real and 2 virtual. The 4 angles (ST, IT, AT, PT) were identified in the tibial turn (Figure 2D). A 3D coordinate system was created to measure all of the angles. The patients were asked to lie down in an anatomic position during CT scanning. First, the center of the tibial PCL footprint was set as the origin. Then, the plane at the origin and parallel to the coronal plane of the body was set as the x-z plane. The plane passing through the origin and parallel to the horizontal plane of the body was set as the x-y plane. The coordinates of the center of the average tibial aperture were measured (Figure 2F). The distance from the origin to the center of the average tibial aperture was calculated.
Evaluation
Patient-Reported Outcomes
Patient-reported outcomes were assessed before the operation and at the latest follow-up visit after the operation. Outcome measures used were the International Knee Documentation Committee (IKDC) Subjective Knee Evaluation Form, the Tegner score, and the Lysholm score.
Posterior Tibial Translation Under Stress Radiography
Posterior tibial displacement was measured using bilateral posterior stress radiography with a load of 150 N applied to the anterior aspect of the tibia, simulating a posterior drawer test, and the knees flexed to 90°, as described by Hoher et al. 16 To avoid subjective bias, all lateral radiographs were first cropped, and the obvious surgical marks (eg, fixation devices, tunnels) were removed (Figure 3A). To further reduce bias (eg, from a bone tunnel that could not be cropped), 2 technicians without a radiological or orthopaedic background (Z.H. and X.H.) blindly evaluated the images. The SSDs in posterior tibial translation between the reconstructed and contralateral knees were recorded and compared. We measured the posterior tibial translation as follows (Figure 3B): first, a line was drawn for automatic calibration, and then a second line was drawn along the tibial plateau. Next, 2 lines perpendicular to the second line and tangent to the posterior aspect of the tibia and femoral condyle were drawn. 32 In the case of an incomplete overlay of both condyles, the midline between both condyles was used. The distance between the 2 intersections made by the 3 lines was measured as the posterior translation of the tibia and was subsequently assessed in relation to the uninjured contralateral knee.
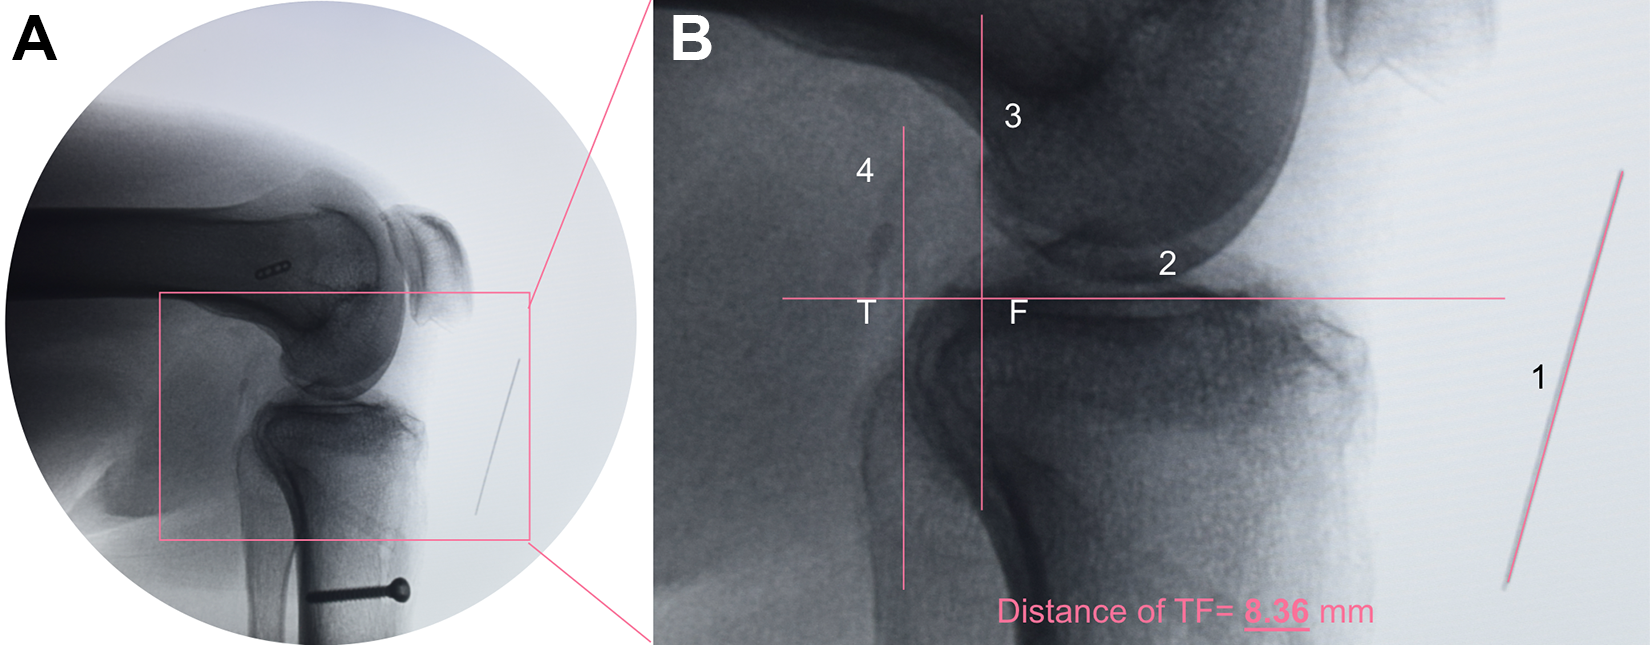
Measurement of posterior tibial translation. (A) Uncropped postoperative image and (B) cropped image without obvious surgical marks. After calibration (line 1), a line (line 2) was drawn along the tibial plateau. Midpoints between the most posterior contours of the medial and lateral femoral condyles and tibial plateaus were established. Perpendicular to line 2 and over the femoral and tibial midpoints, line 3 and line 4 were drawn, respectively. The distance between 2 intersections (T and F) was regarded as the posterior tibial translation; in this case, it was 8.36 mm.
Gait Analysis
Motion data were collected through use of a marker-based motion analysis system (Opti-Knee; Innomotion Inc) at 60 Hz. Two rigid bodies, with 4 light-reflecting markers, were fixed onto each patient’s thigh and shank (Figure 4A). A handheld probe with the same 4 markers was used to identify the following femoral and tibial landmarks: the greater trochanter, lateral epicondyle, medial epicondyle, lateral plateau, medial plateau, medial malleolus, and lateral malleolus (Figure 4B). The position of the probe and 3D trajectories of the 2 rigid bodies during walking were tracked using a camera at a frequency of 60 Hz, with a root mean square error of 0.3 mm. The initial static position was used to establish the anatomic frame of reference.

Identification of the anatomic landmarks and coordinate system. (A) Point of view of the camera integrated with the instruments: 1, rigid body on the thigh; 2, rigid body on the shank; 3, handheld probe; 4, 1 of the 4 reflectors of the 2 rigid bodies and handheld probe; 5, manually drawn surface anatomic landmarks; and 6, treadmill. (B) The transepicondylar axis, a line connecting the prominent points of the medial and lateral femoral epicondyles, was set as the medial-lateral axis. The anterior-posterior axis was perpendicular to the plane defined by the transepicondylar axis and the greater trochanter, and the proximal-distal axis was set perpendicular to the other 2 axes. GT, greater trochanter; LE, lateral epicondyle; LM, lateral malleolus; LP, lateral plateau; ME, medial epicondyle; M-L, medial-lateral; MM, medial malleolus; MP, medial plateau.
When the patients were walking on the treadmill at a speed of 3 km/h, they were required to adjust themselves until the motion patterns were analogous to those observed in a normal overground gait. Key events in the gait cycle were recorded using an integrated high-speed camera and calculated in real time via software (Opti-Knee Version 1.0; Shanghai Innomotion). The knee was subsequently imaged for 15 seconds in 1 test at a frame rate of 60 Hz. The number of cycles in a single test was calculated.
The kinematic data of 6 degrees of freedom (DOF) across the gait cycles in 1 cycle were calculated. The transepicondylar axis, a line connecting the prominent points of the medial and lateral femoral epicondyles, was set as the medial-lateral axis. The anterior-posterior axis was perpendicular to the plane defined by the transepicondylar line and the greater trochanter. The proximal-distal axis was set perpendicular to the other 2 axes (Figure 4B). Motion data were quantified as the displacement of the tibia relative to the femur in 6 DOF, including 3 translation displacements (medial-lateral, anterior-posterior, and proximal-distal) and 3 rotation displacements (flexion-extension, internal-external, adduction-abduction). The data of each gait cycle were normalized to 100 points (1%-100%) from beginning of the cycle (1%) to the end the same cycle (100%). The 6 kinematic curves (x-axis, percentage of the gait cycle; y-axis, translational displacement divided by rotational displacement) for the trials were averaged for each patient across the entire gait cycle. Data for both the reconstructed and the contralateral knees were recorded and compared. Finally, the average difference in the posterior tibial translation between the intact and reconstructed knees during the gait cycles (dynamic SSD) was calculated. Then, a correlation analysis was conducted regarding the difference in the posterior tibial translation as measured using stress radiography (static SSD) versus gait analysis (dynamic SSD). More details on the analysis method can be found in a previous study reported by Zhang et al. 39
Statistical Analysis
Statistical analyses were performed by use of SPSS (Version 25 for MacOS; IBM Corp.). The measurement results are presented as the mean and standard deviation. The level of significance was set at P < .05. A 1-way analysis of variance was used to compare the angles (killer turns) created using 3 different procedures. When a statistically significant difference was detected, a post hoc pairwise comparison was performed via the Turkey HSD test. A paired t test was used to compare the range of motion (ROM) between the reconstructed and intact knees calculated from gait analysis and the SSD and patient-reported outcomes between preoperation and postoperation. The Wilcoxon rank sum test was used to compare motion data between the reconstructed and intact knees. Pearson correlation coefficient was used to assess the correlation between the static and dynamic SSD.
Results
Patient Demographics
In the database of our hospital, the initial search for “posterior cruciate ligament” resulted in 429 eligible cases. After application of the inclusion and exclusion criteria, 15 patients (9 males and 6 females) who underwent isolated PCL reconstruction met the inclusion criteria and were included. The patient characteristics are included in Table 1.
Patient Characteristics
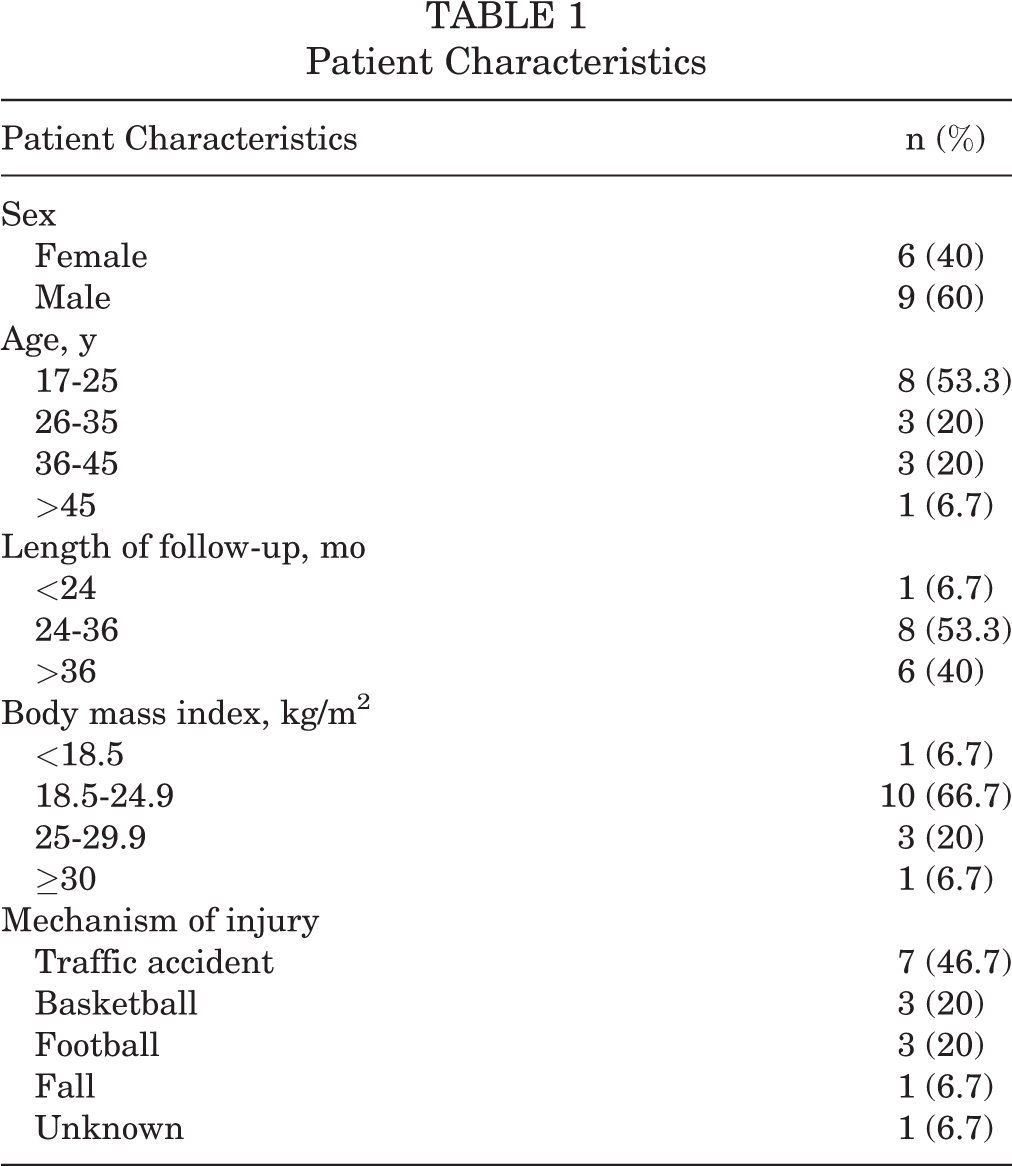
All patients had chronic injury, and the duration from injury to surgery was 7.46 ± 1.93 months. The average diameter of the hamstring autograft was 8.33 ± 0.48 mm (5 autografts were 9 mm in diameter and 10 autografts were 8 mm). The mean age was 29.2 years (range, 19-64 years) at the time of surgery. The mean length of follow-up was 35.4 months (range, 21-55 months), with 93.3% of patients (n = 14) followed for more than 26 months. The mean body mass index was 23.55 kg/m2. We noted that two-thirds of patients were within the normal weight range, 20% were overweight, and 6.7% were obese. Nearly half of the patients were injured in a traffic accident (46.7%), specifically involving a motorbike or electric bike. Basketball (20%) and football (20%) were also common causes of injury (Table 1). All of the patients reported knee pain as their primary symptom.
Results of Quantitative 3D CT
The results revealed that the average magnitude of the ST angle was 109.87° ± 10.12° and IT angle was 151.25° ± 9.07°. The inferior angle was significantly larger than the superior angle (P < .001). The angle produced using anatomic reconstruction (91.33° ± 7.28°) was the smallest (post hoc test; all P < .001) of all 4 angles. Furthermore, compared with the angle of the proximal tibial tunnel (99° ± 7.92°), the 2 angles, superior and inferior, produced using the modified technique were significantly larger (ie, gentler) (P = .023 and P < .001, respectively). The average sizes of the femoral killer turns were significantly larger (ie, gentler) than those of the tibial ones. We found no significant difference among femoral killer turns measured from the 3 different reconstruction techniques (Appendix Table A1). According to the 3D coordinate system, the average location of the center of the modified tibial tunnel was 10.71 mm anterior, 1.64 mm lateral, and 12.42 mm distal to the origin, which is the center of the tibial PCL footprint. The distance from the center of the tibial aperture to the origin, or the center of the footprint, was 16.49 ± 3.73 mm.
Clinical Outcomes
All patient-reported outcome scores (mean ± SD) improved significantly from preoperatively to postoperatively (Figure 5): Lysholm score, from 46.4 ± 18.87 to 83.47 ± 10.54 (P < .001); Tegner score, from 2.47 ± 1.85 to 6.07 ± 1.58 (P < .001); IKDC sports activities score, from 19 ± 9.90 to 33.07 ± 5.35 (P < .001); and IKDC knee symptoms score, from 17.87 ± 6.31 to 25.67 ± 3.66 (P < .001). The IKDC knee function score was 8.67 ± 0.7 after reconstruction, showing significant improvement from the preoperative score (3.87 ± 2.33; P = .001) and no significant difference from the preinjury score (9.6 ± 0.8; P = .259). The mean SSD improved significantly, from 9.15 ± 2.27 mm preoperatively to 4.20 ± 2.31 mm postoperatively (P < .001) (Figure 5F).

Results of patient-reported outcomes. *Statistically significant difference (P < .05). IKDC, International Knee Documentation Committee Subjective Knee Evaluation Form; SSD, side-to-side difference of the posterior translation of the tibia.
On physical examination at the latest follow-up, all patients showed full ROM compared with that of the intact knee. Regarding the ROM from gait analysis, no significant difference was found in any of the 6 DOF between the intact and reconstructed knees at the latest follow-up (Figure 6, A and B). To analyze the tibiofemoral kinematics, the gait cycle was divided into the stance phase and the swing phase. Regarding significant differences, during the stance phase, the reconstructed knee was more externally rotated (2.062°), with slightly more proximal (0.655 mm) and lateral (0.202 mm) translation than that of the intact knee. During the swing phase, the reconstructed knee showed significantly more adduction (4.433°) and posterior (0.187 mm), proximal (0.896 mm), and lateral (0.403 mm) translation than that of the intact knee (Table 2; Figure 6, C-H). Over an entire gait cycle, the reconstructed knee showed significantly more adduction (1.642°), less flexion (1.285°), and more lateral translation (0.279 mm) than that of the intact knee (P < .001 for all).
Difference of Displacement in 6 Degrees of Freedom Between Intact and Reconstructed Knees a
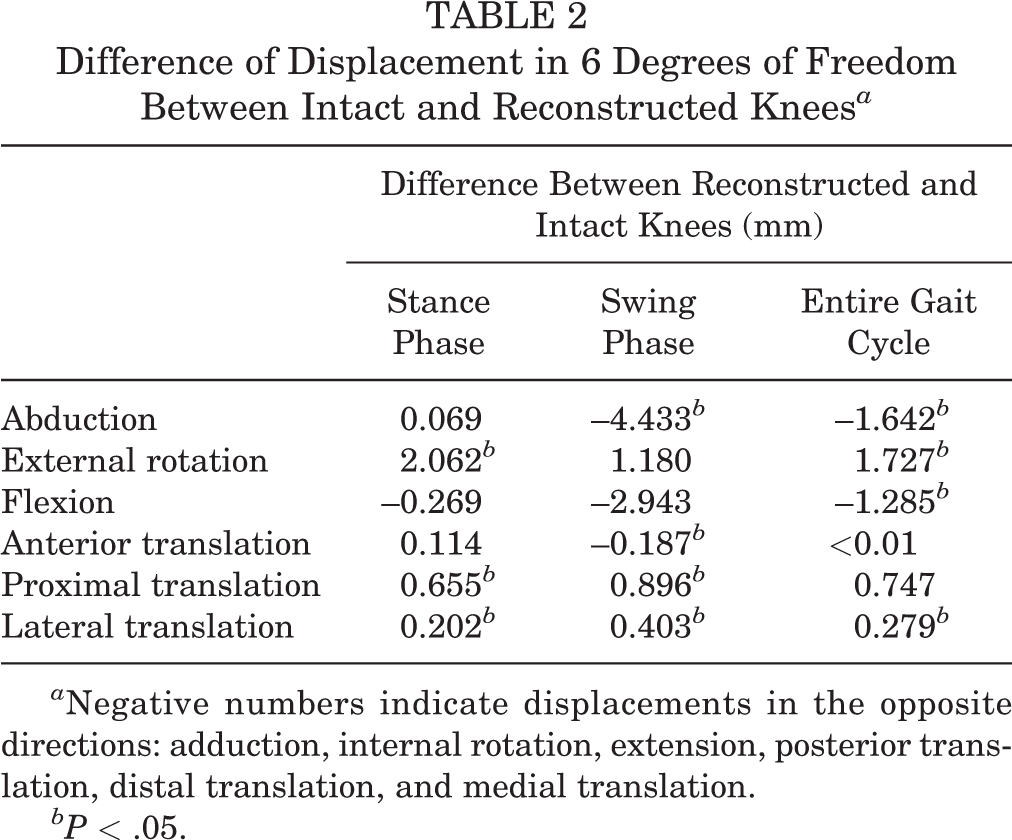
a Negative numbers indicate displacements in the opposite directions: adduction, internal rotation, extension, posterior translation, distal translation, and medial translation.
bP < .05.

Results of the gait analysis: (A, B) range of motion (ROM) and (C-H) tibiofemoral kinematic parameters of the posterior cruciate ligament in intact (gray) and reconstructed knees (red) during the treadmill gait test. (A) ROM of rotational displacement and (B) ROM of translational displacement. (C-H) Tibiofemoral kinematics of 6 degrees of freedom. Ensemble curves for each patient group were normalized from heel strike to heel strike (1%-100%) during a gait cycle. The lines above and below the curves represent the SDs. AB, adduction-abduction; AP, anterior-posterior; FE, flexion-extension; IE, internal-external; ML, medial-lateral; DP, distal-proximal. *Statistically significant difference (P < .05).
Finally, a significant positive correlation was observed between the static SSD acquired using the radiographs and the dynamic SSD acquired using the gait analysis (Pearson r = 0.612; P = .026) (Figure 7).

The static side-to-side difference (SSD) was significantly positively correlated with the SSD calculated from the gait analysis (Pearson r = 0.612; P = .026).
Discussion
The presented modified PCL reconstruction procedure with a lower tibial tunnel created 2 gentler angles, reduced the killer turn, and achieved promising results according to the midterm follow-up.
Theoretically, if the intra-articular tibial aperture is moved from the original footprint area to a lower location on the posterior tibia, 2 obtuse angles instead of 1 acute angle would be created. 7 It has been reported that transtibial drilling can put the posterior neurovascular bundle at risk because the guide pin and drill exit the tibia very posteriorly, placing them close to the posterior neurovascular bundle. 6 However, in our center, no neurovascular injuries were observed among all patients who underwent PCL reconstruction, including those who were excluded from this study because of severe concomitant injuries (eg, fracture, multiligament injury). Several procedures were used to avoid neurovascular injury: (1) the tibial tunnel was drilled using the view of the posteromedial portal; (2) the posterior capsule with nerves and blood vessels was pushed away using the stripper with the patient’s knee bent to 90° (see Figure 1); and (3) when the tibial tunnel was drilled, the tibial guide was positioned posterior to the tibial cortex to protect the blood vessels and nerves. In our database, we stratified the patients by SSD and found that patients with SSD more than 10 mm were more likely to have combined injury (posterior-lateral complex, ACL, fracture, etc). Therefore, SSD greater than 8 mm was one of our indications.
Arthroscopic PCL reconstruction is a challenging procedure compared with ACL reconstruction because of the limited visualization, the proximity of the neurovascular structures, the difficulty in passing the graft, and the killer turn effect. 4,5,23 In a biomechanical study, Bergfeld et al 2 reported that the grafts in the transtibial groups showed significant thinning and fraying at the site of the killer turn. To reduce or avoid the effect of the killer turn, surgeons have adopted improved techniques, such as the tibial inlay technique 33 and modified tibial tunnel techniques. However, the tibial inlay technique is a complicated procedure with a higher risk of neurovascular injury and postoperative infection. 30,35
Fanelli et al 7 first described a modified technique that placed the posterior exit point at the inferior and lateral aspect of the PCL tibial anatomic insertion site, but no related clinical data have been reported thus far. Benedetto et al 1 reported on an inlay reconstruction technique that placed the tibial aperture at the distal margin of the PCL and yielded a higher pull-out strength and smaller cycling loading displacement than that of a tunnel positioned at the center of the posterior tibial facet.
Several studies have evaluated graft tunnel angles using 3D CT. 15,18,20,27,28,34 However, those measurements considered the angles on only 2-dimensional planes (ie, sagittal or coronal projections) rather than in 3D space, and it is difficult to evaluate the true angle of the killer turn with such data. Our assessment method, by which we measured the killer turn in 3D space using 3D coordinates, provides a more reliable means of evaluating and comparing the angles created by different techniques. Both angles created by our modified tibial tunnel were significantly larger than that of the anatomic tibial tunnel, indicating a minimized killer turn, and thus improved the postoperative results. Proximal nonanatomic tibial tunnel PCL reconstruction has been reported to enlarge the killer turn and avoid damage to nerves and vessels. 26 The virtual proximal tunnel in our study indeed resulted in a significantly larger angle compared with that of the virtual anatomic tunnel. However, changing the pathway of the original PCL might change the function of the knee (eg, stability, kinetics, or kinematics). Although we used a nonanatomic tunnel, we carefully chose the intra-articular aperture of the tibial tunnel located between the extension lines of the medial and lateral intercondylar tubercles, close to the lateral extension line and 15 to 18 mm distal to the center of the PCL footprint (see Figure 1). From this aperture, the graft exiting the tunnel is restricted between 2 intercondylar tubercles, and the intra-articular pathway of the reconstructed PCL is similar to that of the original ligament.
Li et al 24 performed anatomic reconstructions and showed that the mean postoperative SSD and Tegner score were 4.1 mm and 6.2, respectively. The results of an anatomic transtibial single-bundle procedure reported by Kim et al 21 showed a mean SSD of 5.6 mm and a Lysholm score of 86.8. Gwinner et al 13 also chose the anatomic position in the application of hamstring tendon grafts, which resulted in the mean SSD decreasing from 10.9 ± 2.9 mm to 4.9 ± 4.3 mm. The lower tibial tunnel technique presented was nonanatomic; however, the postoperative patient-reported outcomes of the present study revealed satisfactory results compared with those of similar studies. Our postoperative SSD was 4.20 mm. Considering the relatively mild preoperative SSD, this result indicated that the advantages of the modified technique with a significantly lower killer turn might not produce as outstanding a result as might have been hoped. The present study indicated that the tibial killer turn was not the reason, or at least was not the only reason, for failure of PCL reconstruction.
The gait analysis revealed that the reconstructed knee showed less internal rotation; more adduction; and more proximal, lateral, and posterior translation. Despite the significant difference that was reached statistically, it was too small to be clinically important. Wiley et al 38 found that patients with an isolated PCL injury showed 2.2° more adduction and 4.3° more external rotation in the reconstructed knee than in the intact knee, which is consistent with our study. A possible explanation is that purely isolated PCL injuries are rare in patients with traumatic injury and a PCL injury is usually accompanied by a posterior-lateral complex injury. Although a minor posterior-lateral complex injury might not be clinically important or need surgical repair, 8 patients would present with increased adduction and external rotation. 11 In addition, degenerative changes could occur after PCL reconstruction, 12 resulting in cartilage defects and potentially explaining the slightly increased proximal translation (7.47 mm) of the reconstructed knee compared with the intact knee. The correlation analysis of the static and dynamic SSDs revealed a strong relation (Pearson r = 0.612; P = .026), suggesting the reliability of our results.
A potential limitation of this work is the small sample size due to the low incidence of PCL injury, at 0.0018% per year, 31 and the strict inclusion criteria applied. Moreover, the small sample size led to the lack of a control group, which could be a major limitation. In addition, we operated on a population who had chronic isolated PCL injury and received single-bundle hamstring tendon autograft, whereas usually a PCL injury is part of a multiligament knee injury. Additionally, we used only hamstring tendon grafts for our reconstructions. Other grafts may have more or less abrasion from the tibial turn. The average follow-up duration was 35 months, which was not long enough to investigate some complications, such as osteoarthritis.
Conclusion
By lowering the tibial aperture during PCL reconstruction, the killer turn effect was reduced compared with that of anatomic and proximal tibial apertures, and the clinical outcomes of the patients were promising. However, SSD and clinical outcomes were similar to those of previously described techniques using an anatomic tibial tunnel.
Footnotes
Appendix
Femoral and Tibial Killer Turns Results From Different Techniques

| Anatomic Aperture | Proximal Aperture | Lower Aperture | Pa | |
|---|---|---|---|---|
| Femoral killer turn, deg | 154.29 ± 5.79 | 162.54 ± 1.96 | 156.69 ± 9.99 | .906 |
| Tibial killer turn, deg | 91.33 ± 7.28 | 99 ± 7.92 | 109.87 ± 10.12 151.25 ± 9.07 |
<.001 <.001 |
| Pb | <.001 | <.001 | <.001 |
a 1-way analysis of variance.
b 1-way analysis of variance was performed for lower aperture, whereas paired t test was performed for anatomic and proximal apertures.
Acknowledgment
We would like to thank Zheng Xing, who helped us develop the program to measure the SSD on radiographs.
Final revision submitted December 2, 2019; accepted December 17, 2019.
The authors declared that there are no conflicts of interest in the authorship and publication of this contribution. AOSSM checks author disclosures against the Open Payments Database (OPD). AOSSM has not conducted an independent investigation on the OPD and disclaims any liability or responsibility relating thereto.
Ethical approval for this study was obtained from the ethics committee of Sichuan University.