
Abstract
Background:
The rate of concussions in boys’ lacrosse is reported to be the third highest among high school sports in the United States, but no studies have described game-related impacts among boys’ lacrosse players.
Purpose:
To characterize verified game-related impacts, both overall and those directly to the head, in boys’ varsity high school lacrosse.
Study Design:
Cross-sectional study; Level of evidence, 3.
Methods:
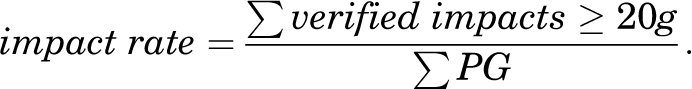
A total of 77 male participants (mean age, 16.6 ± 1.2 years; mean height, 1.77 ± 0.05 m; mean weight, 73.4 ± 12.2 kg) were instrumented with sensors and were videotaped during 39 games. All verified game-related impacts ≥20g were summarized in terms of frequency, peak linear acceleration (PLA), and peak rotational velocity (PRV). Descriptive statistics and impact rates per player-game (PG) with corresponding 95% CIs were calculated.
Results:
Overall, 1100 verified game-related impacts were recorded (PLA: median, 33.5g [interquartile range (IQR), 25.7-51.2]; PRV: median, 1135.5 deg/s [IQR, 790.0-1613.8]) during 795 PGs. The rate for all verified game-related impacts was 1.38 impacts per PG (95% CI, 1.30-1.47). Of these, 680 (61.8%) impacts (PLA: median, 35.9g [IQR, 26.7-55.5]; PRV: 1170.5 deg/s [IQR, 803.2-1672.8]) were directly to the head (impact rate, 0.86 impacts/PG [95% CI, 0.79-0.92]). Overall, midfielders (n = 514; 46.7%) sustained the most impacts, followed by attackers (n = 332; 30.2%), defenders (n = 233; 21.2%), and goalies (n = 21; 1.9%). The most common mechanisms for overall impacts and direct head impacts were contact with player (overall: n = 706 [64.2%]; head: n = 397 [58.4%]) and stick (overall: n = 303 [27.5%]; head: n = 239 [35.1%]), followed by ground (overall: n = 73 [6.6%]; head: n = 26 [3.8%]) and ball (overall: n = 15 [1.4%]; head: n = 15 [2.2%]). Direct head impacts were associated with a helmet-to-helmet collision 31.2% of the time, and they were frequently (53.7%) sustained by the players delivering the impact. Nearly half (48.8%) of players delivering contact used their helmets to initiate contact that resulted in a helmet-to-helmet impact. Players receiving a head impact from player contact were most often unprepared (75.9%) for the collision.
Conclusion:
The helmet is commonly used to initiate contact in boys’ high school lacrosse, often targeting defenseless opponents. Interventions to reduce head impacts should address rules and coaching messages to discourage intentional use of the helmet and encourage protection of defenseless opponents.
In the United States, boys’ lacrosse is a rapidly growing team sport among National Federation of State High School Associations (NFHS) member schools. 25 The increasing popularity of the sport has contributed to greater awareness of potential injuries, including brain injuries (eg, concussions). The incidence of concussions in boys’ lacrosse is reported to be the third highest among all boys’ high school sports, with the majority of them being sustained during games 17,19,33 and resulting from player-to-player contact. 16
Suffering multiple concussions has been associated with unfavorable health consequences. 20 However, much remains to be understood about the adverse consequences of chronic exposure to nonconcussive head impacts. 3 Head impact exposure is a broad term incorporating athlete exposure and impact frequency, magnitude, and location along with cumulative measures of head impacts. 12 Many studies have attempted to quantify head impact exposure using helmet-based accelerometers in collegiate collision sports such as football 2,13 or ice hockey. 4,23,28 More recently, studies have examined the frequency and magnitude of head impacts among male collegiate lacrosse players. 15,24,26,30 Although these studies provide valuable information about head impact exposure in collegiate men’s lacrosse, they focus on the most skilled levels of play and provide limited information about the impact mechanisms and game play characteristics associated with head impacts in younger players.
Combining wearable accelerometer technologies with visual confirmation may aid in better understanding the types of impact mechanisms and game play characteristics associated with impacts in boys’ high school lacrosse. 11,27 The purpose of this study was to characterize verified game-related impacts, both overall and those directly to the head, in boys’ varsity high school lacrosse.
Methods
Design and Participants
Data were gathered from a prospective cohort of 3 boys’ high school varsity lacrosse teams (N = 77 players; mean age, 16.6 ± 1.2 years; mean height, 1.77 ± 0.05 m; mean weight, 73.4 ± 12.2 kg). Participants were instrumented with helmet sensors during 39 games in 3 consecutive spring lacrosse seasons (2014-2016); each game was also video recorded. Player positions included attacker (n = 18), defender (n = 18), midfielder (short-stick: n = 30; long-stick: n = 7), and goalie (n = 4). The research protocol was approved by a university institutional review board before the initiation of this study, and written informed parental consent and player assent were obtained for all participants.
Impact Event Monitoring
Consistent with prior lacrosse research, 8,9,11 impacts occurring during varsity boys’ lacrosse games were prospectively monitored using wearable sensors (GForce Tracker [GFT]; GForce Tracker) that were time synchronized with game video captured using a high-definition camcorder (XA10 HD; Canon). Before each game, a trained member of the research team affixed the helmet sensor, associated with a unique player identification number, to the inside crown of the boys’ lacrosse helmets. A sensor assigned as a “dummy sensor” was time synchronized with all active sensors and the camcorder using a laptop computer, following previously described protocols. 8,9,11 Participants wore the helmet sensor throughout the entirety of each game. Each helmet sensor was composed of a triaxial accelerometer and gyroscope that measured linear acceleration at 3000 Hz and rotational velocity at 760 Hz. If a sensor exceeded a predetermined 10g linear acceleration threshold, 40 milliseconds of data (8 milliseconds before and 32 milliseconds after the head acceleration event) were saved to onboard memory. 6,11,15,24 The GFT has previously been employed in men’s collegiate lacrosse to characterize impact kinematics, coupled with a video verification process. The GFT has shown moderate to strong correlations with laboratory criterion standards for use in football and hockey helmets. 1,6
Data Processing and Impact Event Analysis
At the conclusion of each game, all sensor data were uploaded to a secure server (GForce Tracker). Consistent with prior research, 9,11,21 we limited our analyses to impacts ≥20g to remove low acceleration events (10g-19g) commonly associated with physical activities of game play (eg, jumping, hard stops, cuts) that were unlikely to result in deleterious neurophysiological changes. All game-related impacts ≥20g recorded by the helmet sensors were reviewed and verified using the video footage, following described methodology. 9,11 An impact was verified if it was identified on video and met criteria previously described by Cortes and colleagues. 11 Verified impacts were categorized by characteristics of game play (game segment, field location, etc), player activity (shooting, ball handling, etc), and impact incident (impact mechanism, location on body, preparedness for impact) using a lacrosse-specific incident analysis instrument (LIAI) developed in consultation with US Lacrosse and previously described in the literature. 8,9,15,16 All verified impacts in which the head was observed on video to be the intial location of contact on the body were operationally defined as a direct head impact. Additionally, the Lacrosse Collision Readiness Index was used to evaluate the struck player’s visual awareness and body posture in the moments before an impending body check and thus qualitatively evaluate preparedness for collisions in lacrosse. 9,11,16
Statistical Analysis
All analyses were calculated using SPSS 22 (IBM). Player and game play characteristics for verified impacts, both overall and those directly to the head, were examined. Descriptive statistics (frequency, median, and interquartile range) for peak linear acceleration (PLA) and peak rotational velocity (PRV) were reported for verified game impacts ≥20g and further described by game play situation, player activity, and impact incident. Impact rates per player-game (PG) with corresponding 95% CIs were also determined, in which a PG was defined as 1 player instrumented with a wearable device participating in 1 entire game. Individual athlete playing time was not tracked. The formula for calculating the impact rate was as follows:
Results
Overall Impact Frequency and Magnitude
Data were collected from a total of 795 PGs, with a mean of 21 (range, 17-31) instrumented players per game. A total of 1102 impacts ≥20g recorded by the GFT were verified using video analysis. During 2 impact events, the view of game play was obstructed; thus, these impacts were removed, leaving 1100 verified impacts for our analyses (Table 1). The overall median PLA and PRV for all verified impacts were 33.5g and 1135.5 deg/s, respectively, for an incidence of 1.38 impacts per PG (95% CI, 1.30-1.47) and 14.3 impacts per player-season. Collectively, our findings suggest that a mean frequency of 28.2 verified impacts per team occurred during each game. Further, our findings indicate that approximately 14.3 impacts were experienced by each player per season. Of note, only 1 game-related concussion and no other head or facial injuries were reported during this 3-year study.
All Verified Impacts by Player Position and Mechanism a
a Data are shown as median (interquartile range) unless otherwise indicated. PG, player-game; PLA, peak linear acceleration; PRV, peak rotational velocity.
b Impact rate = No. of impacts per PG.
Overall Impacts by Player Position
Midfielders (n = 514 [46.7%]; short-stick: n = 441 [40.1%] vs long-stick: n = 73 [6.6%]) sustained the greatest number of impacts, followed by attackers (n = 332; 30.2%), defenders (n = 233; 21.2%), and goalies (n = 21; 1.9%) (Table 1). Goalies experienced the lowest rate of impacts (0.46 impacts/PG) but the highest PLA (median, 40.3g) of all positions. Among field players, attackers had the highest rate of impacts (1.76 impacts/PG) and defenders the lowest (1.24 impacts/PG). When examining the magnitude of impacts among field players, attackers and defenders demonstrated a similar median PLA, with midfielders experiencing the lowest PLA magnitudes. Defenders experienced the highest PRV, followed by goalies, attackers, and finally midfielders. Complete descriptive information for impacts by player position is shown in Table 1.
Overall Impacts by Mechanism
The vast majority of all impacts (N = 1100) resulted from player contact (n = 706; 64.2%), followed by stick contact (n = 303; 27.5%). Goalpost (n = 3; 0.3%), followed by ball (n = 15; 1.4%) and then ground (n = 73; 6.6%), mechanisms accounted for the fewest number of impacts. Although fewest in number, goalpost and ball impact mechanisms demonstrated the highest median PLA and PRV (PLA: 115.8g, PRV: 2270.0 deg/s and PLA: 47.5g, PRV: 1583.0 deg/s, respectively). When examining the magnitude of impacts among all other mechanisms, stick, player and ground contacts demonstrated similar PLA and PRV values. See Table 1 for additional information regarding impact mechanism.
Overall Impacts by Game Play Situation
An analysis by game situation revealed that impacts were nearly evenly divided among quarters of play. The largest proportion of impacts occurred when teams were on offense (n = 617; 56.1%) as compared with defense (n = 412; 37.5%). All remaining impacts (n = 71; 6.5%) occurred during face-off situations. The majority of impacts occurred within the attack area (n = 773; 70.3%), followed by the midfield area (n = 324; 29.5%). When a team was playing offense, player contact (n = 305; 49.4%), followed closely by stick contact (n = 254; 41.2%), accounted for the top 2 impact mechanisms. When a team was playing defense, player contact (n = 338; 82.0%) accounted for the majority of impacts.
Overall Impacts by Player Activity
The most common player activities associated with impacts were delivering a body check (n = 266; 24.2%), ball handling (n = 252; 22.9%), chasing a loose ball (n = 232; 21.1%), or shooting (n = 107; 9.7%). Most often, players did not have clear possession of the ball (without possession: n = 739 [67.2%] vs with possession: n = 359 [32.6%]) at the moment of impact. Player contact (n = 537; 72.7%), followed by stick contact (n = 108; 14.6%), accounted for the greatest proportion of impacts sustained by players without ball possession. In comparison, stick contact (n = 194; 54.0%), followed by player contact (n = 169; 47.1%), accounted for the greatest proportion of impacts sustained by players having possession of the ball. Table 2 provides information regarding team and individual game play characteristics at the time of each verified impact.
All Verified Impacts for Field Location and Player Activity by Player Position a

a Data are shown as n (%).
b Percentages calculated from 1099 total impacts.
c Percentages calculated from 1098 total impacts.
Player contact was nearly equally divided between collisions in which the player delivered versus received an impact (n = 331 [46.9%] vs n = 329 [45.9%], respectively). The magnitude of impacts was similar regardless of role in the collision (PLA: 35.0g, PRV: 1394.0 deg/s vs PLA: 32.2g, PRV: 1116.0 deg/s, respectively). However, an examination of impacts in which players received contact from another player revealed that in the majority of cases, the recipient was unprepared for the impact (n = 281; 85.4%) according to the Lacrosse Collision Readiness Index. 16 In game situations when a player was unprepared for a collision, the impact magnitudes were also higher versus when the player was prepared (PLA: 33.1g, PRV: 1150.0 deg/s vs PLA: 26.6g, PRV: 969.0 deg/s, respectively).
Impacts Directly to the Head
The video analysis showed that the majority of the 1100 verified impacts resulted in direct contact to the head (n = 680; 61.8%). The median PLA and PRV were 35.9g and 1170.5 deg/s, respectively, for all verified direct impacts to the head as compared with 31.2g and 1106.0 deg/s, respectively, for other body locations. Most head impacts occurred in midfielders (n = 305; 44.9%), followed by attackers (n = 182; 26.8%) and then defenders (n = 175; 25.7%). The majority of head impacts among field players resulted from player contact (n = 394; 59.5%), followed by stick contact (n = 235; 35.5%). Most of these impacts struck the side (n = 250; 36.8%), followed by the front (n = 238; 35.0%) of the head. Within head impacts caused by player contact, nearly one-third (n = 212; 31.2%) resulted from a helmet-to-helmet collision. Additionally, more than three quarters (n = 239; 79%) of all stick impacts directly struck the head. Collectively, our findings suggest a mean of 17.4 direct head impacts ≥20g occurring per team during each game. Expressed as a rate, 0.86 (95% CI, 0.79-0.92) impacts ≥20g occurred per PG. Further, our findings indicate that approximately 8.8 head impacts were experienced by each player per season. Table 3 provides additional information regarding head impacts.
Impacts Directly to the Head by Player Position, Mechanism, and Impact Location a

a Data are shown as median (interquartile range) unless otherwise indicated. PG, player-game; PLA, peak linear acceleration; PRV, peak rotational velocity.
b Impact rate = No. of impacts per PG.
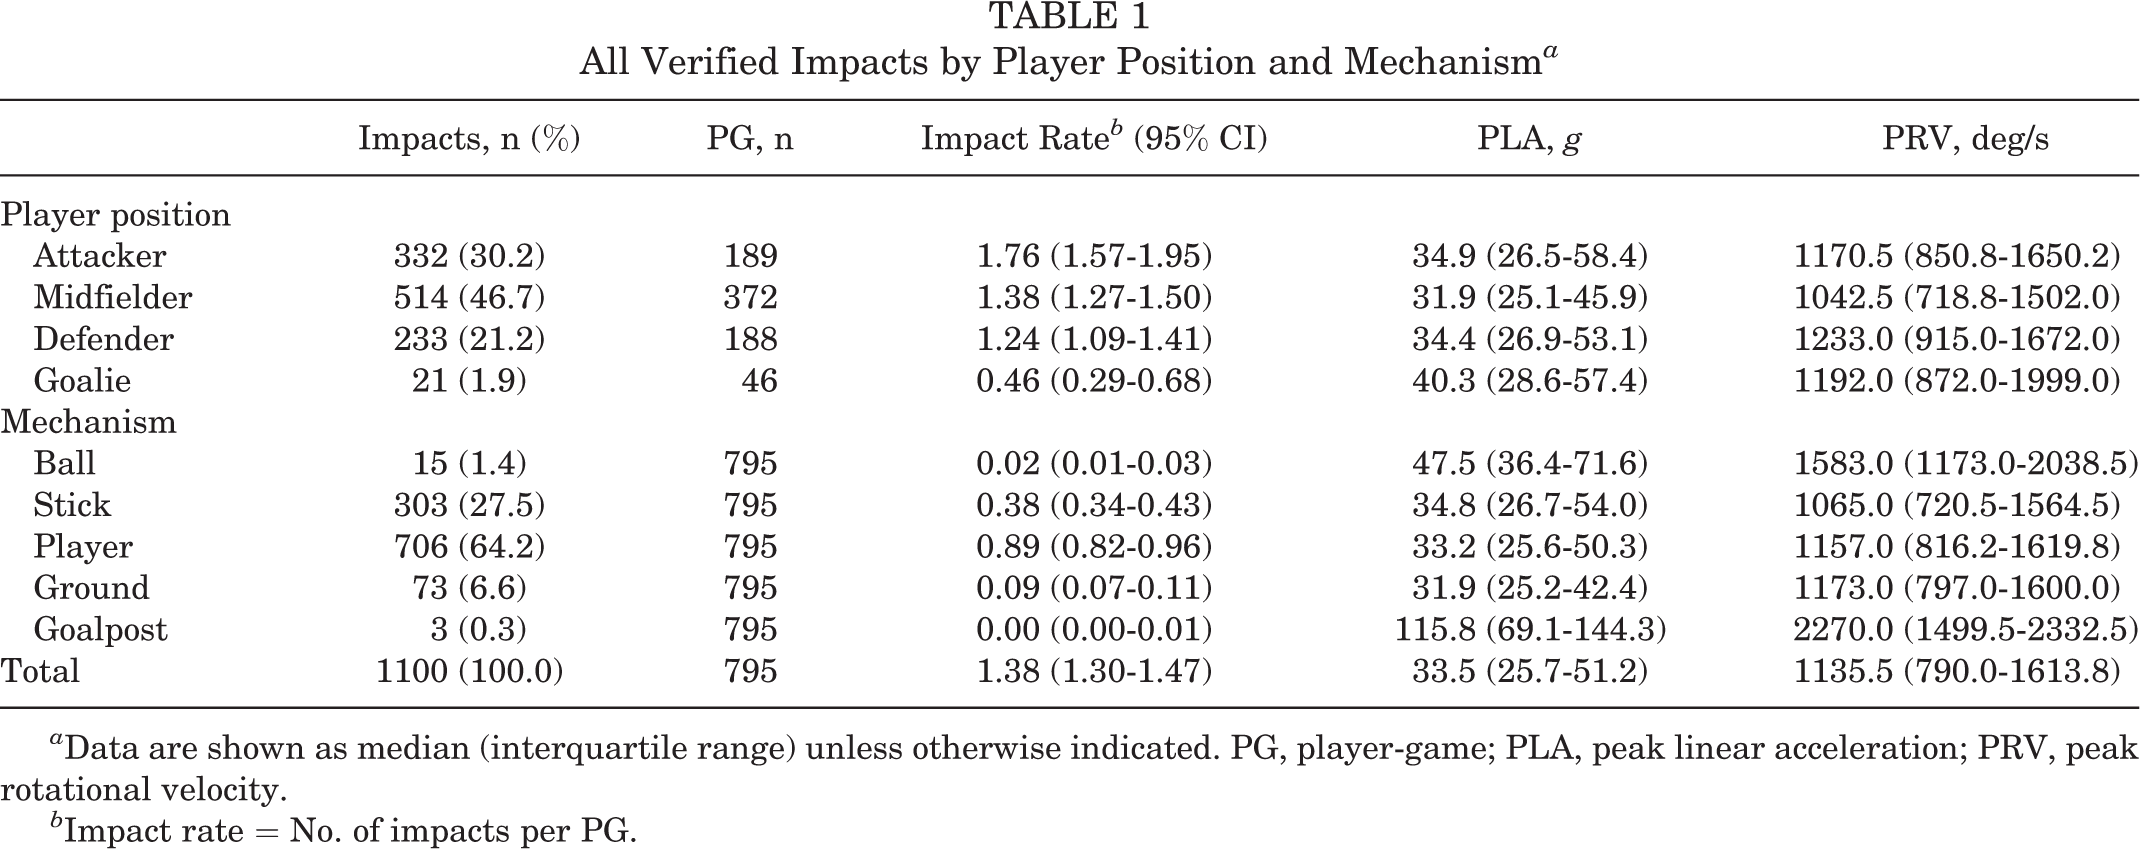
Further restricting our analysis to only verified direct impacts to the head resulting from player contact (n = 397; 56%) showed that in most cases, the affected player was delivering (n = 213 [53.7%]; PLA: 38.3g; PRV: 1203.0 deg/s) rather than receiving contact (Figure 1). In a considerable proportion (n = 104; 48.8%) of these events, the player used his helmet to deliver contact to the opposing player, resulting in a helmet-to-helmet collision. Within direct impacts to the head in which the affected player received contact (n = 141), most were unprepared for the collision (unprepared: n = 107 [75.9%] vs prepared: n = 34 [24.1%]). Unprepared players receiving a direct insult to the head suffered higher impact magnitudes compared with prepared players (PLA: 38.7g, PRV: 1216.0 deg/s vs PLA: 26.1g, PRV: 998.0 deg/s, respectively). Players’ preparedness for head impacts is shown in Figure 2.

Visual representation of the association and distribution of all verified player-to-player direct head impacts by role during the impact and player position. The widths of rectangular areas are proportional to the relative frequency of direct head impacts by player position. The heights of rectangular areas are proportional to the relative frequency of direct head impacts by role during the impact. Each rectangular area provides impact magnitude data: peak linear acceleration (PLA) (top row) and peak rotational velocity (PRV) (bottom row) as median [interquartile range] for each cross-tabulated group.
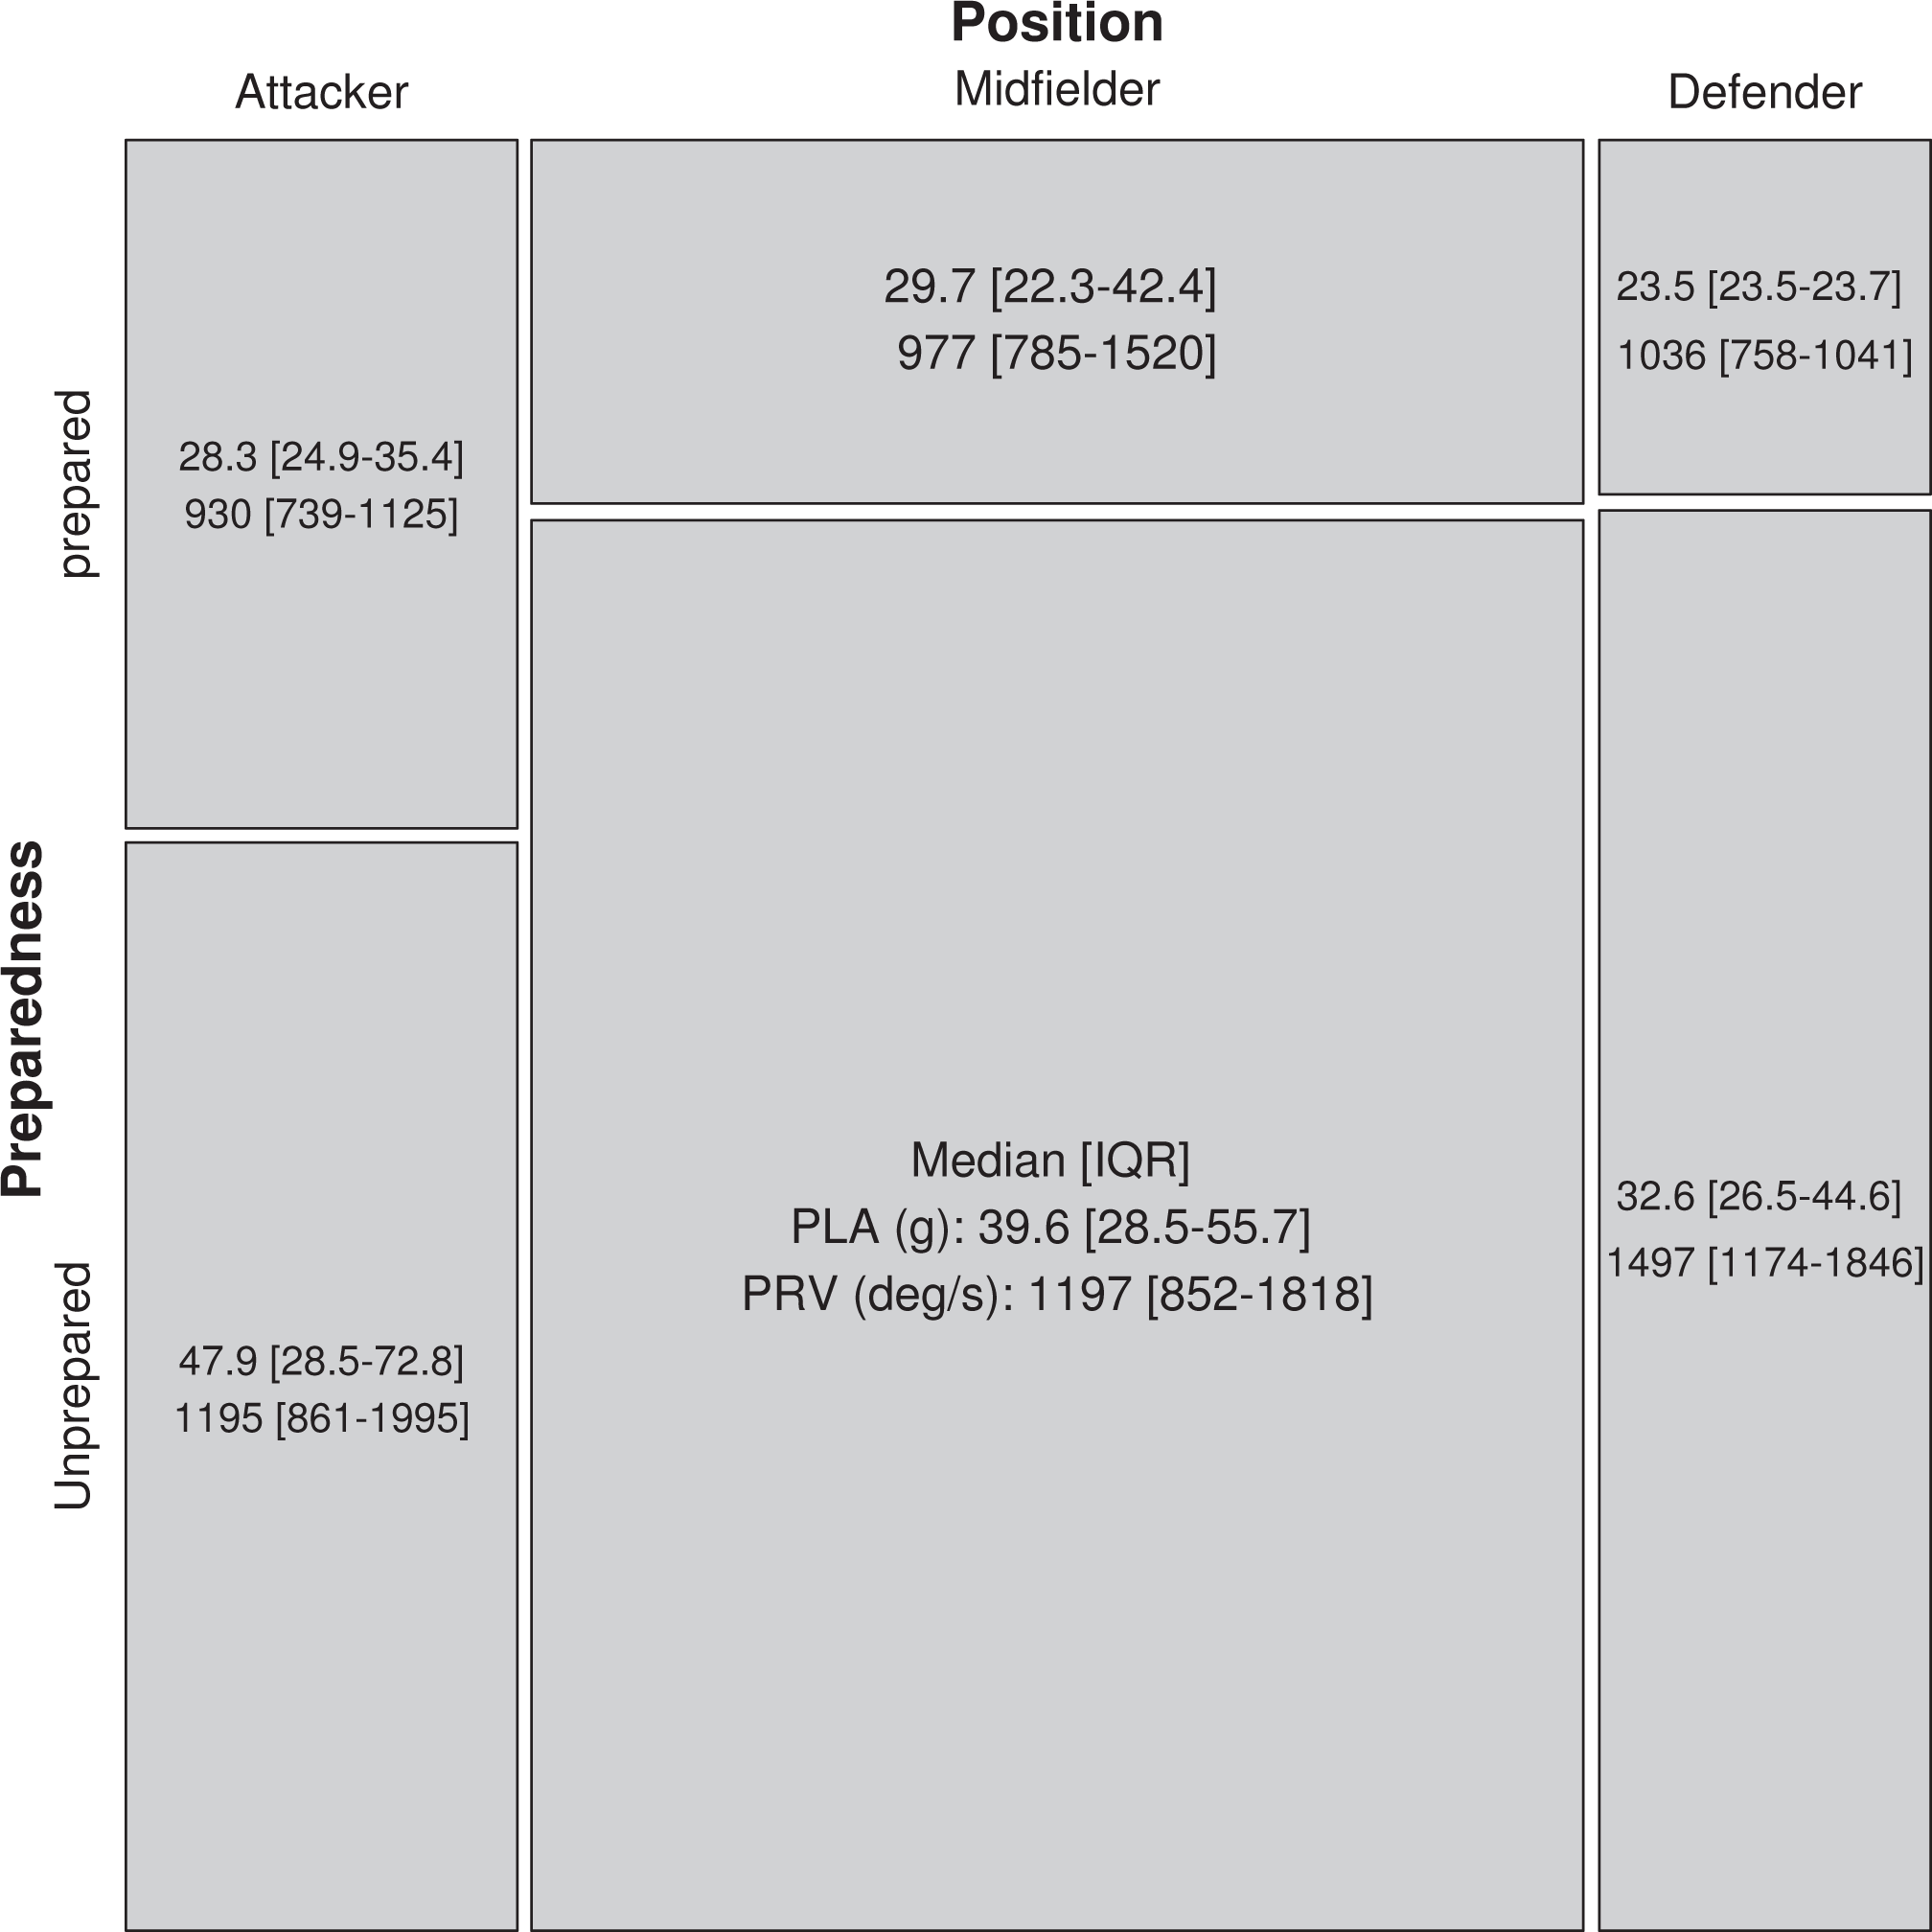
Visual representation of the association and distribution of all verified player-to-player direct head impacts by preparedness for the impact and player position. The widths of rectangular areas are proportional to the relative frequency of direct head impacts by player position. The heights of rectangular areas are proportional to the relative frequency of direct head impacts by preparedness for the impact. Each rectangular area provides impact magnitude data: peak linear acceleration (PLA) (top row) and peak rotational velocity (PRV) (bottom row) as median [interquartile range] for each cross-tabulated group.
Discussion
We combined helmet sensor and video data to describe verified game-related impacts during 3 seasons of boys’ varsity high school lacrosse game play. This approach enabled us to verify and describe impacts with a greater degree of precision than possible when relying solely on helmet sensors. 11 Boys’ lacrosse is a collision sport, and not surprisingly, our findings suggest that impacts regularly occur during game play. The study results demonstrated that midfielders suffer the greatest number of impacts, both overall and directly to the head, followed by attackers, defenders, and goalies. Consistent with prior research, we observed most impacts, both overall and directly to the head, to be caused by body checking, followed by stick contact mechanisms. 14,16,18,33 The magnitude of impacts measured during game play was generally less than that reported to be associated with the diagnosis of a concussion. 5 We observed that most impacts caused by both stick (79%) and body (56%) contact resulted in direct insult to the head. Interestingly, within those caused by body checking, we noted a sizable number to be helmet-to-helmet collisions. Of these, many were suffered by players who were either unprepared for the collision or who used their helmet to deliver the body check.
Overall Impacts
In total, 1100 verified impacts ≥20g occured during the 3 seasons analyzed. This equates to approximately 14 impacts experienced by each player per season, for a rate of 1.38 verified impacts per PG. This is considerably lower than the 7.7 impacts per PG reported among National Collegiate Athletic Association (NCAA) men’s Division I collegiate lacrosse players by Miyashita et al. 24 The proportion of overall impacts by player position was similar to previous reports describing collegiate men’s lacrosse, with midfielders, followed by attackers, sustaining the majority of impacts. 24 However, when examining the rate, rather than counts, of overall impacts, our findings differ in that attackers were observed to suffer the most impacts per PG, followed by midfielders and defenders. Intriguingly, goalies experienced the lowest rate of overall impacts but experienced the highest median magnitude of all impacts. We attribute this to goalies suffering more ball impacts than other positions.
We also observed that most impacts occurred during game play situations when teams were on the offensive and in the attack area of the field. Considerably fewer impacts occurred during face-off situations, which occur in the middle of the field. This was somewhat surprising because of the nature of the face-off frequently involving loose ball situations. Most impacts were caused by body checking, followed by stick checking mechanisms. However, our findings suggest that the mechanism of impact may vary based on the game play situation. For example, when on offense, impacts were nearly evenly divided between player and stick contacts, whereas when playing defense, we observed player contact to account for most impacts.
Similar to other team sports, lacrosse requires that athletes play a large proportion of the game without possession of the ball. Our findings reveal that players most often did not have possession of the ball when suffering an impact. Most players without ball possession suffered an impact as the result of player contact. Although the magnitude of overall impacts was similar regardless of role (delivered vs received), we noted that in a considerable proportion of impacts, players were not prepared or were “defenseless” for the collision that they received. In these impact situations, unprepared players were observed to have higher impact magnitudes compared with prepared players. Collectively, these findings suggest that efforts to reduce impacts to unaware or unprepared players should be undertaken.
Direct Head Impacts
Most prior lacrosse research has reported all impacts as measured using wearable sensors to be a direct impact to the head, without video verification. Combining information from wearable sensors with video provided us with the ability to more accurately identify and describe impacts in boys’ high school lacrosse. Of the 1100 impacts observed, nearly two-thirds (61.8%) directly affected the player’s head. This suggests that a typical high school boys’ lacrosse player participating in our study experienced more direct head impacts per PG than an NCAA Division III men’s lacrosse player (0.65 impacts/PG). 26 At the team level, our findings equate to approximately 17 direct head impacts per team-game. This is more than the 11.5 but considerably less than the 332 impacts per NCAA men’s Division I lacrosse team-game reported by Reynolds et al 30 and Miyashita et al, 24 respectively.
Our findings demonstrated an overall median PLA of 35.9g and PRV of 1170.5 deg/s for all direct head impacts. This is considerably less than the PLA of 98.7g associated with diagnosed concussions reported in a systematic review and meta-analysis by Brennan et al. 5 However, the single concussion observed in our study measured a similar magnitude (PLA: 97.0g). In comparison with other lacrosse research, the magnitudes for game-related head impacts in our study are challenging to contextualize. The median PLA of head impacts measured in our study was lower than that reported by Miyashita et al 24 (∼48.8g) but higher than that reported by Reynolds et al 29 (∼24.7g) during collegiate men’s Division I lacrosse game play. However, our median PLA was similar to a recent report in Division III game play (∼32.5g). 26 Interestingly, our median PLA findings are greater than those reported among both high school ice hockey and football game play. 22,31 Collectively, our findings suggest that boys’ varsity high school lacrosse players suffer fewer head impacts but possibly of similar magnitudes experienced during men’s collegiate lacrosse game play. 24,26,30 These findings indicate that the frequency, but not the magnitude, of head impacts may increase with the level of game play.
Direct Head Impacts by Player Position
Differences in the nature and exposure to head impacts by player position have been explored in sports such as American football and ice hockey. 22,28,31,32 Previous research has examined differences in head impacts by position among men’s collegiate lacrosse players. 15,24,26,30 Miyashita and colleagues 24 found midfielders to experience the greatest frequency of head impacts, followed by attackers, defenders, and face-off specialists. Similarly, our findings demonstrated midfielders to suffer the greatest number of direct head impacts, followed by attackers and defenders. Our findings are also similar to those of Miyashita et al 24 in that we found goalies to sustain the fewest number of direct head impacts, with the majority due to being struck by the ball. However, we were able to account for athlete exposure by position, enabling the calculation of impact rates by position. An examination of the rate of direct head impacts in the present study indicates that attackers (0.96) and defenders (0.93) suffered a similar incidence of head impacts, followed by midfielders (0.82). This finding was unexpected because the midfield position requires athletes to compete in all offense, defense, and transition aspects of the game. Therefore, we anticipated that midfielders would suffer the greatest number of impacts as compared with attackers and defenders, who only compete on offense or defense, respectively. We were unable to track total minutes played for each player in this study. We suspect that the lower-than-anticipated incidence among midfielders in this study may relate to the attacker and defender positions substituting less frequently than midfielders.
Direct Head Impacts by Impact Mechanism and Location
Synchronizing the video analysis with impact-monitoring sensor data revealed player contact (58.4%) to be the prevailing mechanism of direct head impacts in boys’ high school lacrosse game play. This finding supports prior research demonstrating player contact to be the most common mechanism of concussions in high school boys’ lacrosse game play. 16,19,33 Additionally, our findings suggest that the proportion of head impacts caused by stick contact in high school boys’ lacrosse is considerably greater than that observed in collegiate lacrosse (35.1% vs 9%, respectively). 15 Intriguingly, stick contact to the head resulted in similar median impact magnitudes as to those observed from player contact. This finding supports prior research suggesting that boys’ lacrosse helmets effectively attenuate energy from stick impacts. 10
Direct Head Impacts and Game Play
An exploration of game situations demonstrated the number of head impacts to be evenly divided among all 4 quarters of game play and between offensive and defensive game situations. Offensive/goal or defensive areas of the playing field combined to have nearly twice as many head impacts as observed within the midfield region. Most head impacts occurred during settled play or loose ball situations, and fewer were observed during face-off, transition, or special teams play. These findings suggest that players may have a greater opportunity to suffer impacts during settled offensive and defensive game play as compared with unsettled game play or during transition.
Evaluating individual player activity immediately preceding an impact revealed that most players did not have clear possession of the ball. Somewhat unexpectedly, we found that direct head impacts were nearly evenly sustained by players delivering and receiving a body check. Notably, across player positions, we observed higher median PLA and PRV magnitudes when players delivered rather than received a body check. In nearly one-half (48.8%) of these impacts, the player, most commonly a midfielder or defender, initiated contact with his head, resulting in a helmet-to-helmet collision. These findings represent an area of concern, as the NFHS lacrosse rules were revised in 2013 to prohibit initiating contact with the head. Such helmet-to-helmet collisions may be preventable by encouraging the use of proper body checking techniques and enforcement of existing rules.
Players most frequently received a body check that directly impacted the head while attempting to advance the ball or while chasing a loose ball. Most players (75.9%) receiving a blow directly to the head resulting from player contact were unprepared for the impact. Midfielders suffered the greatest proportion of unprepared impacts among all field player positions. Interestingly, across player positions, higher median PLA and PRV magnitudes were measured when players were not prepared to receive a body check. This finding supports prior research in high school lacrosse indicating that in half of all concussion cases, the struck player was unaware or unprepared for the impending impact. 16 Previous research has reported that the majority of concussions in boys’ high school lacrosse result from player contact 19 and that many impacts to the head do not result in a penalty. 7,16 Although only a single case fitting this criterion resulted in a concussion in the present study, such “defenseless hits” are, in many cases, preventable and represent an area for increased player protection via education and rule enforcement.
Limitations
This study is not without limitations. Our findings do not necessarily represent head impacts for all high school boys’ varsity lacrosse players in the United States. As with all wearable devices, the sensor used in this study is susceptible to measurement errors. Prior studies have examined the measurement errors associated with the wearable sensor technology used in this study in both laboratory and field settings. 6,15,24 Findings from these studies regarding the reliability and validity of GFT sensor data are mixed and suggest that caution be used when interpreting and comparing our GFT data with measurements recorded using other wearable devices. Notwithstanding these shortcomings, combining sensor data with video can produce useful information that can be used to describe head impacts in the sport of lacrosse.
Conclusion
The majority of impacts sustained in boys’ high school varsity lacrosse resulted in direct contact to the head subsequent to a collision with another player. Our findings suggest that about one-third of all direct head impacts resulted from a helmet-to-helmet collision. Moreover, a sizable proportion of these impacts were suffered by players delivering a body check and using their helmet to initiate contact with an opponent. Furthermore, we found that struck players were often not prepared to receive a body check. Our findings suggest that a future study examining coaching methods on the proper delivery of and preparedness for receiving a body check is needed. The NFHS lacrosse rules were revised in 2013 to prohibit initiating contact with the head and to protect unsuspecting or defenseless players. Our findings indicate that further studies should also evaluate rule enforcement. Collectively, such efforts may aid in reducing the incidence of helmet-to-helmet collisions and hits to defenseless players in high school boys’ lacrosse.
Footnotes
Acknowledgment
The authors thank the Prince William County Public Schools and the administration, coaching staff, athletes, and parents at Patriot High School for their cooperation with this study.
One or more of the authors has declared the following potential conflict of interest or source of funding: Financial support was received via a grant from the US Lacrosse Sports Science and Safety Committee; funding was primarily used to support equipment and personnel. Publication of this study was funded in part by the George Mason University Libraries Open Access Publishing Fund. S.V.C. and A.E.L. are nonpaid volunteer members of the US Lacrosse Sports Science and Safety Committee. AOSSM checks author disclosures against the Open Payments Database (OPD). AOSSM has not conducted an independent investigation on the OPD and disclaims any liability or responsibility relating thereto.
Ethical approval for this study was obtained from the George Mason University Institutional Review Board (No. 114558/118753).