
Abstract
Background:
Pitch count recommendations are used to reduce injury risk in youth baseball pitchers and are based chiefly on expert opinion, with limited scientific support. Furthermore, they only account for pitches thrown against a hitter and do not include the total number of throws on the day a player pitched. Currently, counts are recorded manually.
Purpose:
To provide a method using a wearable sensor to quantify total throws per game that is compliant with Little League Baseball rules and regulations.
Study Design:
Descriptive laboratory study.
Methods:
Eleven male baseball players (age, 10-11 years) from an 11U (players 11 years and younger) competitive travel team were evaluated over a single summer season. An inertial sensor was placed above the midhumerus of the throwing arm and was worn during baseball games across the season. A throw identification algorithm capturing all throws and reporting linear acceleration and peak linear acceleration was used to quantify throwing intensity. Pitching charts were collected and used to verify actual pitches thrown against a hitter in a game versus all other throws identified.
Results:
A total of 2748 pitches and 13,429 throws were captured. On the day a player pitched, he averaged 36 ± 18 pitches (23%) and 158 ± 106 total throws (pitches in game as well as all warm-up pitches and other throws during game). In comparison, on a day a player did not pitch, he averaged 119 ± 102 throws. Across all pitchers, 32% of all throws were low intensity, 54% were medium intensity, and 15% were high intensity. The player with one of the highest percentages of high-intensity throws did not pitch as their primary position, while the 2 players who pitched most often had the lowest percentages.
Conclusion:
Total throw count can be successfully quantified using a single inertial sensor. Total throws tended to be higher on days a player pitched compared with regular game days without pitching.
Clinical Relevance:
This study provides a fast, feasible, and reliable method to obtain pitch and throw counts so that more rigorous research on contributing factors to arm injury in the youth athlete can be achieved.
Throwing arm injuries to adolescent pitchers continue to rise. Between 2006 and 2016, an estimated 665,133 baseball injuries occurred nationally, with 11.5 years being the mean age of injured players. 15 The increase in injuries at such a young age is critical to address because musculoskeletal injuries early in life increase the risk for subsequent conditions and can reduce overall physical activity participation. Researchers believe that high pitch counts are a primary contributor to injury. 4,6,11 Thus, pitch count limits and mandated rest periods between pitching outings for youth athletes were created and enforced.
The Major League Baseball Pitch Smart Committee has released age-specific guidelines specifying the maximum number of pitches in 1 day (ie, per game) and the required days of rest recommendation before players pitch again, based on the number of pitches thrown in 1 day. 12 Full implementation of these guidelines has been instituted by more than 25 youth baseball leagues in the United States (Table 1). It is important to consider that strong evidence is lacking for appropriate pitch and/or total throw count selection by age. 2
The MLB Pitch Smart Committee Pitch Count Limits and Rest Guidelines a

a Table adapted from Major League Baseball (MLB) Pitch Smart Committee. 12 NA, not applicable.
Pitch count recommendations only consider actual in-game pitches against a hitter. However, debate exists on whether there should be more concern regarding overall in-game pitch counts (ie, the total throw count), as throwing before the game and warming up at the start of each inning are currently not included in the pitch count. It has been reported that high school baseball pitchers throw on average 40% more pitches than are actually counted in a game secondary to warm-up and bullpen throws. 17 Additionally, players who pitch on multiple teams can throw even if they have not rested for the mandated times because their coaches may not be aware of pitching activity on other teams. Furthermore, in youth sports, many athletes play multiple positions per game or throughout the season and accumulate a larger throwing workload than simply that due to pitches. Lastly, current methods of tracking treat each pitch or throw as of equal intensity. Perhaps a reason these factors are not considered in the current Pitch Smart guidelines is because total throw capture and intensity are not easily quantified with current methods.
Wearable sensors have the potential to advance the precision around quantification of throws and classification of intensity. A commercially available sensor embedded in a sleeve has been previously used to capture throw count and intensity in baseball players during a season. 3,16 This sensor does not by definition comply with Little League rules and is currently of limited utility 9 ; however, it should be stated that some leagues now allow the sleeve to be worn. Nonetheless, there is not uniformity allowing a separate sleeve or band on the throwing arm, which is not part of the uniform, and furthermore, some throwers do not like the sleeve around the elbow and the sensor location at the medial epicondyle. Moreover, commercially available devices do not have transparency in their calculation methods of the output used to calculate throwing intensity, and this limits our understanding of the accuracy, application, and interpretation of intensity, particularly across players and levels of skill.
In a previous study, 14 we developed an algorithm that can be used with an inertial sensor to accurately identify all throws and quantify throwing intensity in youth baseball players. This algorithm allows for all throws during game activity to be collected and then pitches to be discerned manually from other throws, as well as transparent classification of throwing intensity. We validated the throw count algorithm against manual recordings. That is, a member of the study team observed each player and recorded each throw using binary switches synchronized with the inertial sensor worn on the upper throwing arm. 14 The placement of a sensor was chosen for athlete comfort and compliance with modern youth baseball regulations.
In the current study, we used the validated method to quantify total game-day throw counts (pitches and throws). The purpose of this study was to provide a method that automatically quantifies total throws per game in youth players that is compliant with Little League Baseball rules and regulations. Specifically, we aimed to (1) describe total throws, including pitches, on regular game days and game days with pitching appearances during a single summer baseball season; (2) examine the intensity of throws across players; and (3) explore the feasibility of sensor use in youth baseball players.
Methods
Participants
Institutional review board approval was obtained for the study protocol. A convenience cohort sample of 11 athletes from an 11U (players 11 years and younger) travel baseball team (age, 10-11 years; height, 1.5 ± 0.08 m; weight, 34.9 ± 4.1 kg) were recruited for participation before the summer season. All participants and their parent/guardian provided informed assent and consent, respectively. All players were free of injury during the time of testing. Player positions and qualitative descriptions of time spent in each position were provided at the completion of the quantitative data collection. This was accomplished by utilizing the GameChanger software application (GameChanger Media), which would be updated by the coach in real time during the game. Thus, the different positions and number of innings played at various positions for each player could be tracked and totaled at the conclusion of the season/study.
Study Design
An observational study was conducted to collect total throws and pitches during games (24 games). All data collection was performed for all the games for the 11U travel team at both their home field and any game where they were the visitor. There were 2 out-of-state tournaments for which data were collected during the summer season as well. Participants were asked to wear a single inertial sensor (inertial measurement unit; GT9X; Actigraph, LLC; linear acceleration measurement range, ±16 g; angular velocity measurement range, ±2000 deg/s; sampling frequency, 100 Hz) on their upper throwing arm during game-day activities over a 4-month period (April-July 2019, ∼85 days). The inertial measurement unit sensor was secured 3 to 5 cm above the lateral epicondyle of the throwing arm of each athlete using a modified protective wrist/forearm guard (EvoCharge; EvoShield, LLC) (Figure 1).
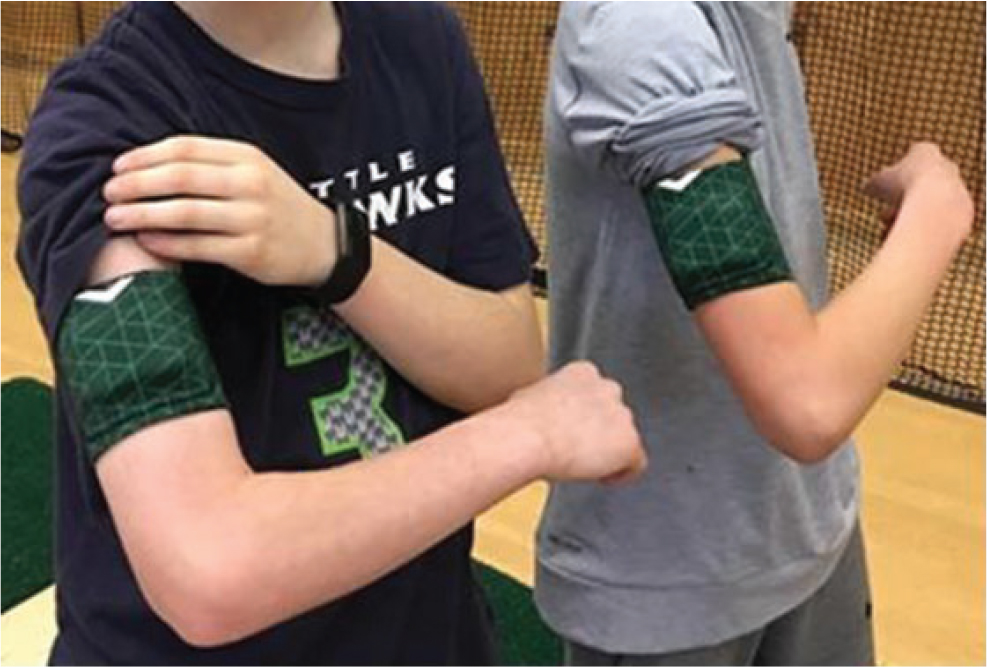
Inertial sensor and depiction of placement during game-day collections. The sensor was secured using a modified protective wrist/forearm guard placed 3 to 5 cm above the lateral epicondyle of the throwing arm. The sensor weighs about 16 g and is approximately 3.5 × 3.5 × 1 cm in size.
Sensors were distributed along with a charging station to each player. A study coordinator (K.A.M.) assigned 1 sensor to each player and provided instructions for how to don the sensor and how often to charge the device. The sensor had a 24-hour battery life, so it needed to be charged when not in use or after game-day collection. The study coordinator collected the sensors every 1 to 2 weeks to download data and recharge and reinitialize the sensors. In an effort to reduce bias, the sensors were assigned a blinded number and were associated with a particular player. Only the study coordinator had access to the master key of which player was matched with which sensor. Additionally, the research coordinator downloaded all GameChanger data in which pitching and player position throwing information would be correlated.
Data Analysis
A custom throw identification algorithm was developed in MATLAB (The MathWorks Inc) using data from a controlled data collection trial. The throw identification algorithm and intensity classification are more thoroughly explained and validated in Rose et al. 14 Throw identification had previously been accurately validated using data from 2 participants who were observed in a simulated practice containing all baseball movements: throwing, running, batting, fielding, sliding, and diving. A total of 196 throws from the 2 participants were correctly identified by the throw identification algorithm with more than 98% accuracy. Features from angular velocity were used in the throw detection algorithm, and linear acceleration data were used to quantify throwing intensity into 3 categories: low, medium, and high. This was done using a quadratic support vector machine and truth data from a structured throwing practice run by the study team and the participating players. Game-day pitchers and pitches were verified using the GameChanger software application.
Statistical Analysis
Means and standard deviations were calculated for pitches and throws for both pitching appearances and regular game days without pitching and for intensity of throws. A 2-tailed paired t test was used to compare throw counts between pitching appearance game days and regular game days without pitching. Alpha = 0.05. Statistical software Stata1C 16.1 (StataCorp LLC, College Station, Texas).
Results
A total of 2748 pitches and 13,429 throws were captured. Distribution of data capture (days of data capture) across the summer season can be found in Supplementary Table S1, available separately. Ten of the 11 participants pitched at least 1 game during the collection (Table 2).
Player Position, Pitching Appearances, and Games Played During the Summer Season a

a 1B, first base; 2B, second base; 3B, third base; C, catcher; CF, center field; OF, outfield; P, pitcher; SS, shortstop.
b Values in parentheses indicate percentage of total pitching appearances.
Despite the players wearing sensors, we only captured or identified total throws (mound pitches and other throws) in an average 36% ± 27% of all game appearances as pitcher. For games played but not pitched, we only captured or identified, on average, 39% ± 2% of all games (Table 3).
Percentage of Games per Player With Total Throw Captured by Inertial Sensor

Pitchers averaged 36 ± 18 pitches per appearance (23%) and 158 ± 106 throws during games in which they pitched. Players averaged 119 ± 102 throws per game without pitching. There was a trend for a larger number of throws on the pitch appearance days compared with the game days (158 ± 106 vs 119 ± 102, P = .08) (Figure 2 and Table 4).

Average total number of throws (gray bars) and in-game pitches (black bars) for each player. Nonpitching appearance game days are games in which participants played but did not pitch; pitch appearance game days are games in which participants pitched in the game as well. All but 1 player (player 4) had a pitch appearance. Notice that throws tended to be higher for pitch appearance games compared with regular game days.
Average Player Pitches and Total Throws in Pitch Appearance Games and Total Throws on Game Days Without Pitching Appearance a

a Data are presented as mean ± standard deviation. Throw counts on pitch appearance games versus regular game days trended higher (P = .08). 1B, first base; 2B, second base; 3B, third base; C, catcher; CF, center field; OF, outfield; P, pitcher; SS, shortstop. Dash indicates not relevant. Empty cells for player 4 indicate no pitches or throws recorded, empty cell for player 7 indicates no throws recorded.
We were able to classify intensity in 77% (12,439/16,177) of all throws and/or pitches captured. Of these, 32% (n = 3984) were low-intensity throws, 54% (n = 6622) were medium intensity, and 15% (n = 1833) were high intensity. Details on throwing intensity and number of high-intensity throws can be found in Figure 3 and Table 5.

Total number of throws per intensity classification for each player. Features derived from the linear acceleration measurements (linear acceleration magnitude, saturation time in linear acceleration data in all 3 axes and both directions for each throw, and peak jerk in each axis) were used for intensity classification. H, high intensity; L, low intensity; M, medium intensity.
Throwing Intensity by Player a
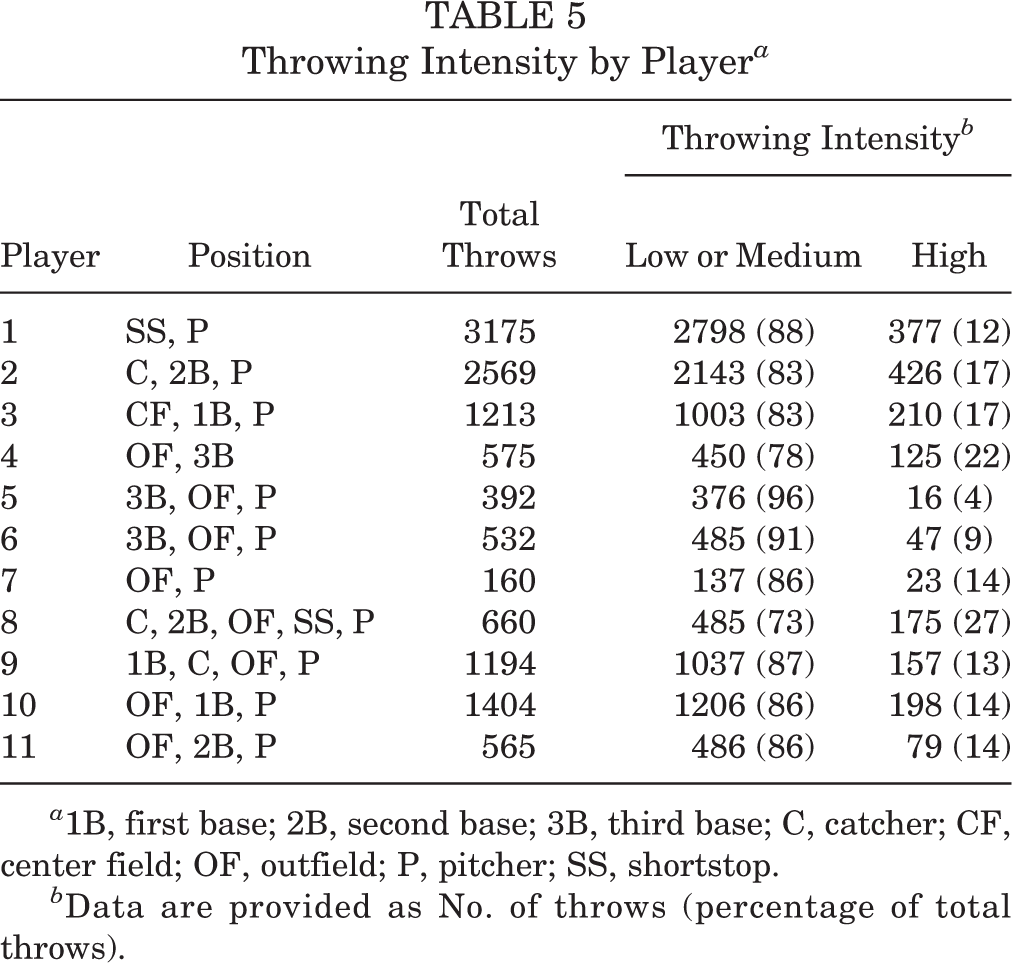
a 1B, first base; 2B, second base; 3B, third base; C, catcher; CF, center field; OF, outfield; P, pitcher; SS, shortstop.
b Data are provided as No. of throws (percentage of total throws).
Discussion
This study provides a real-world example of how a single sensor can be used to automatically detect and quantify total throws in baseball players. Study methods represent a significant first step toward more robust, yet feasible, methodology to track throws. The ability to monitor total throws and categorize intensity with a regulation-compliant sensor can improve workload management and recommendations about thresholds for throws.
To date, only 2 studies have assessed total throw count during a baseball season. Zaremski et al 17 tracked all pitches (live-game, bullpen, and warm-up) in high school baseball pitchers. They found the mean live-game pitches to be approximately 68, with another 51 pitches (bullpen and live-game) unaccounted for. Our study found a mean pitch count of 36, with an additional 122 throws on pitch appearance days. Comparison demonstrated that in-game pitches made up 57% in the study of Zaremski et al study and 22% in our study. The difference in live-game pitches can be due to the difference in skill level (11U vs high school). The higher throw counts can be explained because we included not only all additional pitches (warm-up, bullpen), but also all other throws performed before and during the game. Additionally, at the younger level players are more apt to play other positions during the same game for which they pitch. For example, in Zaremski et al, 17 throwing in the outfield or any other throws not in the bullpen or at the start of an inning were not factored in the throw count. The discrepancy between findings demonstrates the value of using a sensor to count every throw to help assess throwing load and not just focusing on in-game pitches. Wahl et al 16 reported on total throw counts in 11- to 12-year-old players during a season. Our findings are comparable to the mean number of total throws they identified (1682 ± 1751 vs 1666.2 ± 642.2). We had a higher variance likely because of our smaller sample size and enrolling some players who likely played all games (all innings) and some who played fewer games and/or innings.
Importantly, throw counts were higher for players on pitch appearance days compared with nonpitching appearance game days. Expectantly, all but 1 player (player 5) had higher total throws for the games they pitched compared with the games as only a position player. Two players (players 2 and 11) had substantially higher throw counts during game appearances than the other pitchers. Player 2 also had the highest average throws on regular game days. Speculation could be made that this higher throw count was because of his position as catcher. One study found that catchers accumulate higher workloads and are thought to have a higher risk of injury. 6 However, player 8 had one of the lowest counts and reported his position as catcher as well. This likely is explained by playing catcher, but not being the starter. Continued efforts to demarcate throws for time in each position would help to clarify the contribution of player position to workload estimates and risk of injury.
The number and percentage of high-intensity throws varied across players. Two players (players 1 and 2) had a substantially larger volume of high-intensity throws compared with other players, but this difference was washed out when compared with all throws. Importantly, pitching did not completely explain the high volume of throws as player 2 only pitched in a few games and primarily played catcher. Additionally, the percentage of high-intensity throws relative to total throws was not as high as that of other players. The players who pitched most frequently (players 5 and 6) had the lowest percentage of high-intensity throws of all players. Interestingly, the player with one of the largest percentages of high-intensity throws (player 4) did not pitch at all during the season. It is challenging to compare our findings with those of other studies. While Wahl et al 16 reported on high-effort throws for adolescent players over a season, they used a commercial sensor that did not specify a method for classifying throwing intensity. Without known thresholds to classify intensity, it is difficult to compare data across studies. Additionally, the sensor used in this study demonstrated limitations for classifying throwing intensity.
Our results support the need for continued work in surveilling all throws and the intensity of throws across all youth baseball players. Erickson et al 4 reported on exceeding Little League pitch counts and the future risk of requiring an ulnar collateral ligament reconstruction. However, many players who do not primarily pitch are accumulating a high volume of throws and high-intensity throws without rupturing their ulnar collateral ligament. Currently, many focus on pitch intensity as a surrogate for elbow torque and pitch count as a surrogate for accumulated mechanical stress at the elbow for its link to elbow injury. 1,3,10,13 However, these links are substantiated largely by cross-sectional data collected in a laboratory setting 5,7,8 or retrospective survey data. 11 This study indicates that all throws can be captured during games (in addition to practices) with a single sensor. Moreover, the use of algorithms that provide transparent calculation methods from raw sensor data can facilitate better comparison across samples and increase the scale of data collections in youth baseball players.
A major objective of this study was determining the feasibility of applying this new method of throw count quantification. While data analyses revealed that many throws were not captured, the overall compliance of wearing the sensors was good. We fully captured data (all throws and mound pitches) in only 36% of all pitch appearance days. Participants in the study were adolescents and only received 1 (brief) instructional session by the research coordinator regarding donning and charging. Based on inconsistencies in total data days, it appears the sensors were not always charged appropriately. This can be accounted for based on our selected hardware (ie, sensor capabilities) and study protocol. Specifically, player accountability for recharging their personal sensors added a variable that was hard to police daily. The research coordinator checked in with players every 1 to 2 weeks to collect downloaded data. Thus, charging limitations and download capabilities were present. In the future, a sensor with a higher measurement range (at least ±4000 deg/s) and an on/off switch should be used so data can be recorded only during baseball activities to preserve battery life and mitigate data loss.
Future research methodological improvements would include having participating teams of different ages and competition levels record a log of when the team practices and who attended, as well as having the participating players record a log of when they threw outside of practices and games and hopefully wearing the sensor in those instances. A combination of the data with current game logs would allow the study team to estimate the workload if all the sensors do not work 100% of the time. As an example, if a player was present in the practice log for a day during which their sensor data were missing, the study team could estimate their throwing load by looking at their typical throws made during other practices.
Limitations
This study has several limitations. First, we had missing data due to noncompliance or technical issues with sensor wear. The lack of a complete data set from which to interpret could have influenced our findings. Second, we were unable to denote which throws were done when playing which position. This limits the ability to decipher whether player specific positions (eg, catcher) resulted in a higher volume of throws, although this could be inferred. Several of the game days were doubleheaders. Our sensors were set to capture on a day-to-day basis; therefore, we were unable to split the games on those days to determine the throws per game on those occasions. Lastly, this study concentrated on a single summer season of a single 11U travel baseball team in the Midwest, and teams in other US regions may play more games, have more tournaments, and have fewer games cancelled because of inclement weather. Finally, although the research coordinator was the only study member with knowledge of the sensor numbers and the players they were assigned to, bias still could have been present, as reminders to recharge the sensors were sent to the players or their parents.
Conclusion
In the youth baseball player, a substantial amount of throwing is not accounted for in official pitch counts. Players tend to throw a higher volume of throws during their pitch appearance days compared with game days in which they only play in the field and do not pitch. Positions other than pitcher throw a high volume and can have a higher volume of high-intensity throws. Throws can be captured from a single wearable sensor. Compliance and full-data capture of throws can be increased by selecting the appropriate sensor (longer battery life) and by providing additional training to players or having more frequent check-ins to increase compliance and reduce any technical malfunctions. Quantitative throw counts can help to increase the precision of pitch count recommendations to help reduce overuse injuries in adolescent athletes.
Supplemental material for this article is available at https://journals.sagepub.com/doi/full/10.1177/23259671231151450#supplementary-materials.
Supplemental Material
Supplemental Material, sj-pdf-1-ojs-10.1177_23259671231151450 - Game-Day Pitch and Throw Count Feasibility Using a Single Sensor to Quantify Workload in Youth Baseball Players
Supplemental Material, sj-pdf-1-ojs-10.1177_23259671231151450 for Game-Day Pitch and Throw Count Feasibility Using a Single Sensor to Quantify Workload in Youth Baseball Players by Michael T. Freehill, Michael J. Rose, Katherine A. McCollum, Cristine Agresta and Stephen M. Cain in Orthopaedic Journal of Sports Medicine
Footnotes
Final revision submitted September 15, 2022; accepted October 21, 2022.
One or more of the authors has declared the following potential conflict of interest or source of funding: This study was funded by a grant from Major League Baseball. M.T.F. has received grant support from Encore Medical, education payments from Evolution Surgical, consulting fees from Smith & Nephew and Stryker, royalties from Smith & Nephew, speaking fees from Smith & Nephew, and hospitality payments from Integra LifeSciences and Wright Medical. AOSSM checks author disclosures against the Open Payments Database (OPD). AOSSM has not conducted an independent investigation on the OPD and disclaims any liability or responsibility relating thereto.
Ethical approval for this study was obtained from the University of Michigan (reference No. HUM00157216).
References
Supplementary Material
Please find the following supplemental material available below.
For Open Access articles published under a Creative Commons License, all supplemental material carries the same license as the article it is associated with.
For non-Open Access articles published, all supplemental material carries a non-exclusive license, and permission requests for re-use of supplemental material or any part of supplemental material shall be sent directly to the copyright owner as specified in the copyright notice associated with the article.