
Abstract
Background:
Surveillance programs are vital to analyze the cause and nature of lesions and ultimately establish protocols of action to lower injury rates.
Purpose:
To evaluate the adherence of team doctors to an electronic surveillance system and determine the incidence and characteristics of injuries among soccer players participating in the 2017 Gold Cup.
Study Design:
Descriptive epidemiological study.
Methods:
All data were collected from the electronic medical reports submitted during each match of the 2017 Gold Cup. Twelve teams participated in the tournament (each with 23 players), for a total of 276 players. A 19-question online survey was filled out by the team physician after each injury. Each report contained the player’s number, the exact time of injury (minute of play), the location and diagnosis of injury as indicated by a previously defined code, and its severity in terms of the number of days of absence from training and match play.
Results:
The electronic reporting system had a response rate of 100.0%, with 97.2% of questions answered completely. The mean age of injured players was 27 years (range, 21-35 years) and was not statistically significantly different from the overall mean player age (P > .05). There were no significant differences in the frequency of injuries when analyzed by player position (P = .743). The overall rate of injuries was 1.04 per match, with the most common injuries being contusions (42.3%), sprains (7.7%), strains (7.7%), and fractures (7.7%). These injuries were more commonly the result of contact (75.0%) than noncontact (25.0%) mechanisms (P < .001). Injuries most commonly occurred between the 60th and 75th minute of play when comparing all 15-minute time intervals (P = .004).
Conclusion:
This study supports the use of electronic injury reporting, which demonstrated a high level of adherence among an international cohort of team physicians and has significant potential for improving injury surveillance and tracking responses to prevention programs. Injury rates in the Gold Cup were similar to those in previous studies and demonstrated the highest rates late in the second half of the game, specifically between the 60th and 75th minute of play.
Soccer is the most popular sporting event worldwide, reaching a total audience of 3.2 billion viewers during the 2014 World Cup. 7 The sport accounts for over 228,000 injuries per year in the United States alone and results in a worldwide cost of over $30 billion. It has been reported that setting protocols for action to prevent injuries and to ensure good medical attention at all levels is key, and therefore, surveillance programs should be implemented to identify and quantify epidemiological characteristics that might pose a higher risk for players. In this regard, surveillance programs are vital to analyze the cause and nature of injuries and ultimately to establish protocols of action to decrease the risk and rate of injuries. Sports injury surveillance is part of the “sequence of prevention,” in which the first steps focus on the incidence and severity of injuries, followed by the cause and mechanism. 12 Once these steps have been performed, preventive measures can be proposed to address sport-specific lesions. 12
Prior studies have shown that players and staff members in professional soccer teams strongly support the use of evidence-based injury prevention programs, 9 and therefore, this evidence-based approach should be utilized to diminish the incidence of injuries in soccer. The Gold Cup is a tournament competition with 12 participating nations that qualify from each of the 3 subregions of the Confederation of North, Central American and Caribbean Association Football (CONCACAF): North America (3 automatic entrants), Central America (4.5 qualifiers through the Copa Centroamericana), and the Caribbean (4.5 qualifiers through the Scotiabank Caribbean Football Union Men’s Caribbean Cup). The tournament was selected to test a new electronic surveillance program with the aim of (1) evaluating the adherence of team doctors to an electronic surveillance system and (2) determining the incidence and characteristics of injuries sustained by soccer players participating in the 2017 Gold Cup.
Methods
The injury definition and data collection procedure were in accordance with the respective consensus statement for soccer injuries. 3,6 All data were collected from the medical reports submitted at each match during the 2017 Gold Cup, which was held in the United States during June and July of 2017. All 12 teams playing in the Gold Cup agreed to participate in this study.
Definition and Data Collection
An injury was defined as “any musculoskeletal complaint (including concussion) that occurred during a match and received medical attention from the team physician regardless of the consequences with respect to absence from the match or training.” 6 As reported for previous soccer tournaments, every team’s chief physician was asked to report all injuries after each match on a specially designed online injury survey via a smartphone or tablet.
Injury Report
The utilized survey was the same as one previously reported (online version) 10 and included the team name, adversary, date and time of the match, and details about the doctor and his/her contact details in case such further information was needed. Each report contained the player’s number, the exact time (elapsed minutes during the match) at which the injury occurred, the location and diagnosis of the injury as indicated by a previously defined code, and its severity in terms of the number of days absent from training and match play. An injury was considered to be a contact lesion when there was physical contact with another player or object, excluding the ground. Recorded data included whether the referee imposed any sanctions (red or yellow cards) or the injured player required any medical treatment during or after the match.
A coding system was used to indicate the position of the lesion as follows: trunk (1: head; 2: neck; 3: thoracic spine; 4: lumbar spine; 5: sternum and ribs; 6: abdomen; 7: pelvis and sacrum), upper limbs (11: shoulder; 12: arm; 13: elbow; 14: forearm; 15: wrist; 16: hand; 17: fingers; 18: thumb), and lower limbs (21: hip; 22: groin; 23: thigh; 24: knee; 25: shin; 26: Achilles tendon; 27: ankle; 28: foot; 29: toes). The codes used for the diagnosis included the following: 1: concussion and loss of consciousness; 2: concussion without loss of consciousness; 3: fracture; 4: dislocation; 5: muscular rupture; 6: tendon strain; 7: ruptured ligament with instability; 8: ruptured ligament without instability; 9: meniscal injury; 10: sprain; 11: strain; 12: contusion; 13: bursitis; 14: tendinitis; 15: laceration or abrasion; and 16: other. Coding the injury was at the discretion of the team physician based on a physical examination and, when necessary, radiographic or advanced imaging. Furthermore, the team physician was responsible for estimating the game time at which injuries occurred.
Statistical Analysis
The data were analyzed to determine the presence of a normal distribution. For comparisons of normally distributed continuous variables, an independent t test was utilized. For comparisons of nonnormally distributed continuous variables, the Mann-Whitney U test was utilized. Comparisons of 2 categorical data were performed using the chi-square and Fisher exact tests. To evaluate for correlations, the Spearman rho test was utilized. All P values were 2-tailed, and P values <.05 were considered statistically significant. All statistical analyses were performed with SPSS version 9.4 (IBM). There was no prior power analysis as the study was a retrospective review of surveillance data. This type of design and sample size may increase the chance of a type II error.
Results
Demographics
Each of the 12 teams who participated in the 2017 Gold Cup had 23 players, for a total of 276 players (all male) with a mean age of 27 years (range, 16-38 years). Of the players, 37 were goalkeepers, 94 defenders, 88 midfielders, and 57 forwards. The mean body mass index was 22.9 kg/m2.
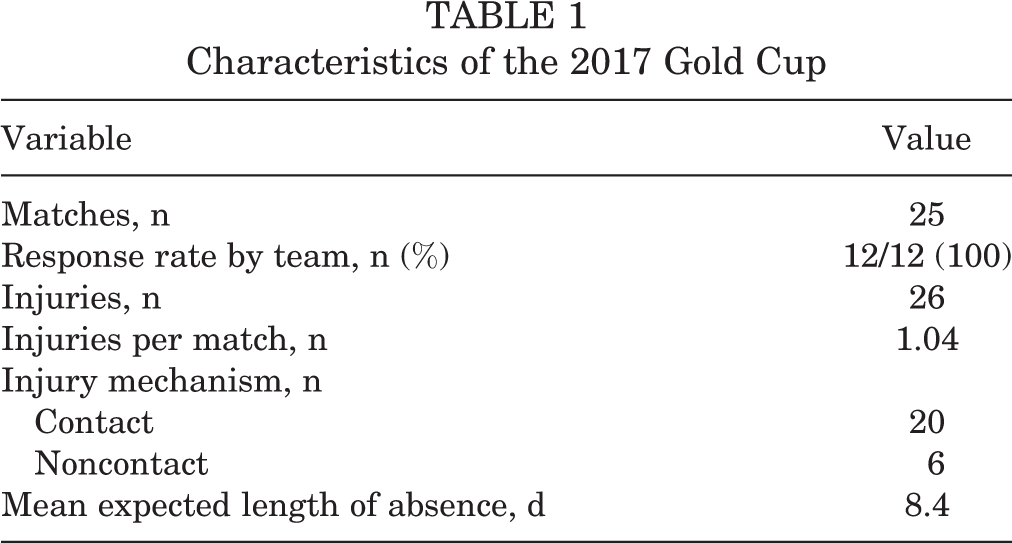
The mean age of injured players was 27 years (range, 21-35 years) and was not statistically significantly different from the overall mean player age (P > .05). The mean number of matches played per team was 5 (range, 3-7). Detailed data for the overall and injury cohorts are reported in Table 1.
Characteristics of the 2017 Gold Cup
Response Rate
The electronic surveillance survey consisted of an online questionnaire that each physician was required to fill out after each injury. There were 19 questions asked, which are listed in Table 2 along with the response rate for each question. The overall response rate was 100.0% of the injuries reported to the chief medical officer of the tournament. The physicians answered 97.2% of the survey questions.
Response Rates to Survey Questions

Injured Player Characteristics and Injury Type
Of the 276 players, there were 26 injuries (9.4%) recorded over the course of the competition. The player position with the greatest number of injuries per players in that position was forward (14.0%); these injuries accounted for 30.7% of the total 26 players injured. The injury rates for the other positions were as follows: goalkeeper, 10.8% (16.0% of injuries); defender, 7.4% (26.9% of injuries); and midfielder, 6.8% (23.1% of injuries). Although forwards experienced the most injuries, the increased number of injuries was not statistically significant when compared with the other positions (P = .743). The distribution of injuries by position is reported in Figure 1.

Distribution of injuries by player position. There were no significant differences in the rate of injury between the 4 player positions (P = .743).
Twenty-five (96.2%) of the injuries were new injuries, while only 1 injury was a recurrence of a previous Achilles sprain. There were a significantly greater number of contact injuries (n = 20) than noncontact (n = 6) injuries (P < .001). The distribution of reported injuries by injury type is presented in Figure 2.

Distribution of reported injury by injury type.
Match Factor Injury Characteristics
When the game was divided into 15-minute intervals, there was a statistically significant increase in the number of injuries between the 60th and 75th minute of play compared with all other time intervals (P = .004) (Figure 3). However, there was a nonsignificant correlation between the frequency of injuries and increasing match minutes (rho = 0.158, P = .136).

Distribution of injuries by time interval during match.
Discussion
The most important finding obtained from this study was the response rate from team physicians, which was 100.0%, with 97.2% of questions being answered completely. Evidence-based injury prevention in sports relies on surveillance programs that allow for the quantification and qualification of injuries that occur. We sought to determine the adherence of doctors to the surveillance system and the incidence of injuries occurring in elite soccer players participating in the 2017 Gold Cup. The ultimate goal of gathering this type of data is to help develop injury prevention protocols in soccer and reduce overall injury rates. The response rate for our study was slightly higher than that in similar studies, which varied from 84% to 97%, although these studies did not use electronic surveys. 4,6 It is possible that the increased physician adherence seen in our international physician cohort is because the survey was administered electronically. Electronic surveys can be accessed on smartphones, which are readily available to all team doctors. With smartphone application technology exploding in complexity and popularity, this study’s findings introduce a potential change in the paradigm in the near future to improve injury surveillance and prevention. Furthermore, such technology may allow coaches and team physicians to monitor and study the rates of injuries in players at a lower level of competition.
The incidence of injuries in this championship series was 1.04 injuries per match. This injury rate is similar to the 1.68 injuries per match reported during the 2014 Fédération Internationale de Football Association (FIFA) World Cup and the 1.55 injuries per match reported in the 2015 American Cup. 4,10 The majority of the injuries during the Gold Cup occurred during the second half of the game (78%), with the highest rate of injuries occurring during the 60th to 75th minute of play (32%). Previous studies have demonstrated increased rates of injuries in the second half of the game or at the end of each half. 2,10 We hypothesize that the increased injury rate in the second half of the game may be a result of fatigue, which is known to cause deleterious effects on performance. 1,8,11 Another explanation may be an increase in player intensity as a half or match nears the end. As the tournament progressed from the knockout stage to the final game, we did not find an increase in the injury rate.
Injuries were predominantly found in the lower extremity, followed by the upper extremity, head, and trunk. The men’s FIFA World Cup and Olympic games from 1998 to 2012 have demonstrated similar injury distributions, with the lower extremity accounting for 67% to 73% of injuries. 5 Muscle strains, ligament sprains, and contusions are typically the most common injuries in soccer. 2 In the Gold Cup, muscular contusions, muscular lesions, strains, and sprains were among the most common injuries. These results are similar to those in the FIFA World Cup, which showed contusions comprising 38% to 51% of injuries, strains comprising 14% to 24%, and sprains comprising 8% to 15%. 5 Most injuries are the result of contact with another player, as seen in the 1998 to 2014 FIFA World Cup (63.4%-80%) and the American Cup (68.1%) as well as in our study (75.0%). 4,5,10
The player’s position on the field did not affect the frequency of injuries; however, the types of injuries seen differed. Goalkeepers’ injuries tended to result from contusions to various body parts and all from contact. Defenders suffered a wide variety of injuries, with 4 contusions, 2 tendon strains, and a muscular neck lesion. Midfielders had 2 contusions, a thigh muscular lesion, an Achilles sprain, and a hip fracture. Forwards had 3 muscular lesions, 2 contusions, a meniscal tear, and a hand fracture. A reinjury was only recorded in 1 player (4%) in our study, which is lower than the recorded 12% in a Union of European Football Associations (UEFA) study. 2 It is possible that the number of reinjuries was underrepresented in the present study. The injuries seen in this study caused a mean loss of playing time of 8.4 days, with a range from 1 to 30 days.
While the data in this study provide valuable information to add to the collection of data on high-level soccer tournaments, there are several limitations. The study is of a limited time frame, lasting the course of only 25 games. While this provides information pertinent to high-intensity matches, the results may not be representative of an entire season’s injuries. It is possible that tournaments, with their finite duration and possible higher intensity of play, produce a different distribution of injuries when compared with those occurring during an entire season. Our injury database had no reported concussions, and the only head trauma was an eye contusion. The rate of concussions in the FIFA World Football Tournament from 1998 to 2012 ranged from 1% to 5%. 5 Our sample size was smaller in comparison, and because of less overall match exposure, there were no reported concussions along with other possible rare but important injuries. It is also possible that players are not reporting injuries to physicians during tournament play that they would normally report during their regular season, such as concussions, overuse-type injuries, or repeat injuries that are familiar to them. These limitations, while important, should not detract from the study as a whole, which takes a critical look at injuries occurring during championship-style tournaments. It is important to characterize injuries occurring in a variety of play settings, as they may differ.
Conclusion
This study supports the use of electronic injury reporting, which demonstrated a high level of adherence among an international cohort of team physicians and has significant potential for improving injury surveillance and tracking responses to prevention programs. Injury rates in the 2017 Gold Cup were similar to those in previous studies and demonstrated the highest rates late in the second half of the game, specifically between the 60th and 75th minute of play. Information from this study regarding specific injury patterns and timing of player injuries should drive future research as to what preseason and in-season training techniques can be utilized to prevent these injuries.
Footnotes
One or more of the authors has declared the following potential conflict of interest or source of funding: W.E.G. is a consultant for Arthrex. M.B.G. is a consultant for Arthrex, Ferring Pharmaceuticals, Stryker, and Medacta. B.R.M. is a consultant for Arthrex, DePuy, Exactech, and Regen Biologics.
Ethical approval for this study was obtained from the CONCACAF Soccer Survey.