
Abstract
Background:
Jones fractures result in subsequent dysfunction and remain an issue for athletes.
Purpose:
To (1) describe the epidemiology, treatment, and impact of Jones fractures identified at the National Football League (NFL) Scouting Combine on players’ early careers and (2) establish the value of computed tomography (CT) to determine bony healing after a fracture in prospective players.
Study Design:
Cohort study; Level of evidence, 3.
Methods:
All players who attended the combine between 2009 and 2015 were retrospectively reviewed to identify their history of Jones fractures. The playing position, treatment method, and number of missed collegiate games were recorded. The mean overall draft pick number, number of games started and played, snap percentage, and position-specific performance scores (fantasy score) over the first 2 years in the NFL were compared between players with fractures and controls. An imaging classification system was applied based on grading of each quadrant of the fifth metatarsal (plantar, dorsal, medial, lateral), with a score of 0 for not healed or 1 for healed.
Results:
Overall, the number of Jones fractures identified was 72 in 2285 athletes (3.2%), with all treated via intramedullary screw fixation. The mean overall draft pick number for players with fractures was 111.2 ± 67.9 compared with 99.0 ± 65.9 for controls (P = .12). Performance scores for players with fractures were lower than those for controls across all positions, with a significant difference in running backs (2.6 vs 4.0, respectively; P < .001) and defensive linemen (1.4 vs 2.3, respectively; P = .02). The mean CT score was 2.5 ± 1.3. Of the 32 athletes who underwent imaging, 16 Jones fractures (50.0%) were healed or nearly healed, 12 (37.5%) were partially healed, and 4 (12.5%) showed little or no healing. The plantar cortex demonstrated the least healing (18/32; 56.3%), followed by the lateral cortex (15/32; 46.9%). Players with a mean score <1 were found to have fewer games started (2.7 ± 2.5) than those with 1 to 3 cortices healed (17.4 ± 10.4) or all cortices healed (8.7 ± 11.2).
Conclusion:
Based on CT, 50% of all players with a previous Jones fracture demonstrated incomplete healing. Moreover, position-specific performance scores over the first 2 years of a player’s career were lower across all positions for those with fractures compared with controls. Players with CT scores <1 were found to start fewer games and were drafted later than controls.
Proximal fifth metatarsal fractures are among the most common forefoot injuries and are frequently encountered in elite athletes. Historically, fractures in this area have been divided into 3 anatomic zones (Figure 1), with zone I being tuberosity avulsion fractures, zone II being Jones fractures that occur at the junction between the proximal diaphysis and metaphysis of the fifth metatarsal without distal extension beyond the fourth to fifth intermetatarsal articulation, and zone III consisting of those termed as proximal diaphyseal fractures that occur immediately distal to the Jones fracture’s anatomic area. 2,3 Zone II and III fractures, that is to say, excluding tuberosity avulsion fractures, have been reported to have similar outcomes, with no significant differences in satisfaction, return to work, return to sport, time to complete bone union, or complication rates. 2
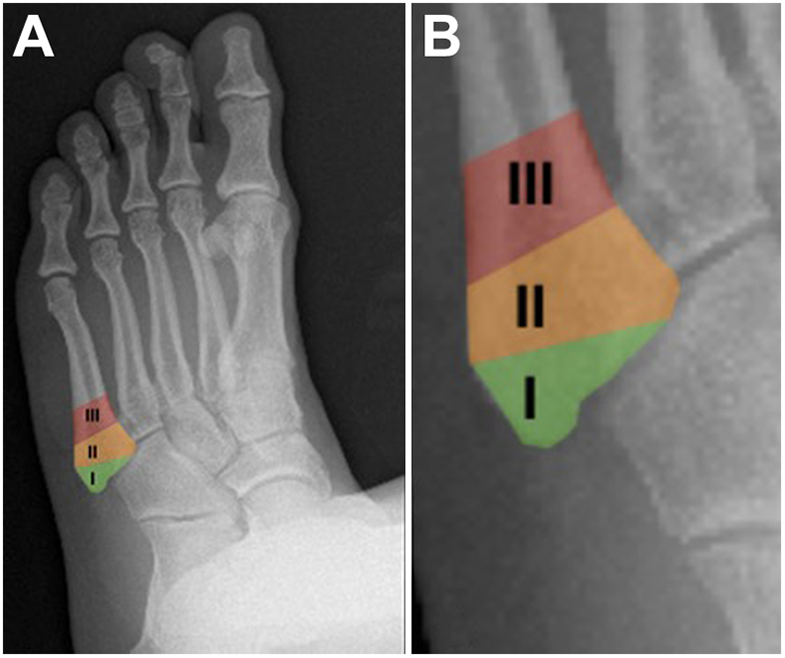
Normal radiograph of a left foot. (A) The 3 zones: zone I (tuberosity avulsion fracture), zone II (Jones fracture), and zone III (proximal diaphyseal fracture [stress fracture]). (B) Closer view of the zones.
Delayed healing is common for zone II, or Jones fractures, and is often attributed to a combination of poor retrograde blood supply and significant mechanical forces during repetitive loading. 18 Because of unfavorable nonoperative results, operative management in the form of intramedullary screw fixation has become the treatment of choice for high-demand athletes. 6 This has resulted in expedited return to play and improved outcomes. 9
A refracture after the treatment of fifth metatarsal fractures continues to be a major concern, may be related to early return to play, and sometimes occurs after apparent fracture resolution. 5,7,10,15,23 Prior studies have noted a 12.2% and 7% nonunion rate for Jones fractures in National Football League (NFL) athletes. 1,14 While nonunion remains a concern, the impact of Jones fracture healing on NFL performance has not been fully appreciated.
The present study includes a large number of players representing many different positions. This allowed for a robust performance and volume analysis comparing the NFL performance of players with a prior Jones fracture to controls. Additionally, advanced imaging in the form of computed tomography (CT) was performed on many of these players. This enabled the creation of a CT-based radiographic healing score. CT-based union scores have been previously described to assess healing of tibial shaft fractures after intramedullary fixation. 8,22 It is possible that such a scoring system could prove useful in managing patients with Jones fractures.
Our objectives were to (1) describe the epidemiology, surgical treatment, and impact of Jones fractures identified at the NFL Scouting Combine on players’ early NFL career and (2) establish the reliability and validity of CT to determine healing after a Jones fracture in prospective NFL players.
Methods
Data Collection
After approval from an institutional review board and the NFL Players Association and the NFL Physicians Society, a retrospective review of all fifth metatarsal base injuries identified at the NFL Scouting Combine was conducted. The annual NFL Invitational Scouting Combine provides an opportunity for the nation’s top collegiate football players to demonstrate their potential to compete at the professional level. The combine serves as a central NFL tryout for all invited players to display their skills. In addition to a player’s physical performance, the medical history and physical examination are key portions of his overall evaluation. This allows teams to formulate a comprehensive player grade or ranking that corresponds to his anticipated future performance and perceived value. As part of the medical evaluation, various imaging modalities including radiography and CT are used liberally to assess reported injuries, previous surgery, current symptoms, and abnormal examination findings.
Study inclusion criteria consisted of any offensive or defensive player who participated in medical and performance testing at the NFL Combine from 2009 to 2015. Imaging data were reviewed to confirm the presence of a prior fifth metatarsal base fracture. Players having undergone CT after prior intramedullary screw fixation for fifth metatarsal base fractures were further separated for additional analysis. The time from the surgical intervention to CT was not available.
Demographic data, including position, missed college games, and prior surgical management, were obtained from the NFL Combine online database, while the overall draft pick number was publicly available. The impact of injuries on collegiate play, including the total number of collegiate games missed and the number of missed games due to a fifth metatarsal fracture, was documented.
After careful consideration of the existing literature regarding the radiographic classification of Jones fractures, a CT-based grading system was proposed and developed to categorize the surgically treated fifth metatarsal base fractures. 11,21 This system was in part inspired by a previously described radiological method for grading healing in tibial shaft fractures, 13 which involved dividing the fracture zone into 4 quadrants: plantar, dorsal, lateral, and medial (Figure 2). Each quadrant was carefully visualized and assigned a score using a binary system of 0 versus 1. A score of 0 was assigned when the fracture was not completely healed. A score of 1 was assigned when complete anatomic healing within that quadrant was evident. The plantar and dorsal quadrants were graded on sagittal CT of the fracture site, with the lateral and medial quadrants graded on axial CT. The coronal-plane scans were used to confirm each quadrant score. For each player, the individual quadrant scores were then summed, resulting in a cumulative score ranging from 0 to 4. A mean cumulative score was then calculated using each reviewer’s cumulative score.
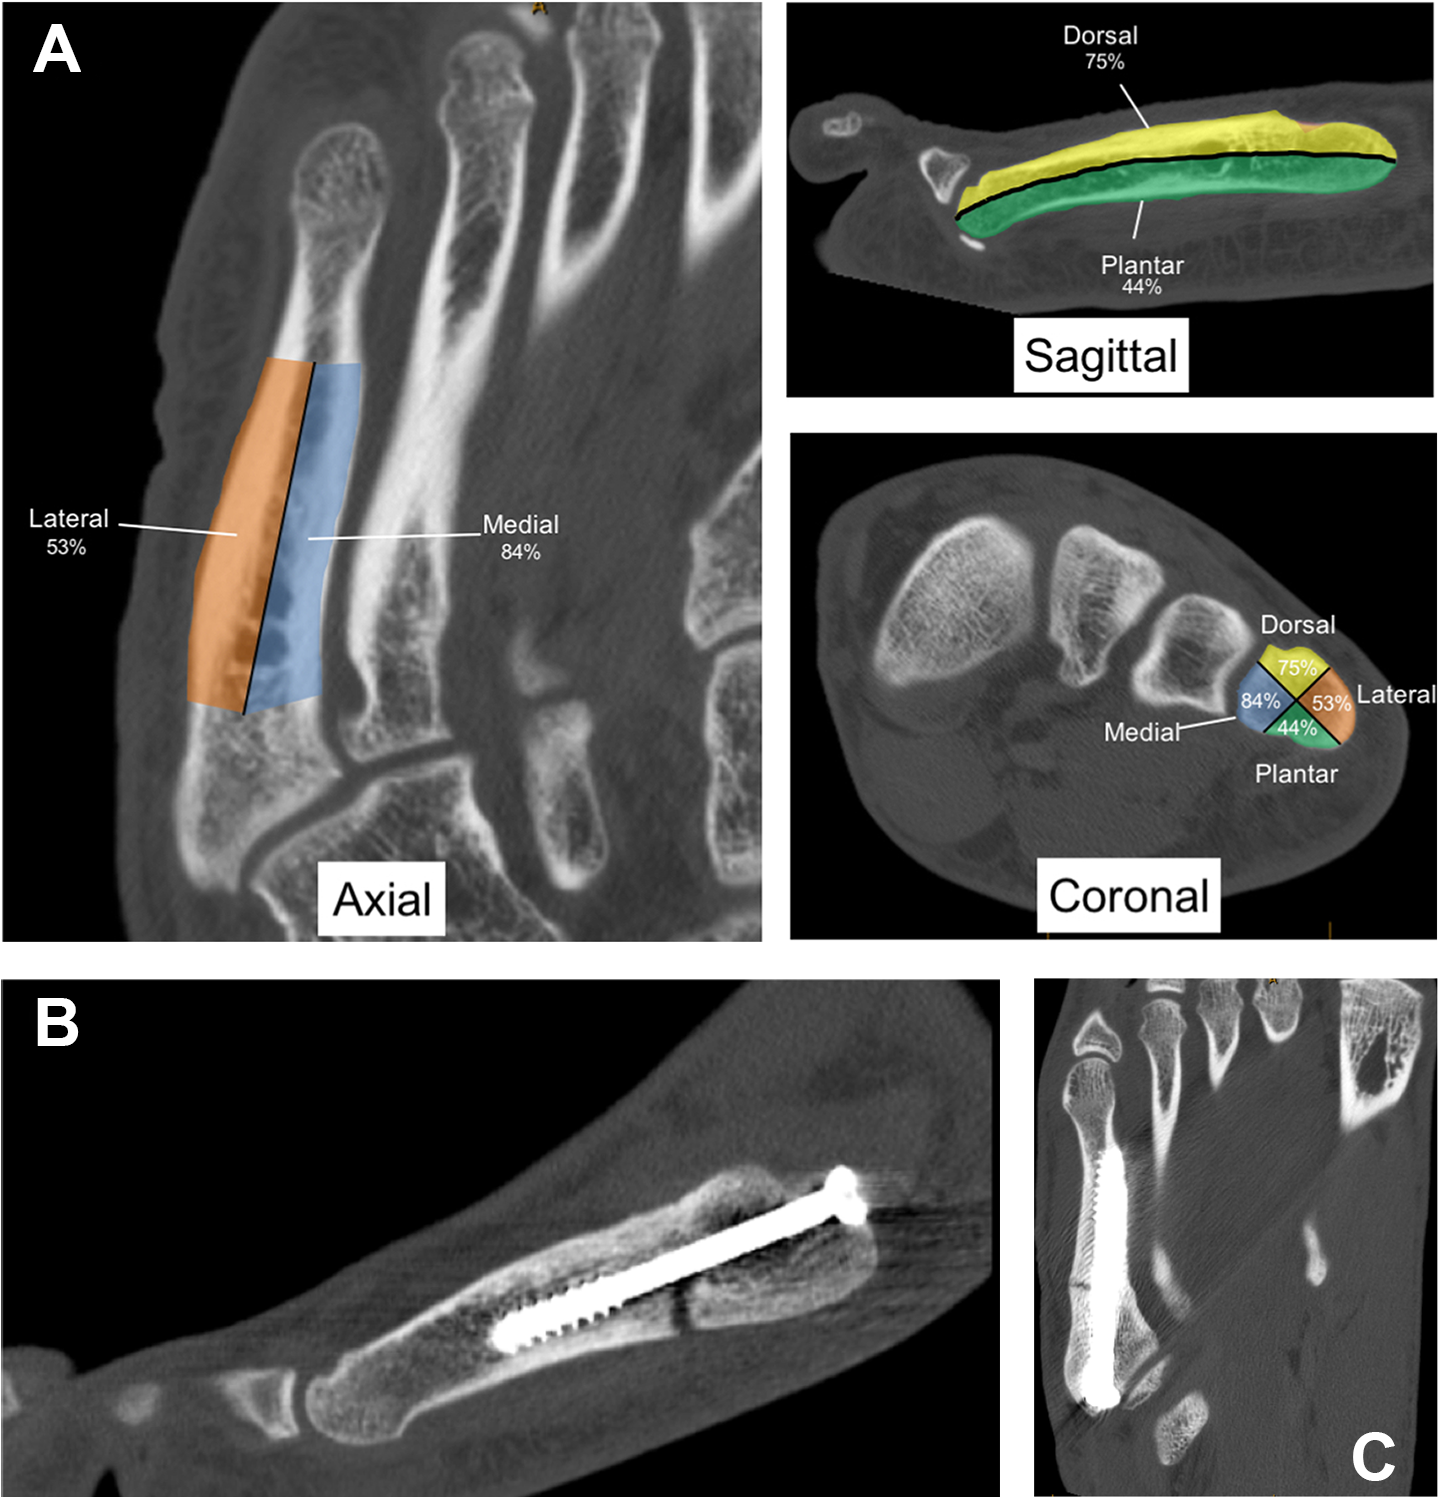
(A) Axial, sagittal, and coronal computed tomography (CT) images of a representative nonfractured fifth metatarsal illustrating the percentage of completely healed cortices in each quadrant. (B) Sagittal CT image of an unhealed plantar cortex of a Jones fracture after prior cannulated screw fixation. (C) Axial CT image of an unhealed lateral cortex of a Jones fracture after prior cannulated screw fixation.
Interobserver and Intraobserver Variations
Three orthopaedic surgeons (R.C.S., D.B.H., K.L.S.) independently viewed and graded the CT scans on 2 separate occasions. Each surgeon completed his or her first and second review at least 3 weeks apart. Each surgeon was blinded to the others’ interpretations of the scans. The scores from the 3 surgeons’ initial review were used to assess interobserver reliability. The second set of scores from the second review was the basis for estimated intraobserver reliability. Weighted Cohen kappa statistics were used to assess reliability; values ranged from +1 (perfect agreement) to –1 (absolute disagreement). In addition, the intraclass correlation coefficient (ICC) was computed for each quadrant to assess rating reliability by comparing the variability of different ratings of the same participant with the total variation across all ratings and all participants.
Performance Metrics
Performance metrics for the first 2 seasons of NFL play, including games played and games started, were obtained for all players who attended the NFL Combine from 2009 to 2013. Outcome data were also obtained for athletes who sustained a fifth metatarsal fracture and attended the NFL Combine in 2015; however, performance metrics were not available for the rest of the class of 2015. Snap percentage, defined as the total number of plays that a player participated in out of the total number of plays that the player was eligible to participate in over the course of a season, was collected for the first 2 NFL seasons through the use of ProFootballFocus.com 17 as a measure of a player’s volume of play. To assess the performance of those athletes who were ultimately drafted, position-specific performance scores were calculated according to “fantasy score” grading rubrics by position as suggested by ESPN.com and NFL.com through the use of in-game statistics available on STATS.com 20 and Pro-Football-Reference.com. 19
The fantasy score allows for the aggregation of performance in various position-relevant statistical categories, for example, passing yards and passing touchdowns for quarterbacks, into a single readily analyzable score. Our methodology for performance score calculation for both injured and control athletes to assess performance by position is depicted in Figure 3. Overall fantasy scores were compared with selected control players. The criteria for these controls were that the player (1) was drafted in the respective NFL draft, (2) had missed no more than 2 collegiate games during his college career, (3) had no surgical history, and (4) had no previous foot injury. Snap percentages were similarly compared.
Statistical Analysis
To assess for possible associations between quadrant and cumulative CT scores and future performance, a comprehensive statistical analysis was conducted. First, summary statistics were computed to determine the overall frequency of fifth metatarsal base fractures by year, the corresponding number of games missed due to this fracture, games played, and games started.
Fantasy scores were then calculated for all players with Jones fractures according to position and were compared with controls. Two-sample, 2-tailed t tests with the Welch approximation were conducted to determine whether the fantasy scores varied between players with fractures and controls.

For CT scan analysis, the cumulative healing scores, derived from the sum of all 4 quadrants, were reported. Players were then subdivided into 3 groups: those with cumulative scores <1, 1-3, and 4. These groups were characterized by the mean number of missed games, overall draft pick number, games played, and games started.
The impact of the CT score on NFL performance was then assessed compared with controls. The control group (n = 297) was selected based on fulfillment of the following criteria: (1) no history of injuries to the fifth metatarsal, (2) no significant missed time (≤2 total missed games in college), and (3) no history of any surgery. Players who participated in the 2015 NFL Combine were excluded from performance outcome analysis, as they could not have completed 2 seasons in the NFL at the time of analysis.
Analysis of variance was conducted to assess multivariable differences in draft position, number of games played and started, and games missed in the first 2 seasons in the NFL among the 3 different grading groups. Two-sample, 2-tailed t tests with the Welch approximation were performed to assess differences between players with fractures and controls.
Results
A total of 2285 athletes from the NFL Combine from 2009 to 2015 were included in the study. The overall number of fifth metatarsal base fractures in these athletes was 72 (3.2%), ranging from 6 (in 2014) to 17 (in 2013) per year (Table 1). Three of the fractures (4.1%) were bilateral Jones fractures. One athlete with bilateral fractures missed no time after either injury, the second athlete missed no time after the first but missed 3 games after the second, and the third athlete missed no time after the first injury and 1 game after the second. The mean number of total collegiate missed games was 4.7 ± 5.3, with only 0.2 ± 0.7 total missed games due to a fifth metatarsal base fracture. Most players (67/72; 93.0%) did not miss any games in college due to their Jones fracture. Two players missed 1 game, 3 players missed 3 games, and 1 player missed 4 games due to this injury. Of the 72 total players with a prior Jones fracture, 46 played more than 2 years in the NFL, with a mean of 21.7 ± 8.5 games played and 10.1 ± 10.6 games started.
Outcomes According to Draft Year a

a NFL, National Football League.
All 72 athletes with fractures were treated with intramedullary screw fixation. One athlete with bilateral injuries underwent surgical fixation of just 1 of the 2 fractures. All athletes had sustained true Jones fractures (zone II), with 1 athlete having sustained a diaphyseal (zone III) fracture. Compared with other positions, tight ends (9/133; 6.8%) were most likely to have had a Jones fracture (odds ratio, 2.4; P = .02), whereas defensive backs (7/405; 1.7%) and running backs (3/239; 1.3%) were at a lower risk, although these findings were not statistically significant. The mean overall draft pick number for players having undergone CT for Jones fractures (125.4; n = 32) was significantly higher compared with controls (99.0; n = 297) (P = .03). Overall, 25 of 72 (34.7%) athletes with Jones fractures were undrafted compared with 773 of 2285 (33.8%) of all athletes undrafted from 2009 to 2015.
The NFL performance of athletes having sustained a Jones fracture was compared with controls for each position group and is summarized by fantasy scores in Table 2. For every position group, players with Jones fractures had lower fantasy scores compared with controls. This was particularly significant for defensive linemen (P = .02) and running backs (P = .02).
Fantasy Scores by Position and Compared With Controls a

a Boldfaced values indicate statistical significance (P < .05). There was a total of 72 athletes with fifth metatarsal bone fractures, including 1 in special teams; cases include athletes with a Jones fracture. There was a total of 118 defensive controls and 180 offensive controls. Criteria for controls and guidelines for fantasy score calculations are defined elsewhere. Of note, fantasy scores are not calculated for offensive lineman and thus, a comparison between cases and controls was not completed for offensive lineman and for all offensive players.
Similarly, total snap percentages over the first 3 years in the NFL for athletes having sustained a Jones fracture were lower for all position groups compared with controls, with the exception of quarterbacks. This difference was significant for all positions except quarterbacks and linebackers.
For the 32 athletes from the players with Jones fractures who had undergone CT, the relative frequency for each CT quadrant score (not healed [score = 0] vs healed [score = 1]) is presented in Table 3. The overall interrater reliability kappa value was 0.60, and the mean intrarater reliability kappa value was 0.64. With respect to each quadrant, the mean ICC was 0.91 (plantar), 0.88 (dorsal), 0.61 (medial), and 0.93 (lateral). Marked differences were noted between the 4 quadrants (see Figure 2). The plantar quadrant was the least likely to be healed at the time of the combine, as was the case for 18 of the 32 players (56.3%). The lateral cortex similarly revealed lower overall scores, with 46.9% not healed. Conversely, the dorsal cortex was not healed in only 25.0% of players, and the medial cortex was not healed in 15.6% of players.
CT Classification of Jones Fractures a

a Values are shown as n (%). There were a total of 32 athletes who had undergone computed tomography (CT) after prior intramedullary screw fixation for a fifth metatarsal base fracture. A CT-based grading system was proposed to describe the surgically treated fifth metatarsal base fractures. Each quadrant was carefully visualized and assigned a grade using a binary system of 0 versus 1. A score of 0 was assigned when the fracture was not completely healed. A score of 1 was assigned when complete anatomic healing was seen. The plantar and dorsal quadrants were graded on sagittal CT of the fracture site, with the lateral and medial quadrants graded on axial CT. The coronal plane was used to confirm.
The cumulative CT score distribution is summarized in Table 4. The mean overall score was 2.5 ± 1.3. Sixteen Jones fractures (50.0%) were healed or nearly healed (mean score = 4), 12 (37.5%) showed some healing (score = 1-3), and 4 (12.5%) showed little or no healing (score <1).
Distribution of Mean Cumulative CT Scores a
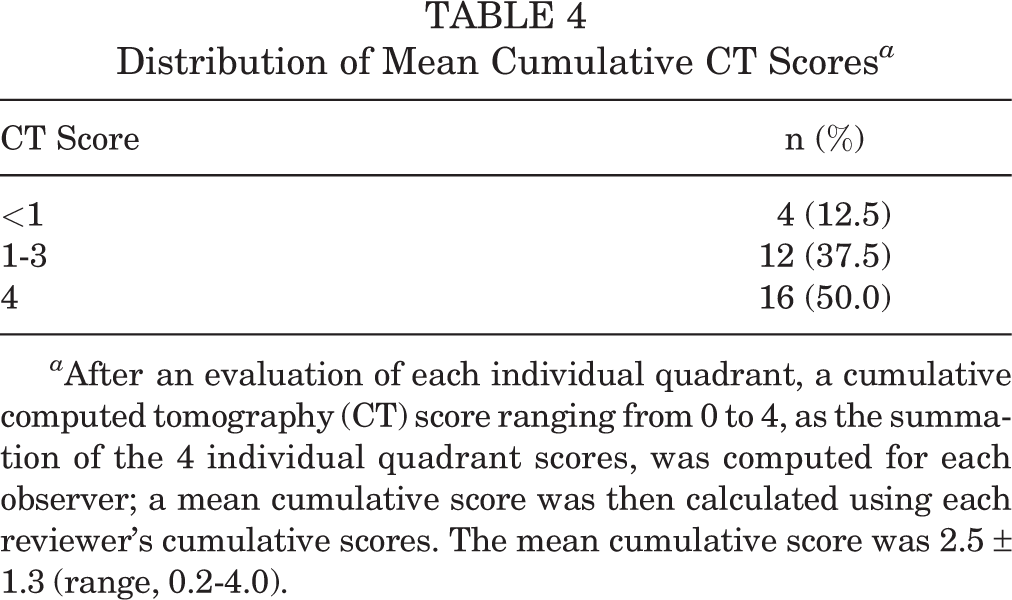
a After an evaluation of each individual quadrant, a cumulative computed tomography (CT) score ranging from 0 to 4, as the summation of the 4 individual quadrant scores, was computed for each observer; a mean cumulative score was then calculated using each reviewer’s cumulative scores. The mean cumulative score was 2.5 ± 1.3 (range, 0.2-4.0).
Outcome data were stratified by the cumulative CT score (Table 5). The group with a mean cumulative score <1 was found to have started fewer total games (2.7 ± 2.5) than players with 1, 2, or 3 cortices healed (17.4 ± 10.4 games started) or players with all cortices healed (8.7 ± 11.2 games started) (P = .10). The mean overall draft pick number for those with a score <1 was 153.3 compared with 110.8 for those with 1, 2, or 3 cortices healed, 129.2 for those with all cortices healed, and 99.0 for the control group (P = .69).
Outcomes According to Mean Cumulative CT Score a

a Boldfaced values indicate statistical significance (P < .05). Players with fractures were stratified based on the cumulative quadrant score into 3 groups: <1, 1-3, and 4. CT, computed tomography; NFL, National Football League.
b Analysis of variance was performed to assess differences among the 3 groups.
c Two-sample, 2-tailed t test with the Welch approximation was performed to assess differences between players with fractures and controls.
To further investigate the relative importance of the different fracture quadrants, each cortex was then analyzed separately (Table 6). Results showed a trend in which an anatomically healed fracture was associated with an increased likelihood of the athlete having played 2 or more years in the NFL (P = .27, .26, .09, and .24 for medial, dorsal, lateral, and plantar, respectively).
Outcomes According to Individual Fracture Quadrant a
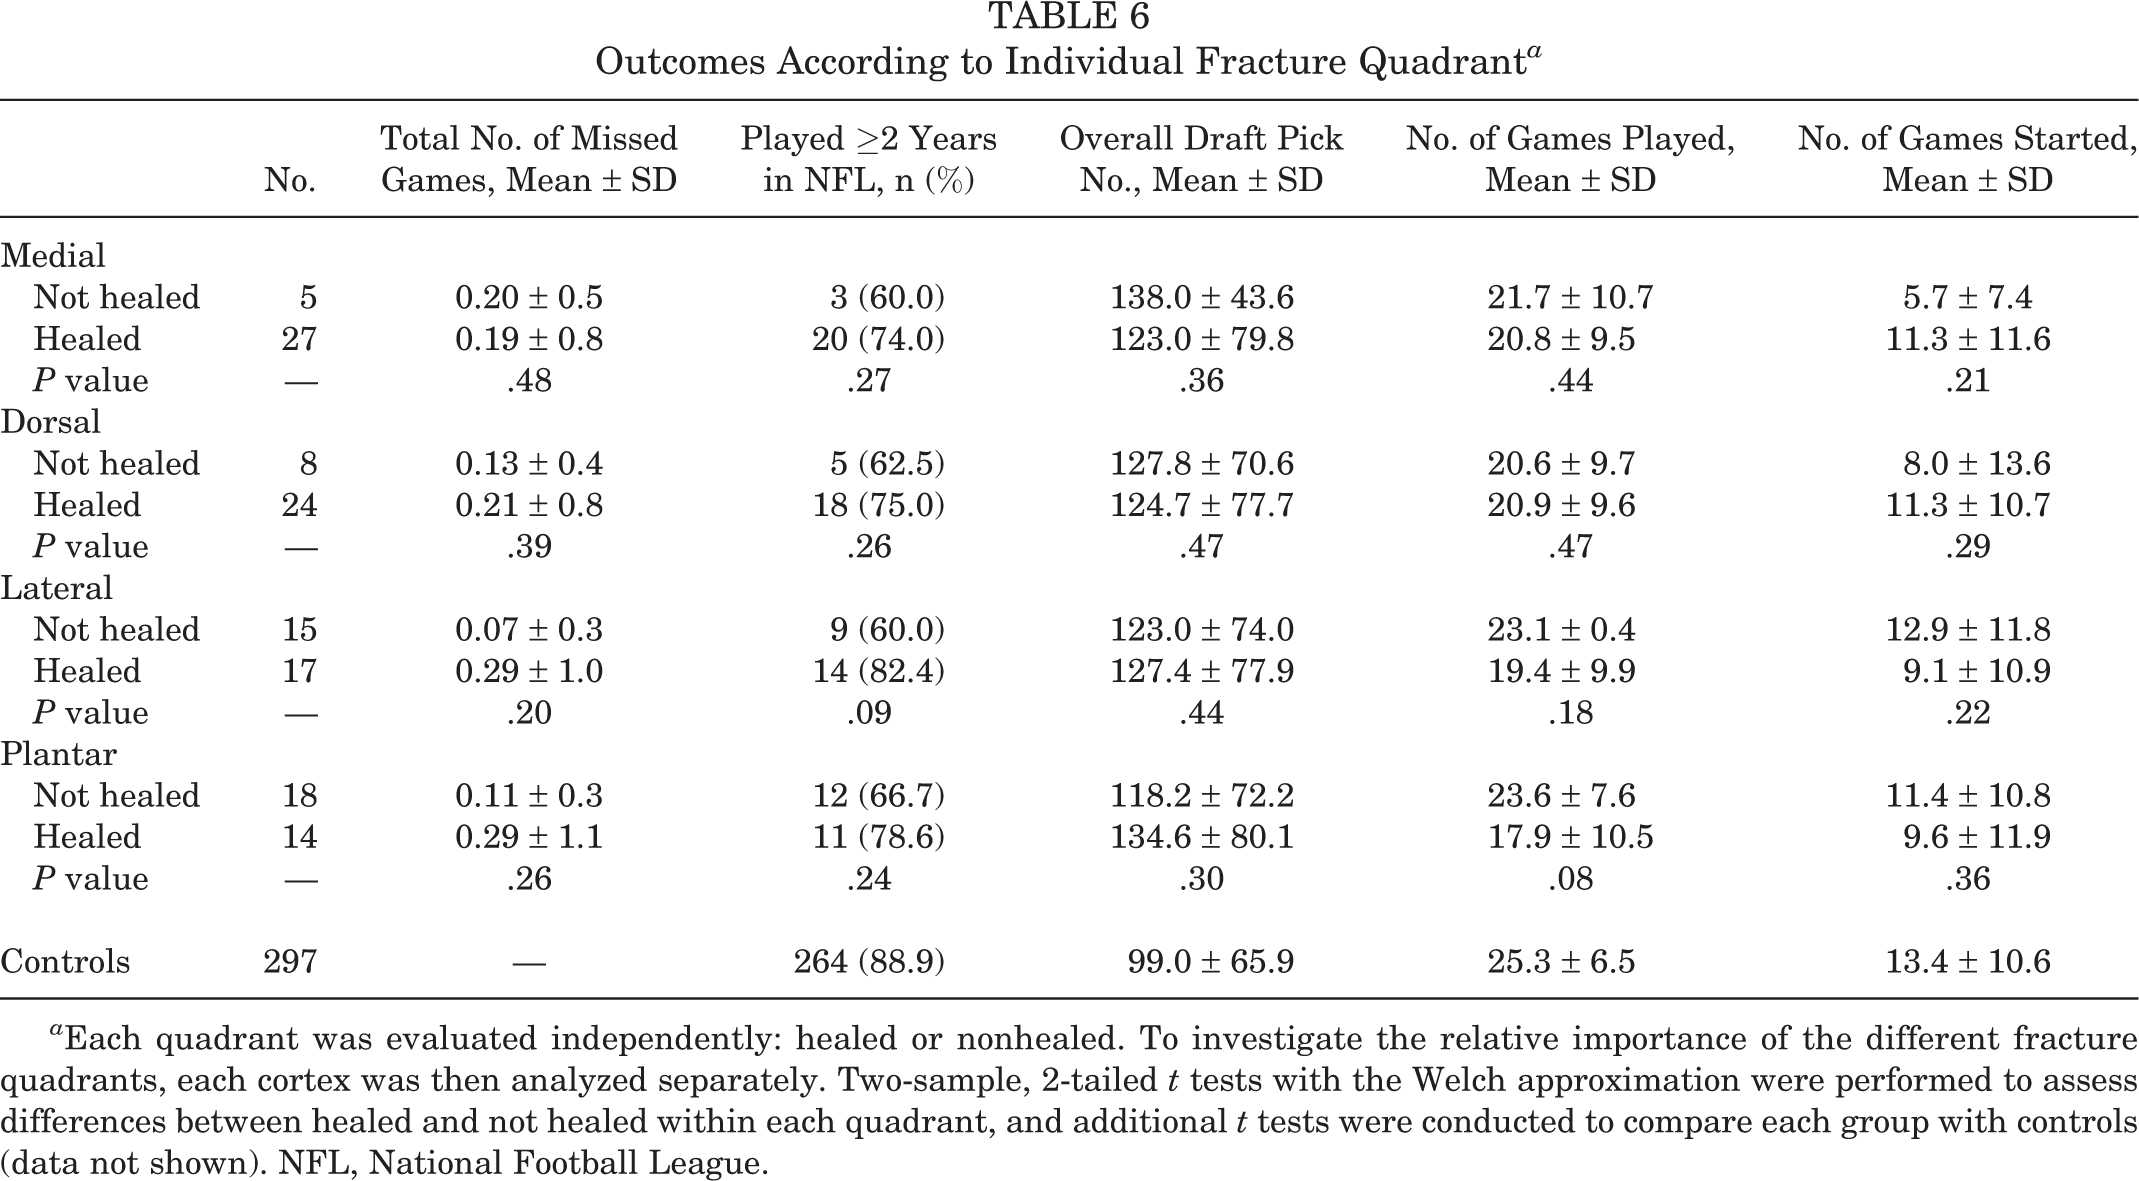
a Each quadrant was evaluated independently: healed or nonhealed. To investigate the relative importance of the different fracture quadrants, each cortex was then analyzed separately. Two-sample, 2-tailed t tests with the Welch approximation were performed to assess differences between healed and not healed within each quadrant, and additional t tests were conducted to compare each group with controls (data not shown). NFL, National Football League.
Discussion
The principal findings of this study demonstrated that players with a previous Jones fracture performed worse within the first 2 years in the NFL than controls, with a significant difference demonstrated for defensive linemen and running backs. On CT scans, the plantar (18/32; 56.3%) and lateral (15/32; 46.9%) cortices were frequently not healed. A lower CT score, as determined by the described method, was associated with fewer games started (2.7 vs 17.4 for score <1 vs 1-3, respectively) and with a later overall draft pick number (153.3 vs 110.8 for score <1 vs 1-3, respectively).
Refractures and nonunion after a Jones fracture remain major concerns for NFL players. 9 Wright et al 23 reported on 3 football players who suffered fifth metatarsal refractures on the first day back to full activity, despite the appearance of complete healing radiographically and clinically. In the largest reported series of 25 professional athletes with Jones fractures treated by a single surgeon, Lareau et al 9 noted a refracture rate of 12% requiring revision surgery. Carreira and Sandilands 1 retrospectively reviewed a cohort of 74 fifth metatarsal fractures from a database collected by a single NFL team during the 2004 to 2009 NFL Combines and found there were 9 (12.2%) cases of nonunion. The average number of NFL games played did not differ between the fifth metatarsal fracture group and a control group. 1
Given this concern regarding refractures and nonunion, there is much interest in being able to predict which patients might be at risk for these complications. Torg et al 21 classified fifth metatarsal base fractures according to their radiographic appearance, which may guide treatment. Type I fractures represent an acute fracture with a chronic process and demonstrate an absence of medullary sclerosis. Type II is similar but has medullary sclerosis and delayed union. Type III fractures constitute nonunion with obliteration of the medullary canal. However, Lee et al 12 noted diverse results even in patients with the same Torg type and recently reported the plantar flexion gap as another prognostic factor. Based on the premise that the main pathological abnormality is at the plantar lateral side of the fifth metatarsal caused by repetitive stress concentrated there, they proposed a new classification accounting for complete (group A) versus incomplete (group B) fractures, with or without a 1-mm plantar gap. Interestingly, incomplete fractures took much longer to heal (103.2 vs 67.6 days, respectively) than complete fractures, which may be attributed to improved operative reduction and compression. The authors noted significantly more cases of nonunion (8/54 vs 1/32, respectively) in the incomplete fracture group than the complete fracture group, and all of these were in patients with a plantar gap of more than 1 mm. 12 These patients were treated via tension band fixation. It is unknown whether similar prognostic results would be seen for athletes having undergone intramedullary screw fixation.
Here, we used a novel fantasy score system to describe NFL performance and discovered that a history of Jones fracture was associated with lower NFL fantasy scores. This was particularly true for defensive linemen and running backs. While players with a prior Jones fracture missed relatively few (0.2 on average) games because of a Jones fracture in college, they may perform worse than controls while in the NFL. This is further supported by snap percentage data, as all positions performed worse according to the snap percentage compared with controls, with the exception of quarterbacks.
CT is sometimes performed postoperatively to assess for fracture healing, and it is particularly common at the NFL Combine. A systematic approach to interpreting such imaging has yet to be described. The present study proposes a grading system for operatively treated fifth metatarsal base fractures using CT. This approach stemmed from the existing literature regarding the radiographic classification of Jones fracture and the relative importance of the plantar gap previously described by Lee et al. 12 The presented grading system demonstrated overall good intraobserver and interobserver reliability. More importantly, the cumulative score was associated with performance outcomes. The presented grading system can be applied to patients relatively quickly using standard CT.
The systematic interpretation of postoperative CT scans appears to be prognostically useful. The 4 players with a mean cumulative score <1 started just 2.7 games in the NFL, on average, compared with 13.4 games, on average, for the controls (P = .11). These players were also drafted approximately 54 draft positions, or almost 1.5 rounds, later than controls. When individual cortices were considered, a trend was noted in which a nonhealed cortex was associated with not playing 2 or more years in the NFL, and this was found for all 4 cortices. Thus, taken in aggregate, it appears that lower CT scores are associated with fewer NFL games started and overall poorer NFL performance. This prognostic information may help guide decision making regarding return to play, career planning, or the need for additional interventions.
As was anticipated, the plantar and lateral cortices were those that were most frequently not healed. Interestingly, our hypothesis that a nonhealed plantar cortex might be particularly detrimental to future performance was not supported by our data. In fact, players with an anatomically healed plantar cortex actually played fewer games (17.9 ± 10.5) compared with those with a nonhealed plantar cortex (23.6 ± 7.6).
Several limitations to this study should be noted. While the intraobserver and interobserver reliability were shown to be good and the imaging scans were independently reviewed, there were a limited number of observers used for a relatively small (n = 32) sample size in developing this CT grading system. This reliability would need to be verified further with a larger sample size in the future. Reliability analyzed only the precision of the grading scheme but not the accuracy, as no gold standard currently exists for comparison. Because of the small number of players, it is not possible to determine if the reason for the missed games during the first 2 years of NFL participation was in fact related to the prior Jones fracture. Data regarding missed snaps in the NFL are not specific enough to relate missed games to a specific injury. Also, the immediate use of ultrasonic bone stimulation, a readily implemented modality that would be useful to analyze and that could also be a potential confounder, was not recorded uniformly throughout the NFL Combine medical records.
This study focused on a specific patient population consisting of elite potentially NFL-bound athletes. As such, healing characteristics may differ, and the generalization of results to other athletes or patient populations may not be valid. Our grading scheme, although based in part on previous work, 11,13,21 has not been validated directly with a proven one, and it is unclear whether such a grading scheme would be useful in interpreting other imaging modalities such as radiography or magnetic resonance imaging. Finally, data regarding the timing of CT, specifically the time from surgery to CT, were not available. This would potentially affect grading and should be considered when interpreting CT results. Ultimately, the analysis of this injury and performance data demonstrates association, which may be useful in determining the long-term consequences of Jones fractures in elite athlete populations, but does not rise to the standard of causation.
Conclusion
Jones fractures are relatively common in NFL Combine athletes and are commonly treated surgically via an intramedullary screw. These players have lower fantasy scores than controls. A novel grading system for systematic CT scan interpretation after the surgical treatment of fifth metatarsal base fractures was implemented, and scores associate with performance outcomes. The application of such a system may prove prognostically useful and assist in optimizing management while minimizing the complication risk.
Footnotes
One or more of the authors has declared the following potential conflict of interest or source of funding: T.O.C. receives royalties from Arthrex and Stryker, is a paid consultant for Arthrex and Stryker, is a paid speaker/presenter for Arthrex and Stryker, and receives research support from Arthrex. M.T.P. receives royalties from Arthrex and SLACK and is a paid consultant for Arthrex and the Joint Restoration Foundation (AlloSource).
Ethical approval for this study was obtained from Partners HealthCare.