
Abstract
Background:
There has been speculation that running backs with an excessive number of carries in college are less likely to be successful in the National Football League (NFL).
Purpose:
To determine whether there is a correlation between number of carries by college running backs and future performance and injury risk in the NFL.
Study Design:
Cohort study; Level of evidence, 3.
Methods:
Using the ESPN archives of National Collegiate Athletic Association and NFL running backs, the following inclusion criteria were used: running backs who played their last college season from 1999 through 2012 and who were drafted in the first 4 rounds of the NFL draft following their college career. Players were grouped by number of carries during their final college season (group A, 100-200 carries; group B, 250+ carries). Performance and injury risk were compared between groups during the first 3 eligible seasons in the NFL. Groups were compared based on total number of carries, mean yards per carry, number of games missed due to injury, and the specific injuries resulting in missed playing time.
Results:
During the seasons studied, a total of 103 running backs were included (group A, n = 42; group B, n = 61). There was a trend toward a significantly greater mean total number of carries through 3 NFL seasons in group B (group A, n = 276 carries; group B, n = 376 carries; P = .058). Mean yards per carry did not differ between groups (group A, n = 3.9 yards/carry; group B, n = 4.0 yards/carry; P = .67). Groups A and B missed a mean 5.8 and 5.7 games, respectively, due to injury during their first 3 NFL seasons (P = .98). A significantly greater proportion of players in group A suffered a concussion compared with group B (P = .014).
Conclusion:
There is no correlation between the number of carries by college running backs and future injury risk or performance during their early NFL career.
Recent studies have attempted to determine whether there is an association between the number of carries by running backs (RBs) in the National Football League (NFL) and risk of injury and worsened performance during the subsequent season. 9 Additionally, in recent years, the pitch count has become a popular method of assessing injury risk among baseball pitchers, with several studies 3,12,13 associating a higher pitch count with increased injury risk as well as worsened future performance. However, there have been no published studies examining the effect of the number of carries by college RBs on their future performance and injury risk in the NFL. A number of studies have shown that the RB position is among the most injury prone in the NFL. 1,4,6,8 In addition, there has been recent speculation that collegiate RBs with an excessive number of carries may not perform to their full potential in the NFL. The purpose of this study was to determine whether there is a correlation between the number of carries by RBs during their last season of college play and future performance and injury risk early in their NFL career. The authors hypothesized that RBs with a high number of carries in college would miss significantly more games due to injury during their first 3 years in the NFL compared with those with a moderate carry volume in college.
Methods
The methods of this study are similar to those of a previous study. 9 A retrospective cohort analysis was performed by searching the ESPN and National Collegiate Athletic Association (NCAA) archives for NFL (http://espn.go.com/nfl/statistics) and NCAA (http://www.ncaa.org/championships/statistics/ncaa-football-statistics) RBs. Data on collegiate RBs in their last season of NCAA play were searched from the 1999 through 2012 seasons. During each season, RBs were included based on the following inclusion criteria: those drafted in the first 4 rounds of the NFL draft with 100 to 200 carries (group A) and 250+ carries (group B) during their last season of college play. RBs with 201 to 249 carries were excluded to adequately separate group A (moderate carry volume) from group B (high carry volume). In addition, players who were undrafted or were drafted after the fourth round of the NFL draft were excluded in an effort to include only those players considered among the best RBs during their final season of collegiate play.
For each player, the following data were collected over the player’s first 3 NFL seasons: number of carries and mean yards per carry, the number of games missed due to injury, and the specific injuries resulting in missed playing time during these seasons. Specific injuries were found from injury reports released by the player’s team in the year the player was injured. In addition, height, weight, and body mass index (BMI) were captured from each player’s profile on the ESPN website from the year in which he was drafted.
Statistical Analysis
A Student t test was used to compare continuous variables (height, weight, BMI, number of carries, mean yards per carry, missed games) between groups A and B. Missed playing time during the players’ first 3 NFL seasons was also categorized as a dichotomous variable (0 games vs 1+ games) and was compared between groups using the chi-square test. The chi-square test was also used to compare the distribution of players from each group drafted in the first 4 rounds of the NFL draft and to compare rates of particular injuries between groups during the players’ first 3 NFL seasons.
Results
During the study period, a total of 103 RBs fit the inclusion criteria, including 42 in group A and 61 in group B. Seventeen RBs in group A (17/42, 40%) and 33 RBs in group B (33/61, 54%) entered the NFL draft after their third season of collegiate play rather than completing their college eligibility (P = .17). No significant difference was found between groups in terms of height, weight, or BMI at the start of each player’s NFL career (Table 1). In addition, no significant difference was found between groups in the overall distribution of players drafted from each of the first 4 rounds of the NFL draft (P = .13; Table 2). However, when comparing the proportion of players drafted in the first round versus rounds 2 through 4, a significantly greater proportion of players in group B were drafted in the first round (P = .038).
Player Demographics a

a Data are reported as a mean ± SD. BMI, body mass index.
Draft Round a

a Number (%) of players from each group drafted in each of the first 4 rounds of the National Football League draft. No significant difference was found in the overall distribution of players drafted over the first 4 rounds between groups (P = .13). However, a significantly higher proportion of players in group B were drafted in the first round (P = .038).
There was a trend toward a significantly greater number of carries by players in group B over the course of the first 3 NFL seasons, with players in group B having a mean 100 carries more than group A (Table 3). No significant difference was found between groups in terms of mean yards per carry (P = .67).
Performance Characteristics a
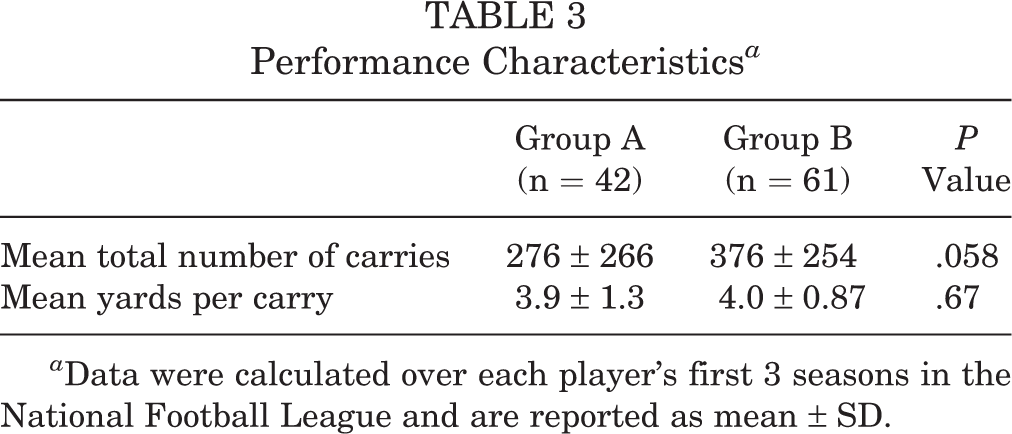
a Data were calculated over each player’s first 3 seasons in the National Football League and are reported as mean ± SD.
No significant difference was found between groups in terms of the mean number of games missed due to injury during the players’ first 3 NFL seasons (Table 4). Furthermore, the proportion of players missing at least 1 game due to injury also did not differ between groups. However, when analyzing the proportion of players who played at least 1 game in all 3 NFL seasons, a trend was found toward a significantly greater proportion in group B (Table 4).
Missed Playing Time a

a Data were calculated over each player’s first 3 seasons in the National Football League.
b Accounts for all running backs (RBs) who played at least 1 snap in each of their first 3 National Football League seasons.
Overall, the most common injury suffered by RBs that resulted in missed playing time was a lower leg/foot/ankle fracture, followed by an anterior cruciate ligament tear (Table 5). Group B had a significantly higher rate of lower leg/foot/ankle fracture (P = .012). Group A had a significantly higher rate of concussions than group B (P = .014).
Most Common Injuries Resulting in Missed Playing Time a

a Data are presented as n (%), where % represents the percentage of all players within that group who missed playing time during their first 3 seasons in the National Football League as a result of that injury. ACL, anterior cruciate ligament.
Discussion
The results of this study suggest that RBs who have a high number of carries in their final college season are not necessarily at higher risk of injury or worsened performance early in their NFL career when compared with RBs with a moderate carry total in college.
When comparing performance characteristics and injury outcomes between the 2 groups in this study, most outcomes were found to be similar between players in groups A and B. However, players in group B were found to have a mean 100 more rush attempts in their first 3 NFL seasons compared with players in group A. Furthermore, a significantly greater rate of concussions was found in players in group A. These results may not be coincidental, as Teramoto et al 11 recently analyzed concussions in NFL players during the 2012 to 2014 regular seasons and found that players most involved in pass plays reported more concussions. Therefore, it is possible that a greater proportion of group A players in the present study were drafted by and played on NFL teams with more pass-friendly offenses, thereby resulting in fewer carries and a higher concussion rate compared with players in group B. Another possibility is that RBs with fewer rush attempts in college had greater blocking responsibilities (on either running or passing plays), and these blocking responsibilities continued during their NFL career. Previous studies 2,5,7 have demonstrated that offensive linemen (the primary blockers on offense) sustain the highest rate of head impacts and undiagnosed concussions on a football team, and thus, an RB with more blocking responsibilities would be expected to have an increased rate of head impacts.
Recently, the authors attempted to determine whether there is a correlation between the number of carries by NFL RBs during 1 season and injury risk and worsened performance during the subsequent season. 9 In this study, it was found that NFL RBs with a high number of carries in 1 season continue to have a significantly greater number of carries and miss significantly fewer games due to injury during the subsequent season when compared with RBs with a moderate carry total. Thus, the results of the present study agree in some ways with those of our previous study. 9 In particular, as mentioned, players with a high number of carries in their final college season (group B) were found to have a mean 100 more carries during their first 3 seasons in the NFL compared with players in group A, with no significant differences between groups for mean number of games missed due to injury during this time. Furthermore, 75% of players in group B played in all their first 3 eligible seasons in the NFL compared with only 60% of players in group A (P = .087). These results lend further credence to the concept that certain RBs in the NFL are more durable and less injury-prone than other RBs at the professional level. Interestingly, the differences between the 2 groups analyzed in this study cannot be attributed to body dimensions, as no significant differences were found between groups with regard to height, weight, or BMI.
Despite an apparently higher level of durability in group B, these players did suffer a significantly greater rate of lower leg/foot/ankle fractures (23.0%) than players in group A (4.7%, P = .012). Kaplan et al 8 analyzed foot and ankle injuries among 320 intercollegiate football players participating in the 2006 NFL Combine. RBs suffered the third-highest proportion of foot and ankle injuries, following only kickers/punters and special teams players. Among all RBs included in the study by Kaplan et al, 8 83% had a history of foot and/or ankle injuries and 24% had undergone surgical treatment for these injuries. Kaplan et al 8 did not seek to correlate number of rush attempts in college with a greater rate of foot/ankle injuries, though the results of the present study suggest that such an association may exist. However, the greater rate of lower leg and foot/ankle fractures in players in group B did not significantly affect the number of NFL games missed due to injury compared with players in group A. These findings are corroborated by the results of Mai et al, 10 who analyzed the NFL Orthopaedic Surgery Outcomes Database (NO-SOD) and found that placement of a tibial intramedullary nail resulted in a 90.9% rate of return to play and a significantly longer remaining career length (mean, 2.8 years) compared with all other procedures analyzed. In addition, players in this study who underwent open reduction internal fixation of ankle fractures returned to play at a rate of 78.6%, with a mean remaining career duration of 2.1 years.
When comparing the distribution of players drafted in each of the first 4 rounds of the NFL draft, no significant difference was found between groups A and B (P = .13). However, a significantly greater proportion of players in group B were drafted in the first round (P = .038). This signifies that these players were generally considered to be more effective RBs compared with players in group A, and this likely continued early in their NFL career, as evidenced by the greater number of carries by players in group B during this time.
The strengths of this study are defined by a large sample size of RBs drafted into the NFL over 14 seasons. The limitations of this study should also be noted. First, this was a retrospective study design. The results of this study are dependent on the accuracy of the data found in the NCAA and NFL game summaries that were analyzed. In addition, specific injury information was not available in all cases, and the injury information obtained for this study does not reflect when these injuries occurred (eg, during carries, passing plays, special teams, practice, etc). Furthermore, the type of running plays called (dive, cutback, sweep) are not equivalent with regard to potential injury risk. Furthermore, this study does not take into account injuries that occurred prior to a player’s last collegiate football season, which may have had an impact on the number of rush attempts later in his college or professional career. Yards per carry may not be the best statistic to assess RB performance, and the recently used defense-adjusted yards above replacement may be more suitable in future studies. However, this statistic was not available for all players included in this study (http://www.footballoutsiders.com/stats/rb). In addition, short receptions (such as on screen passes) that result in running plays were unaccounted for in this study. Finally, and perhaps most important, the number of carries and yards per carry by an NFL RB is subject to multiple sport-specific confounding factors that limit the conclusions that can be drawn from this study. These include play call distribution between pass and run, offensive philosophy, offensive line performance, quality of the opponent, and weather changes.
Conclusion
Based on the results of this study, it should not be assumed that RBs with a high number of carries in their final college season are placed at a greater risk of general injury or worsened performance in their first 3 NFL seasons. However, college RBs with a high number of carries are likely to continue to have more rush attempts early in their NFL career, and these players may be at greater risk of lower leg/foot/ankle fractures while in the NFL. On the contrary, college RBs with fewer carries may suffer a higher rate of concussions while in the NFL, which may be related to the style of offense played by the teams for which these RBs play.
Footnotes
One or more of the authors has declared the following potential conflict of interest or source of funding: E.C.M. receives royalties from Biomet and Elsevier; is a paid consultant for Biomet; and receives research support from Biomet, Mitek, Smith & Nephew, and Stryker.
Ethical approval was not sought for the present study.