
Abstract
Background:
There is a strong correlation between glenoid defect size and recurrent anterior shoulder instability. A better understanding of glenoid defects could lead to improved treatments and outcomes.
Purpose:
To (1) determine the rate of reporting numeric measurements for glenoid defect size, (2) determine the consistency of glenoid defect size and location reported within the literature, (3) define the typical size and location of glenoid defects, and (4) determine whether a correlation exists between defect size and treatment outcome.
Study Design:
Systematic review; Level of evidence, 4.
Methods:
PubMed, Ovid, and Cochrane databases were searched for clinical studies measuring glenoid defect size or location. We excluded studies with defect size requirements or pathology other than anterior instability and studies that included patients with known prior surgery. Our search produced 83 studies; 38 studies provided numeric measurements for glenoid defect size and 2 for defect location.
Results:
From 1981 to 2000, a total of 5.6% (1 of 18) of the studies reported numeric measurements for glenoid defect size; from 2001 to 2014, the rate of reporting glenoid defects increased to 58.7% (37 of 63). Fourteen studies (n = 1363 shoulders) reported defect size ranges for percentage loss of glenoid width, and 9 studies (n = 570 shoulders) reported defect size ranges for percentage loss of glenoid surface area. According to 2 studies, the mean glenoid defect orientation was pointing toward the 3:01 and 3:20 positions on the glenoid clock face.
Conclusion:
Since 2001, the rate of reporting numeric measurements for glenoid defect size was only 58.7%. Among studies reporting the percentage loss of glenoid width, 23.6% of shoulders had a defect between 10% and 25%, and among studies reporting the percentage loss of glenoid surface area, 44.7% of shoulders had a defect between 5% and 20%. There is significant variability in the way glenoid bone loss is measured, calculated, and reported.
Keywords
The glenohumeral joint is the most commonly injured joint in the body, with an estimated incidence of dislocation of 1.7%. 12,38,55,61,82,105 More than 98% of all shoulder dislocations are anterior dislocations. 20,81,101,103 In the setting of recurrent anterior instability, the reported incidence of glenoid defects has been as high as 87%. 24 In 2000, Burkhart and De Beer 13 reported a recurrence rate of 67% after arthroscopic Bankart repair in patients with critical bone defects compared with a 4% recurrence rate in patients without critical bone defects. More recently, other studies have confirmed this correlation between failed arthroscopic Bankart repair and critical bone defects. 10,47 In a biomechanical study, Itoi et al 41 revealed that the critical size of an anteroinferior glenoid defect at which stability decreases is 25% of the glenoid width.
The current standard imaging modality for quantifying glenoid bone loss is computed tomography (CT). Multiple methods using the en face view of the glenoid have been developed to quantify inferior glenoid deficiency and are based on either linear or surface area measurements that become expressed as a percentage of the normal inferior glenoid bone. The glenoid index method is considered a linear measurement technique and is the ratio of the maximum inferior diameter of the injured glenoid to the maximum inferior diameter of the uninjured (ie, contralateral) glenoid. 19 The ratio method is another linear measurement technique that assumes that the shape of the inferior glenoid resembles a perfect circle; measurements are then entered into a geometric equation to quantify the percentage of glenoid bone loss. 4 Loss of glenoid width can also be easily calculated by measuring the diameter of the estimated intact lower glenoid circle and then subtracting the width of the injured glenoid from the diameter of the intact lower glenoid circle (expressed in either millimeters or as a percentage). The Gerber X-ratio is a linear technique that is calculated by dividing the maximum anteroinferior glenoid defect length by the diameter of the lower glenoid circle. 30 Lastly, glenoid defect size can be recorded as a percentage of the entire circumference of the glenoid fossa with 10% interval approximation. Using this method, the glenoid is divided into 4 quadrants; each quadrant comprises approximately 25% of the glenoid circumference. 47
The Pico method is the most commonly used surface area technique to calculate the percentage of bone loss. 5 First, the “normal glenoid circle” is defined using 3 reference points along the intact glenoid rim (3 o’clock to 9 o’clock) of the uninjured glenoid. Next, the normal circle is placed on the pathological glenoid using the remaining intact glenoid rim as a reference; the area of the inferior glenoid circle (A) and missing part of that circle (D) can then be measured and the size of the defect expressed as a percentage of the entire circle ([surface D/surface A] × 100). Other studies estimate the percentage loss of glenoid surface area using a “Pico-like” method, where only the injured glenoid is evaluated and the preinjury area is estimated by assuming the shape of the intact inferior glenoid resembles a perfect circle.
Regardless of the method used to measure glenoid bone loss, multiple studies have established the important relationship between glenoid defect size (ie, “critical bone loss”) and recurrence rates after soft tissue stabilization. This highlights the need to quantify and report glenoid bone loss more accurately and avoid using vague qualitative terms such as “large bone defect” or “inverted-pear defect.” The purpose of this study was therefore to evaluate the existing literature to (1) determine whether the rate of reporting numeric measurements for glenoid defect size in patients with anterior shoulder instability has improved since the year 2000, (2) determine the consistency of glenoid defect size and location reported within the literature, (3) define the typical size and location of glenoid defects, and (4) determine whether there is a correlation between defect size and treatment outcome.
Methods
We performed a literature search on December 6, 2014, using the PubMed, Ovid, and Cochrane databases. The following terms were used: glenoid bone loss, glenoid defect, glenoid bone defect, bony Bankart, erosive glenoid bone loss, and attritional glenoid bone loss. Only full-text articles published in the English language were considered. After performing the literature search, we reviewed titles and abstracts in search of clinical studies measuring glenoid defect size or location in human shoulders with primary and recurrent traumatic anterior instability. Citations deemed relevant to this study were retrieved as full-text articles for consideration in the analysis. Studies with numeric values measuring glenoid defect size or location were separated from those without numeric values. The PRISMA (Preferred Reporting Items for Systematic reviews and Meta-Analyses) guidelines were followed to conduct this systematic review.
Inclusion Criteria
The inclusion criteria for this systematic review consisted of (1) clinical studies on human subjects with anterior instability, (2) studies that provided numeric measurements for defect size or location (raw data, mean values, or defect size ranges), and (3) technique articles, provided these studies included patient outcome data not published elsewhere and they met all other inclusion criteria.
Exclusion Criteria
Exclusion criteria for this systematic review included (1) animal studies; (2) cadaveric studies; (3) body part studied other than the shoulder; (4) studies that focused on other etiologies associated with a glenoid bone defect such as posterior instability, shoulder arthritis, and tumor; (5) reviews, treatment guidelines, disease summaries, instructional course lectures, and technique articles without patient outcome data; (6) studies with specific defect size requirements in their entry criteria (ie, studies that include or exclude shoulders with specific defect sizes); (7) studies with shoulder pathology other than anterior instability in the entry criteria (associated lesions were included, but not if such lesions were the primary focus of the study); (8) patients with known prior surgery (ie, revision cases; however, if a study included patients with and without prior shoulder surgery, only primary cases were included); (9) studies without explicit inclusion criteria; and (10) case reports.
If a study included a cohort of patients that met the study criteria while other patients did not, the study was included; however, we used only data on the patients that met our entry criteria. Patient data published in multiple studies were only included once.
Calculations
Rate of Reporting Numeric Measurements for Glenoid Defect Size
The rate of reporting numeric measurements for glenoid defect size was calculated by dividing the total number of studies quantifying defect size by the total number of studies meeting our inclusion/exclusion criteria. For this calculation, we included articles that did not meet the second inclusion criterion but met all other inclusion/exclusion criteria. To study the time trend in reporting defect size, we further stratified the results using the following time periods: 1981 to 2000, followed by 5-year increments beginning in 2001 (2001-2005, 2006-2010, and 2011-2014).
Methods Used to Measure Defect Size
The methods used to measure defect size included intraoperative visualization and preoperative imaging modalities to calculate: (1) percentage of glenoid surface area, (2) percentage of glenoid width, (3) millimeters of glenoid width, (4) circumference of the glenoid fossa, and (5) the Gerber X-ratio.
Four studies measured defect size using multiple methods. Two studies measured glenoid bone loss intraoperatively using the bare spot method to validate measurements made preoperatively with CT. We used the measurements obtained using the bare spot method from both these studies for the final statistical analysis. The third study measured glenoid bone loss preoperatively using CT to validate measurements made using radiographic techniques. For this study, we used the measurements obtained using CT in our statistical analysis. The fourth study measured glenoid bone loss (ie, surface area) using 2-dimensional (2D) CT, computed geometric 2D CT, and using a femoral gauge geometric 3-dimensional (3D) CT. For our study purposes, we used the calculated loss of area using a femoral gauge geometric 3D CT in our statistical analysis.
Mean Defect Size
For studies that included measurements of glenoid bone loss, we calculated and categorized the mean defect size as follows: (1) percentage loss of glenoid surface area, (2) percentage loss of glenoid width, (3) glenoid width loss in millimeters, and (4) the Gerber X-ratio. The mean glenoid defect size was evaluated in 2 ways: examining only those shoulders with a defect and examining all shoulders (shoulders with and without a defect). Some studies explicitly reported the mean defect size or defect size ranges while other studies provided sufficient data to calculate the mean defect size and/or defect size ranges. Therefore, some of the values presented in this systematic review have been obtained directly from the original studies while others were calculated to provide a uniform unit of measurement. After determining the mean defect size and/or defect size ranges for each individual study, we calculated overall means and percentages for all studies within each subgroup.
Our analysis also considered separating glenoid defects into acute bony Bankart lesions and attritional/erosive bone loss; however, only 1 study specified which defects were attributed to attritional/erosive bone loss. In addition, most cases of chronic bony Bankart lesions also have combined attritional/erosive bone loss, making this simple categorization impractical. Therefore, we elected not to perform this stratification.
Defect Size Ranges
To analyze the mean percentage of shoulders within each defect size range, we separated studies into 1 of 4 groups according to the method used to calculate glenoid defect size: (1) defect size as a percentage loss of glenoid surface area, (2) defect size as a percentage loss of glenoid width, (3) defect size (in mm) of lost glenoid width, and (4) defect size as a percentage loss of glenoid circumference. A separate analysis was performed for each group. Due to minimal uniformity between studies with regard to size ranges, we elected to preselect defect size ranges for each of these 4 groups. Also, since not all studies specified how many shoulders had defects larger or smaller than each of our preselected ranges, we did not include shoulders for which it was unclear which of our ranges they fit within.
For both percentage loss of glenoid surface area and percentage loss of glenoid width, ranges include shoulders with no bony defect and shoulders with a measured defect (0%-5%, 5%-10%, 10%-15%, 15%-20%, 20%-25%, and >25%). Conversions between percentage loss of glenoid width and percentage loss of glenoid surface area can be estimated if one assumes that the lower glenoid fossa resembles a perfect circle and that glenoid defects represent a straight line parallel to the long axis of the glenoid fossa (Table 1). For millimeters of lost glenoid width, ranges include shoulders with no bony defect, shoulders with a defect 0 to 3 mm, shoulders with a defect 3 to 6 mm, and shoulders with a defect >6 mm. For percentage loss of glenoid circumference, ranges include shoulders with no bony defect and shoulders with a measured defect (0%-10%, 10%-20%, 20%-30%, and >30%).
Conversions Between Percentage Loss of Glenoid Width and Percentage Loss of Glenoid Surface Area a

a Assuming the lower glenoid fossa is a perfect circle and the defect represents a straight line parallel to the long axis of the glenoid. The loss of glenoid surface area is represented by a segment of the circle and the loss of glenoid width by the width of this segment.
Defect Location
The mean glenoid defect location in shoulders with anterior instability was reported using data from 2 studies. Because of the small number of studies reporting this information, no further calculations were made.
Treatments and Outcomes
We calculated the percentage of studies that reported outcomes after treatment, when treatment was involved, and analyzed the relationship between defect size and treatment outcome.
Statistical Analysis
Statistical analysis was limited to calculating percentages and mean values. All calculations were made using Excel 2013 (Microsoft Corp).
Results
The PubMed literature search produced 413 citations, while the Ovid and the Cochrane Database searches provided 150 additional citations, for a total of 563 citations. Eighty-three studies met the inclusion criteria for this study. Of these studies, 38 (2794 shoulders) reported numeric measurements for glenoid defect size ¶ and 2 studies (n = 147 shoulders) reported numeric measurements for glenoid defect location. 43,84 Twenty-five studies (n = 1582 shoulders) reported either absolute values for mean defect size or provided sufficient information to calculate the mean defect size. # Twelve of these 25 studies plus an additional 13 studies (n = 2142 shoulders) reported numerical ranges of defect size.** Studies excluded from the analysis are summarized in Figure 1.

Flow diagram presenting the studies excluded from this systematic review.
Rate of Reporting Numeric Measurements for Defect Size
Excluding the 2 studies that reported numeric measurements for glenoid defect location, there were 81 clinical studies that met criteria for inclusion in this study †† ; 38 of these (46.9%) reported numeric measurements for defect size. ‡‡ From the earliest publication in 1981 until 2000, we found 18 clinical studies, §§ of which only 1 (5.6%) reported numeric measurements for defect size. 99 From 2001 to the time of our literature search in December 2014, we found 63 clinical studies, ∥∥ of which 37 (58.7%) reported numeric measurements for glenoid defect size. ¶¶ The stratification from 2001 to 2014 is as follows: Of the 7 clinical studies published between 2001 and 2005, 18,47,52,56,87,96,97 4 (57.1%) reported numeric measurements for glenoid defect size. 47,56,87,97 Of the 27 clinical studies published between 2006 and 2010, ## 15 (55.6%) reported numeric measurements for glenoid defect size. a Of the 29 clinical studies published between 2011 and 2014, b 18 (62.1%) reported numeric measurements for glenoid defect size. 40,62,66,69,75,91
Methods Used to Measure Defect Size
Among the 38 studies reporting numeric measurements for defect size, clinicians used multiple measurement techniques; at times, multiple measurement methods were used within the same study. Twenty-seven studies used preoperative imaging to measure defect size, c 14 studies measured defect size intraoperatively with direct visualization, d and 2 studies were not clear on how defect size was measured. 9,10
Of the 27 studies that measured defect size preoperatively, clinicians used several imaging modalities including radiographs, magnetic resonance imaging (MRI), 2D CT, 3D CT, and CT arthrogram. Fourteen studies measured defect size with 2D CT, e 11 studies measured defect size with 3D CT, f 5 studies measured defect size using MRI, 23,37,53,59,93 and 1 study measured defect size using CT arthrography. 91
Of the 27 studies with preoperative imaging, 13 used the Pico (or similar) method to calculate the percentage loss of glenoid surface area. g One study assumed a loss of ≥25% of the glenoid surface if more than one-sixth of the glenoid rim was missing. 10 Twelve studies calculated the percentage loss of glenoid width by subtracting the anterior-posterior diameter of the injured glenoid from the estimated preinjury diameter of the glenoid and then divided this number by the estimated preinjury diameter, 6 studies used the contralateral uninjured shoulder to estimate the preinjury diameter, and 6 studies used the estimated inferior glenoid circle to represent the preinjury diameter. h One study calculated the glenoid index, 19 1 study calculated the Gerber X-ratio, 91 and 1 study was not clear how defect size was calculated. 42
Fourteen studies measured defect size with direct visualization, 2 of these with open visualization 87,99 and 12 with arthroscopic visualization. i Of the 2 using open visualization, 1 study measured defect size in millimeters of lost glenoid width 99 and the other measured the percentage loss of glenoid width. 87 The specific intraoperative technique used to make such measurements was not clearly stated in these studies. Eleven of the 12 studies measuring defect size arthroscopically used the bare spot method to measure the percentage loss of glenoid width, j while 1 study measured the percentage loss of glenoid circumference. 47
Mean Defect Size
Of the 25 studies that reported the mean glenoid defect size, 12 measured defect size as a percentage loss of glenoid surface area, k 12 measured defect size as a percentage loss of glenoid width, l 5 measured defect size in millimeters of lost glenoid width, 32,42,48,56,66 and 1 study recorded defect size using the Gerber X-ratio. 91
The 12 studies that measured defect size as a percentage loss of glenoid surface area included 536 shoulders (441 with a bony defect and 95 without a bony defect). Of the 441 shoulders with a bony defect, the mean loss of glenoid surface area was 10.8% (range, 4.8%-14.9%). The 12 studies that measured defect size as a percentage loss of glenoid width included 955 shoulders (723 with a bony defect and 232 without a bony defect). Of the 723 shoulders with a bony defect, the mean loss of width was 14.7% (range, 7.9%-29.0%). The 5 studies that measured defect size in millimeters of lost glenoid width included 400 shoulders (304 with a bony defect and 96 without a bony defect). Of the 304 shoulders with a bony defect, the mean width lost was 3.4 mm (range, 3.0-6.3 mm). The single study that reported defect size using the Gerber X-ratio comprised 77 shoulders and had a mean ratio of 30%.
Defect Size Ranges
Of the 25 studies that reported numerical ranges of defect size, 9 measured defect size as a percentage loss of glenoid surface area, m 14 measured defect size as a percentage loss of glenoid width, n 3 measured defect size in millimeters of lost glenoid width, 56,66,99 and 1 measured defect size as percentage loss of glenoid circumference. 47
Percentage Loss of Glenoid Surface Area
The 9 studies that recorded defect size as a percentage loss of glenoid surface area included 570 shoulders. Of these shoulders, 21.2% did not have a bony defect, 20.8% had a defect between 0% and 5%, 12.8% had a defect between 5% and 10%, 15.9% had a defect between 10% and 15%, 16.0% had a defect between 15% and 20%, 7.8% had a defect between 20% and 25%, and 5.5% had a defect >25% (Figure 2).

Defect size ranges using percentage loss of glenoid surface area (n = 570 shoulders).
Percentage Loss of Glenoid Width
The 14 studies that recorded defect size as a percentage loss of glenoid width comprised 1363 shoulders. Of these shoulders, 40.5% did not have a bony defect, 21.7% had a defect between 0% and 5%, 5.7% had a defect between 5% and 10%, 8.9% had a defect between 10% and 15%, 5.9% had a defect between 15% and 20%, 8.8% had a defect between 20% and 25%, and 8.6% had a defect >25% (Figure 3).

Defect size ranges using percentage loss of glenoid width (n = 1363 shoulders).
Millimeters of Lost Glenoid Width
The 3 studies that recorded defect size as millimeters of lost glenoid width comprised 105 shoulders. Of these shoulders, 23.0% did not have a bony defect, 53.0% had a defect between 0 and 3 mm, 8.5% had a defect between 3 and 6 mm, and 15.5% had a defect >6 mm (Figure 4).

Defect size ranges using millimeter loss of glenoid width (n = 105 shoulders).
Percentage Loss of Glenoid Circumference
The single study that recorded defect size as a percentage loss of glenoid circumference comprised 167 shoulders. Of these shoulders, 20.4% did not have a bony defect, 49.1% had a defect between 0% and 10%, 18.6% had a defect between 10% and 20%, 8.4% had a defect between 20% and 30%, and 3.6% had a defect >30% (Figure 5).

Defect size ranges using percentage loss of glenoid circumference (n = 167 shoulders).
Defect Location
Two studies with a total of 147 shoulders addressed glenoid defect location. 43,84 One study retrospectively reviewed 3D CT images of 123 patients with recurrent anterior dislocation and a glenoid bone defect. Defects were located between 12:08 and 6:32 on the glenoid clock face (with 12:00 along the long axis of the glenoid). The frequency of a glenoid defect was ≥80% at every 10-minute interval between 2:30 and 4:20. The extent of the glenoid defect was 106.7°, with the mean orientation of the defect pointing toward 3:01 on the glenoid clock face (Figure 6). 84 The second study used 3D CT to compare the length differences of 44 glenoids from the normal cadaveric scapulae to 24 glenoids in patients with anterior shoulder instability. The largest difference in length was at the 3:20 position on the glenoid clock face. 43

Location and orientation of glenoid bone loss in anterior shoulder instability. (A) The scapula rests on the posterior thorax and tilts forward in the sagittal plane. (B) Using a clock face for orientation, the average orientation of a glenoid defect points toward 3:01. (Reprinted with permission from Cleveland Clinic Center for Medical Art & Photography © 2012-2017. All rights reserved.)
Treatment and Outcomes
Of the 38 studies that reported numeric measurements for glenoid defect size, 16 discussed treatment outcomes. o Thirteen of these (899 shoulders) reported outcomes with respect to defect size. p Eleven studies (849 shoulders) performed the same surgical procedure on all patients regardless of defect size; 6 of these studies (621 shoulders) 10,47,67,70,80,91 demonstrated a positive correlation between preoperative defect size and recurrent instability. It was not possible to determine whether there was a correlation in 5 studies: 2 studies did not have enough patients with recurrence, 44,63 and 3 studies did not have enough patients with large defects to draw any conclusions. 73,75,99
With respect to preoperative glenoid defect size and postoperative range of motion (ROM), 3 studies (148 shoulders) found a greater loss of external rotation in shoulders with larger glenoid defects, 73,80,87 1 study (167 shoulders) found no correlation between defect size and postoperative ROM, 70 6 studies discussed postoperative ROM but did not attempt to correlate this with preoperative defect size, 10,44,47,63,92,99 and 3 studies did not address postoperative ROM. 67,75,91
Other outcome measures were also used to evaluate treatment; however, there was significant heterogeneity in the outcomes used between studies making comparisons difficult. The outcome results for all 13 studies are summarized in Table 2.
Summary of Treatments and Outcomes for Shoulders With Anterior Instability a
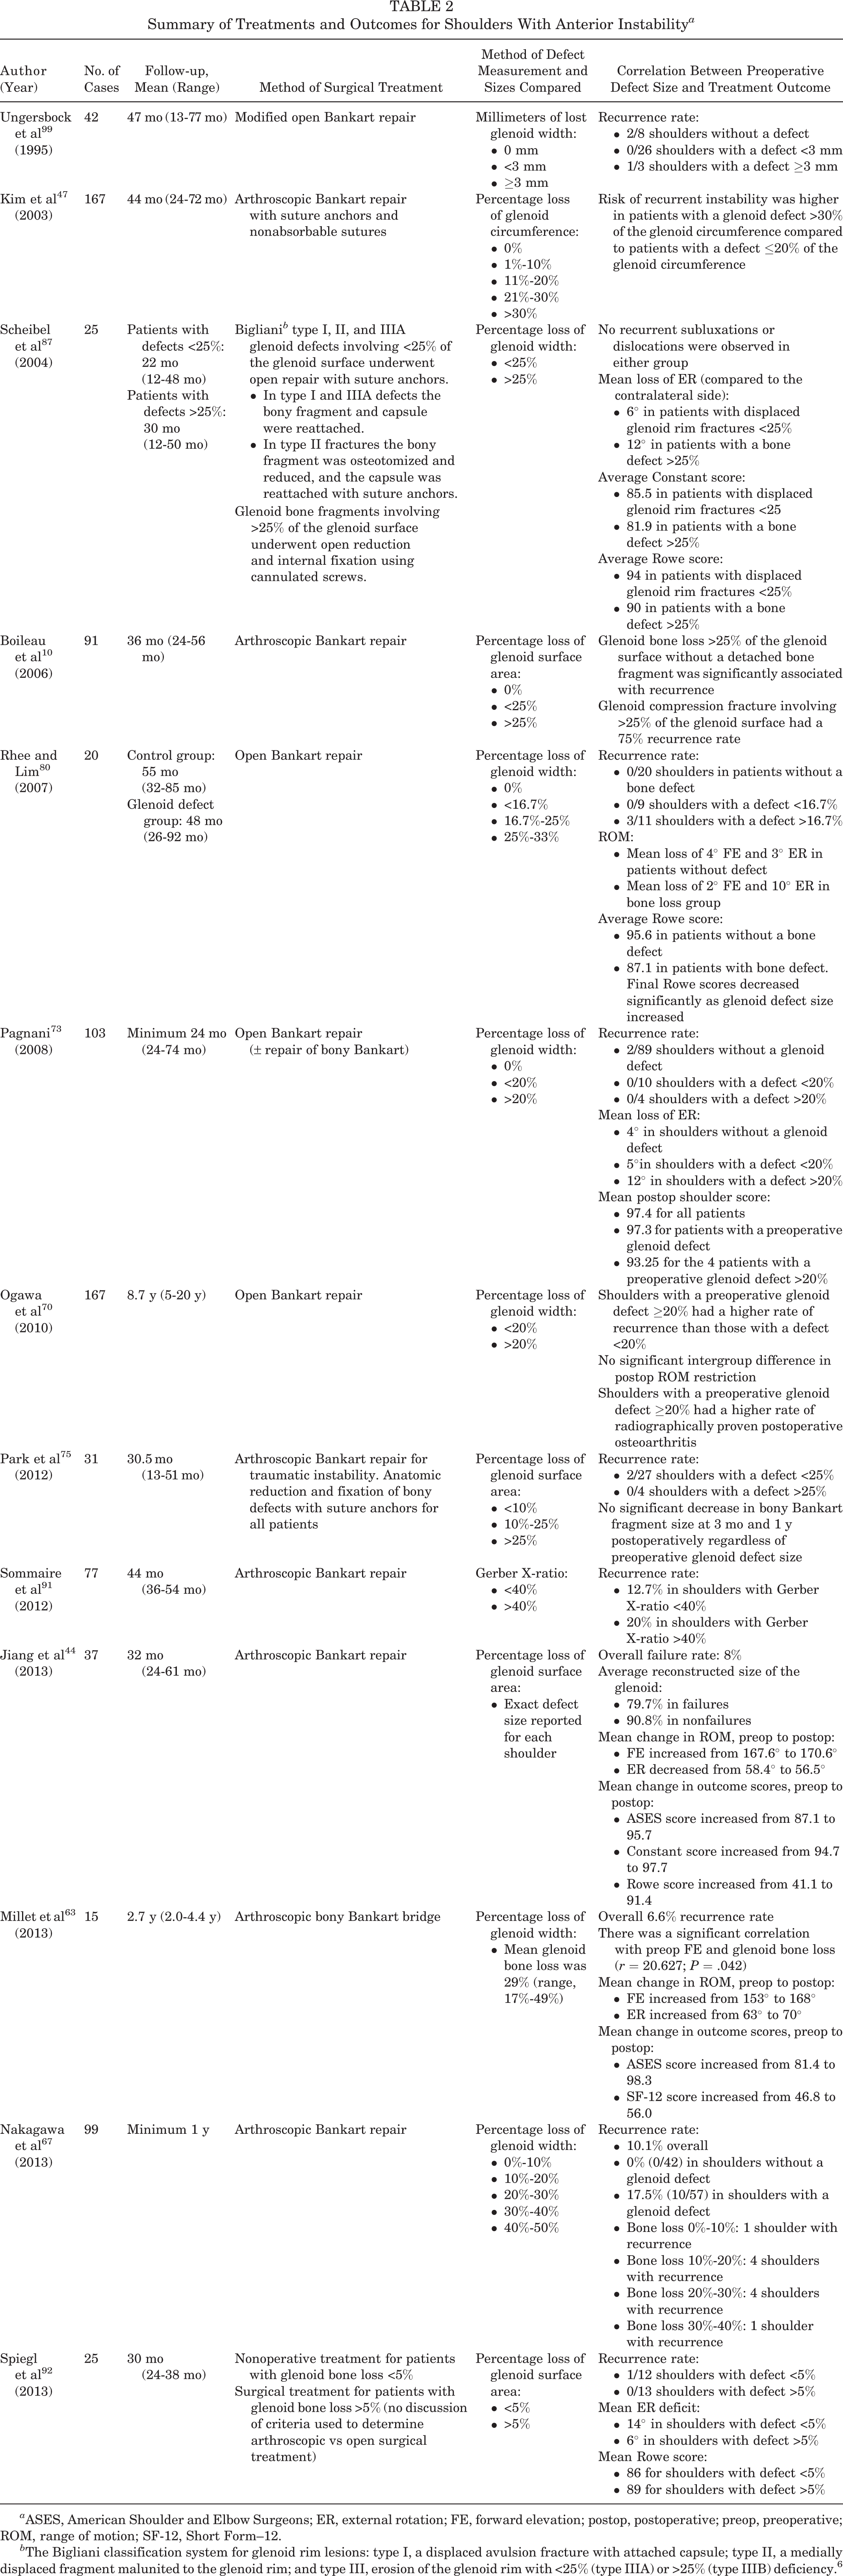
a ASES, American Shoulder and Elbow Surgeons; ER, external rotation; FE, forward elevation; postop, postoperative; preop, preoperative; ROM, range of motion; SF-12, Short Form–12.
b The Bigliani classification system for glenoid rim lesions: type I, a displaced avulsion fracture with attached capsule; type II, a medially displaced fragment malunited to the glenoid rim; and type III, erosion of the glenoid rim with <25% (type IIIA) or >25% (type IIIB) deficiency. 6
Discussion
Since 2001, the rate of reporting numeric measurements for glenoid defect size has improved; however, over the past 4 years, nearly 40% of clinical studies published failed to report numeric measurements for glenoid defect size. In addition, significant variability exists in the method of bone loss measurement and reporting. Some studies measure defect size preoperatively using imaging modalities such as radiography or CT (2D and 3D) whereas others report defect size intraoperatively. Even among those studies using the same imaging modality, there was variability in the method used to calculate bone loss (eg, percentage loss of glenoid width, percentage loss of glenoid area, millimeters of lost glenoid width, percentage loss of glenoid circumference, or Gerber X-ratio).
Multiple methods have been developed to quantify glenoid deficiency using 2D and 3D CT. Several recent anatomical studies have concluded that 3D CT provides the most reliable and accurate method to quantify glenoid bone loss. 7,11,78 In 1 study, the Pico surface area technique using 3D CT was found to be the most reproducible, precise, and accurate method for measuring glenoid bone loss. 11 Moving forward, we urge authors to report glenoid bone loss with the Pico method, using 3D-CT whenever possible. We also encourage authors to report percentage loss of glenoid width, as this will permit easier comparisons between preoperative and intraoperative defect size measurements.
Biomechanical studies evaluating glenoid bone loss have demonstrated a significant decrease in glenohumeral stability with defects greater than 25% of the glenoid width. 41,108 Multiple clinical studies have also suggested that the “critical” limit for glenoid bone loss in anterior shoulder instability is between 20% and 25% of the glenoid width. 6,10,56,64 Despite interest in defining this “critical” threshold, recent publications have reported recurrence rates after arthroscopic treatment for anterior instability ranging from 4% to 18%. 10,14,17,47,102 One potential explanation for this finding is that these original biomechanical studies investigated isolated glenoid defects, whereas it has been found that the majority of patients with recurrent anterior instability have combined humeral head and glenoid defects. 104 Recent biomechanical studies examining combined defects have revealed a significant decrease in glenohumeral stability with glenoid defects as small as 10% to 15% of the glenoid width. 3,31 Such studies are consistent with the concept of the glenoid track, which predicts that engagement between glenoid and humeral head defects is dependent on the size of the glenoid defect as well as the size and location of the humeral head defect. 22,48,109 Furthermore, it has been demonstrated that shoulders with engaging Hill-Sachs lesions on physical examination have a larger degree of glenoid bone loss as well as a trend toward a more medial margin of the Hill-Sachs lesion when compared with shoulders without an engaging Hill-Sachs lesion. 34 Due to the importance of combined defects, we encourage future investigators to include information on Hill-Sachs defects (size and location) in addition to glenoid bone loss.
The current review revealed that 8.6% of shoulders had a defect >25% of the glenoid width and 13.2% had a defect >20% of the glenoid surface area. In contrast, 23.6% had a defect between 10% and 25% of the glenoid width and 44.7% had a defect between 5% and 20% of the glenoid surface area (nearly equivalent to 10%-25% of the glenoid width). If surgeons are using 25% of the glenoid width as the cutoff for when to perform a bony reconstruction rather than 10% or 15%, the critical size in studies on combined defects, this could in part potentially help explain the high recurrence rate after arthroscopic Bankart repair demonstrated in many studies.
Of the 16 studies that discussed treatment of shoulder instability, 13 reported outcomes. Eleven of these performed the same surgical procedure on all patients regardless of defect size. Six of these found a correlation between preoperative defect size and recurrent instability, while it was not possible to draw meaningful conclusions in the other 5 studies. We initially intended to analyze the effect of defect size on treatment outcome; however, due to the limited number of studies that reported outcomes and the heterogeneity between these studies, such analysis was not possible. In the future, we would urge all authors who discuss treatment outcomes to record the rate of recurrence, ROM, and 1 or more patient-reported, joint-specific outcome instrument (eg, Simple Shoulder Test, American Shoulder and Elbow Surgeons Shoulder Evaluation Form, Constant score) and disease-specific instrument (eg, Western Ontario Shoulder Instability Index). Authors should also record defect size using both preoperative imaging and intraoperative methods whenever possible, as this will permit more accurate and thorough comparisons to be made between studies. We suggest recording absolute values for all defect sizes whenever possible. If ranges are used, we suggest using 5% increments, starting with 10% for percentage loss of glenoid width or 5% for percentage loss of glenoid surface area.
Two studies reported precise descriptions for glenoid defect location. 43,84 These studies included a total of 147 shoulders. Their results were within 10° of each other, with the mean defect orientation at 3:01 and 3:20 on the glenoid clock face, respectfully. This finding suggests that most glenoid defects after recurrent anterior instability do not typically resemble the shape of an inverted pear, as has been previously reported.
One limitation of this systematic review is that the majority of studies that met our inclusion criteria were surgical studies, and therefore, the patients included in these studies had significant symptoms to seek an orthopaedic surgeon. The actual prevalence of anterior bone loss (bony Bankart lesions and attritional/erosive bone loss) within the population is therefore likely less than reported in this study due to the unknown number that represents the denominator; however, we believe that the data presented in this study are an accurate representation of the mean glenoid defect size in patients who present to an orthopaedic surgeon. We initially intended to perform a more thorough analysis of defect size and prevalence as well as the relationship between defect size and treatment outcome; however, due to inconsistent measures of bone loss and insufficient patient demographic data between studies, such an analysis could not be performed. Another limitation of this review is that we included all studies (both orthopaedic and radiology studies) that met our inclusion/exclusion criteria without regard to study quality; 1 study represented level 2 evidence while all other studies represented level 3 or 4 evidence. However, we do not believe this is a significant limitation in our study as the accuracy of measuring and reporting defect size or location is unlikely to be affected by the level of evidence of the study.
Conclusion
Since 2001, only 58.7% of studies have reported numeric measurements for glenoid defect size, and from 2011 to 2014, this number increased slightly to 62.1%. Among studies that reported numeric values of bone loss, a consistent method of measurement was not used. Additionally, very few studies reported treatment outcomes, and there was a lack of consistency regarding the outcome instruments used between studies. To improve treatment outcomes in anterior shoulder instability, surgeons must collectively use a single uniform measurement of bone loss for comparison across studies. We suggest that in future studies, glenoid bone loss be reported using the Pico method. Percentage loss of glenoid width should also be reported to allow for easier comparison to intraoperative measurements. In addition, validated patient-reported instruments need to be adopted.
Historically, 20% to 25% loss of glenoid width has been considered the threshold for considering bony reconstruction; however, recent studies on combined defects have suggested that 10% to 15% loss of glenoid width may be a more appropriate critical threshold. Among studies reporting percentage loss of glenoid width, 23.6% of shoulders had a defect between 10% and 25%, and among studies reporting percentage loss of glenoid surface area, 44.7% of shoulders had a defect between 5% and 20%. These findings suggest that there may be a large number of shoulders that are currently being overlooked for consideration of bony reconstruction during the index surgical procedure in patients with recurrent anterior instability.
Footnotes
One or more authors have declared the following potential conflict of interest or source of funding: A.M. and M.H.J. have received unrestricted research grants from Arthrex, Donjoy, BREG, and Stryker. A.M. has received royalties from Zimmer and Tenet, has received nonincome support from Arthrosurface, and is a consultant for Arthrosurface and Stryker. M.H.J. is a consultant for Allergan. A.J.B. has an academic communication affiliation with Saunders Elsevier.