
Abstract
Background:
There is a need for tools to predict the chondrogenic potency of autologous cells for cartilage repair.
Purpose:
To evaluate previously proposed chondrogenic biomarkers and to identify new biomarkers in the chondrocyte transcriptome capable of predicting clinical success or failure after autologous chondrocyte implantation.
Study Design:
Controlled laboratory study and case-control study; Level of evidence, 3.
Methods:
Five patients with clinical improvement after autologous chondrocyte implantation and 5 patients with graft failures 3 years after implantation were included. Surplus chondrocytes from the transplantation were frozen for each patient. Each chondrocyte sample was subsequently thawed at the same time point and cultured for 1 cell doubling, prior to RNA purification and global microarray analysis. The expression profiles of a set of predefined marker genes (ie, collagen type II α1 [COL2A1], bone morphogenic protein 2 [BMP2], fibroblast growth factor receptor 3 [FGFR3], aggrecan [ACAN], CD44, and activin receptor–like kinase receptor 1 [ACVRL1]) were also evaluated.
Results:
No significant difference in expression of the predefined marker set was observed between the success and failure groups. Thirty-nine genes were found to be induced, and 38 genes were found to be repressed between the 2 groups prior to autologous chondrocyte implantation, which have implications for cell-regulating pathways (eg, apoptosis, interleukin signaling, and β-catenin regulation).
Conclusion:
No expressional differences that predict clinical outcome could be found in the present study, which may have implications for quality control assessments of autologous chondrocyte implantation. The subtle difference in gene expression regulation found between the 2 groups may strengthen the basis for further research, aiming at reliable biomarkers and quality control for tissue engineering in cartilage repair.
Clinical Relevance:
The present study shows the possible limitations of using gene expression before transplantation to predict the chondrogenic and thus clinical potency of the cells. This result is especially important as the chondrogenic potential of the chondrocytes is currently part of quality control measures according to European and American legislations regarding advanced therapies.
Keywords
Cartilage tissue engineering is a rapidly evolving intervention that aims to treat cartilage damage and has the potential to modulate the progression of osteoarthritis (OA). 35 Autologous chondrocyte implantation (ACI) is currently considered an effective treatment method for larger (≥2 cm2) lesions. In this 2-stage technique, first described by Brittberg et al, 6 autologous chondrocytes are harvested from a low load–bearing area of the knee, expanded in vitro, and reinserted into the defect. Cartilage-like regeneration and successful clinical outcomes of up to 20 years have been reported for this treatment. 42,46 Prognostic clinical factors that have been suggested to influence outcomes are patient age, defect characteristics, sports-related activity, time since symptom onset, and previous surgeries to the index knee. 4,8,9,30,36,53 In general, up to 20% of ACI treatments fail. 20,27 Factors that have been associated with these failures include previous surgeries to the index knee and female sex. 27 In recent years, molecular biomarkers have received more attention as they have the potential to provide an objective measure of a response to a therapeutic intervention. 32 Collagen type II staining in biopsy specimens from patients with good clinical outcome suggests chondrogenicity of the graft to be an important prognostic factor. 41 In addition, markers found in monolayer cultures such as fibroblast growth factor receptor 3 (FGFR3), bone morphogenic protein 2 (BMP2), collagen type II α1 (COL2A1), and aggrecan (ACAN) have been associated with cartilage formation in vivo while activin receptor–like kinase receptor 1 (ACVRL1) marked the loss of in vivo cartilage-forming potential. 12 The loss of chondrocyte differentiated characteristics in vitro has also been linked to a reduced sox-9 transcription factor. 19,29 In contrast, expression of the cytokine transforming growth factor (TGF)–β2 and several surface molecules such as chondroitin sulfate proteoglycan 4, syndecan 2, and CD44 have indicated high chondrogenic capacity. 1,16 However, evidence to support the relationship between the presence of biomarkers during the in vitro culture before the implantation and clinical outcome is lacking. Therefore, it is unclear whether these markers could be used as prognostic and quality measures in clinical practice when assessing the potency of the cells before they are modified (ie, redifferentiated) and used in cellular-based treatments. This is highly relevant for the treating surgeon and scientists as currently, potency assessment of the cells used in cell therapy is a requirement in the European Medicines Agency’s regulation on advanced therapies (regulation [EC] 1394/2007) and also in the United States, where autologous cell therapies are considered drugs (Food Drug and Cosmetic Act, in 21 CFR 1270.1(c), 2006).
The purposes of this study were to identify new biomarkers to predict clinical outcomes and to evaluate if previously reported markers are predictive of clinical outcome.
Materials and Methods
The expression of a predefined set of markers, including COL2A1, BMP2, FGFR3, ACAN, CD44, and ACVRL1 in the chondrocytes was used as a predictive measure. These markers were selected based on the literature, as their value in determining cartilage-forming potential has been reported previously. 11 –13,16,29,41,47 The list of genes identified to be important for chondrogenic capacity of human chondrocytes by Dehne et al 10 were also investigated in the success and the failure groups. Furthermore, an unsupervised, global analysis of gene transcription was also performed, and genes and pathways that deviated between the success and failure groups were identified. Software programs were used to conduct a multivariate analysis of the array results.
Patients
Included patients received ACI using a Hyalograft C scaffold as treatment of a cartilage defect in the knee between 2006 and 2008. Indications for ACI included patients who had been operated on before using microfracture but without success and with defects larger than 3 cm2.
The patients were divided into 2 groups: graft success and graft failure. The inclusion criteria for both groups were age 18 to 45 years, a maximum of 1 previous treatment to the index knee, and a single lesion in 1 knee. A failure was defined as a patient requiring reintervention due to the patients having developed pain and disability and magnetic resonance imaging and/or arthroscopy showing a poor healing of the repair within 3 years after surgery without a traumatic or other apparent cause for failure. Exclusion criteria included axis deviation or another known cause for failure such as a direct trauma. If patients met the inclusion criteria, they were selected for the success group if they achieved a highly statistically significant improvement (P < .01) in clinical outcome scores 3 years after ACI. The clinical outcome was measured with the Knee Injury and Osteoarthritis Outcome Score (KOOS), the Lysholm knee rating scale, the Tegner activity scale, and a subjective evaluation of clinical improvement (SECI). The KOOS is a 5-subscale questionnaire designed for follow-up of knee injury and osteoarthritis that has been validated for follow-up of cartilage lesions. 3,45 The Lysholm scale is an 8-item questionnaire originally designed for anterior cruciate ligament reconstruction and modified to assess articular cartilage damage. 48 The Tegner activity scale measures the activity level in a 10-item scale. 50 All patients were treated in the same cartilage repair center by the same surgeon and consented to participate. Analysis of cartilage biopsies as well as clinical follow-up of the patients was approved by the institutional review board and performed during the same study period. For all patients, the Hyalograft C scaffold was seeded with 8 to 16 × 106 cells.
Chondrocyte Culture
Cartilage biopsies were taken, and chondrocytes for the ACI procedure were isolated as described. 6 Surplus chondrocytes were taken from the same expanded pool of autologous chondrocytes that were implanted in the patients, at the time point when the scaffold was seeded, and immediately frozen in liquid nitrogen. The surplus chondrocytes thus represented the transplanted chondrocytes before initiation of cellular modification (ie, chondrogenic redifferentiation). All patient-specific chondrocytes were thawed, at the same time point, and cultured for 1 cell doubling as previously described, 6 with the exception of a pooled human serum batch instead of autologous serum.
Total RNA Isolation
Total RNA from the cultured chondrocytes was extracted with an Allprep DNA/RNA/Protein Mini Kit (Qiagen) according to the manufacturer’s protocol for monolayer-cultured cells. RNA concentration was measured on a NanoDrop (Thermo Scientific), and the quality was verified using an Agilent Bioanalyzer (Agilent Technologies).
Microarray Analysis
Total RNA from the failure and success chondrocytes was analyzed using global microarrays. To measure the mRNA expression, fragmented cDNA was hybridized at 45°C for 16 hours to whole transcript Gene ST 1.0 arrays (Affymetrix). The microarrays were scanned on a GeneChip Scanner 3000 7G (Affymetrix), and expression signals were extracted and normalized using the Expression Console (Affymetrix) applying the robust multichip average (RMA) normalization method.
Real-Time Quantitative Polymerase Chain Reaction
Microarray results were verified by quantitative polymerase chain reaction (qPCR). Total RNA from corresponding samples were reverse transcribed in equal amounts with the High-Capacity cDNA Reverse Transcription Kit (Applied Biosystems) on a 2720 Thermal Cycler (Applied Biosystems). Samples were analyzed in duplicates with equal amounts of cDNA and the TaqMan Universal master mixture with 1× assay-on-demand mixes of primers using the 7900HT Real-Time PCR system (Applied Biosystems). The genes analyzed with qPCR were selected from the predefined marker set and from genes annotated with enriched biological process terms in the gene ontology (GO) analysis (assay number in parentheses): COL2A1 (Hs00156568_m1), BMP2 (Hs00154192_m1), FGFR3 (Hs00179829_m1), ALK1 (Hs00163543_m1), ACAN (Hs00153936_m1), CD44 (Hs01075862_m1), PTPRD (Hs00369913_m1), PTPRF (Hs00892965_m1), ST6GAL2 (Hs00383641_m1), GCLC (Hs00155249_m1), PRLR (Hs01061477_m1), GRIK2 (Hs00222637_m1), LYST (Hs00915897_m1), AGT (Hs01586213_m1), FAIM2 (Hs00392342_m1), PHLDA1 (Hs00378285_g1).
Cyclophilin A (Hs99999904_m1) was used as a reference gene, and the relative quantification of target genes was performed according to the standard curve method calculated by the ΔΔCq method. Unpaired Student t tests were used to compare both groups in the qPCR validation of the microarray.
Data and Statistical Analysis
Patient Data
For the difference between patient demographics and postoperative and preoperative outcome scores, an unpaired and a paired t test were used, respectively.
Clustering
To explore potential global differences between the 2 groups, a hierarchical clustering was performed using Pearson correlation and average linkage. Different filtering thresholds of background expression were evaluated.
Identification of Differentially Expressed Genes
To identify genes that were differentially expressed between the success and failure groups, a Student t test was performed, and mean fold change values between the 2 groups were calculated for all genes. Genes with P values <.05 and with a fold change >20% were defined as differentially expressed genes (DEG).
Gene Set Enrichment Analysis
To detect pathways that differ between the 2 groups, a gene set enrichment analysis (GSEA) was performed using the Kyoto Encyclopedia of Genes and Genomes (KEGG) pathways as gene sets. For details, see http://www.broadinstitute.org/gsea/index.jsp.
Gene Ontology Analysis
To investigate the functional properties of the induced and repressed genes in the success group, a GO enrichment analysis was performed using the database for annotation, visualization, and integrated discovery (DAVID) bioinformatics resource. 24,25 The induced and repressed genes in the success group were used as an entry list, respectively, and all genes represented on the arrays were used as the reference list. Significantly overrepresented GO annotations for biological process were identified.
Multivariate Analysis
The multivariate analysis was performed using SIMCA-P 12+ software (Umetrics AB). The centered and normalized raw data from the array including all 10 patients were analyzed with a principal component analysis (PCA) and a discriminant analysis using orthogonal partial least square analysis (OPLS-DA). The 5% of the variables that participated the most to the OPLS-DA were used to perform PCA models for the 5 success patients and the 5 failure patients, respectively. The predictions for those models are visualized in a Coomans plot.
Subsequently, an OPLS-DA was performed with 3 randomly selected success and failure patients. PCA models were performed with the 5% of the variables that participated the most to the separation between the groups in this second OPLS-DA. Thereafter, the 2 failure and 2 success patients that were not used to produce the prediction models were fitted into the models previously created out of the 3 success and 3 failure patients, and the predictions were visualized with a second Coomans plot.
Results
Patient Data
A total of 5 patients were included in the success group and 5 patients in the failure group. Table 1 provides the patient characteristics for both groups. Six patients underwent a previous procedure to the index lesion with a mean time to ACI of 15 months (range, 12-33 months). No statistical difference in patient demographics was found (P > .05). For the success group, the clinical improvement was significant in all outcome scores, with a mean improvement in Lysholm score of 16 points (range, 10-27 points; mean preoperative score, 61.80 ± 15.22; mean postoperative score, 77.60 ± 11.46; P = .009). For the overall KOOS score, the mean improvement was 31 points (range, 18-43 points; mean preoperative score, 50.35 ± 20.63; mean postoperative score, 81.67 ± 10.50; P = .002). All patients in the success group reported complete improvement on the SECI. The Tegner activity score showed increased activity postoperation for the success group (Table 2). However, all patients in the failed group required a reintervention because of graft failure (mean time to failure, 11.2 months; range, 8-19 months). The Tegner score for the failure group was unchanged after the first operation (data not shown) but increased after reoperation (Table 2).
Patient Characteristics of the Graft Success and Graft Failure Groups a

a ACI, autologous chondrocyte implantation; BMI, body mass index; MF, microfracture; MFC, medial femoral condyle; SEM, standard error of the mean.
Tegner Scores of the Graft Success and Graft Failure Groups a

a SEM, standard error of the mean.
Comparative Gene Expression Analysis and Multivariate Analysis
The comparative microarray analysis did not reveal any global clustering between chondrocytes from the failure and success groups (Figure 1). The normalized data from the microarrays was also subjected to multivariate analysis. PCA of the total genome also failed to show a clear expressional disparity that can separate the success and failure groups (Figure 2A). Discriminant analysis using orthogonal partial least square analysis using the knowledge of success and failure classes as a discriminating variable did separate the global gene expression into 2 clear groups, representing success and failure patients. Selecting 5% of the transcripts that participated most to the separation of the success and failure groups resulted in a set of 1443 transcripts, as indicated in the PLS-DA loading plot (Figure 2B). Using those transcripts as variables in PCA models for the success and failure groups resulted in an acceptable classification (Figure 2C). However, a prediction analysis where a PCA model is made out of 3 randomly selected patients from each group and the selected 5% of the transcripts that separate these 6 patients in an additional OPLS-DA failed to predict the group classification of the 4 excluded patients (Figure 2D). Only 30% of the transcripts correlated between the OPLS-DA performed with all 10 patients and the OPLS-DA performed with 3 randomly selected patients from the success group and the failure group, respectively (data not shown). Additional data from the cell cultures (passage number and number of cell doublings) or the variables patient age, sex, and lesion size could not contribute to a separation of the 2 groups in the PCA. Neither the predefined set of gene markers nor the genes identified to be important for chondrogenic capacity by Dehne et al 10 contributed to any separation of the 2 groups (data not shown). A Student t test was performed to identify genes with a low grade of differential expression between the failure and success groups. The t test identified 541 transcripts to be differentially expressed between groups. A total of 346 transcripts were induced in the success group and 195 transcripts in the failure group. The list of 541 transcripts was filtered to remove genes with small fold changes (<1.2). This approach resulted in 39 genes that were induced and 38 genes that were repressed in the success group (Tables 3 and 4). No intergroup differences were found for the predefined gene set FGFR3, BMP2, COL2A1, ACAN, CD44, and ACVRL1 and the gene list published by Dehne et al 10 (Figure 3).

Dendogram showing no global clustering between the groups.
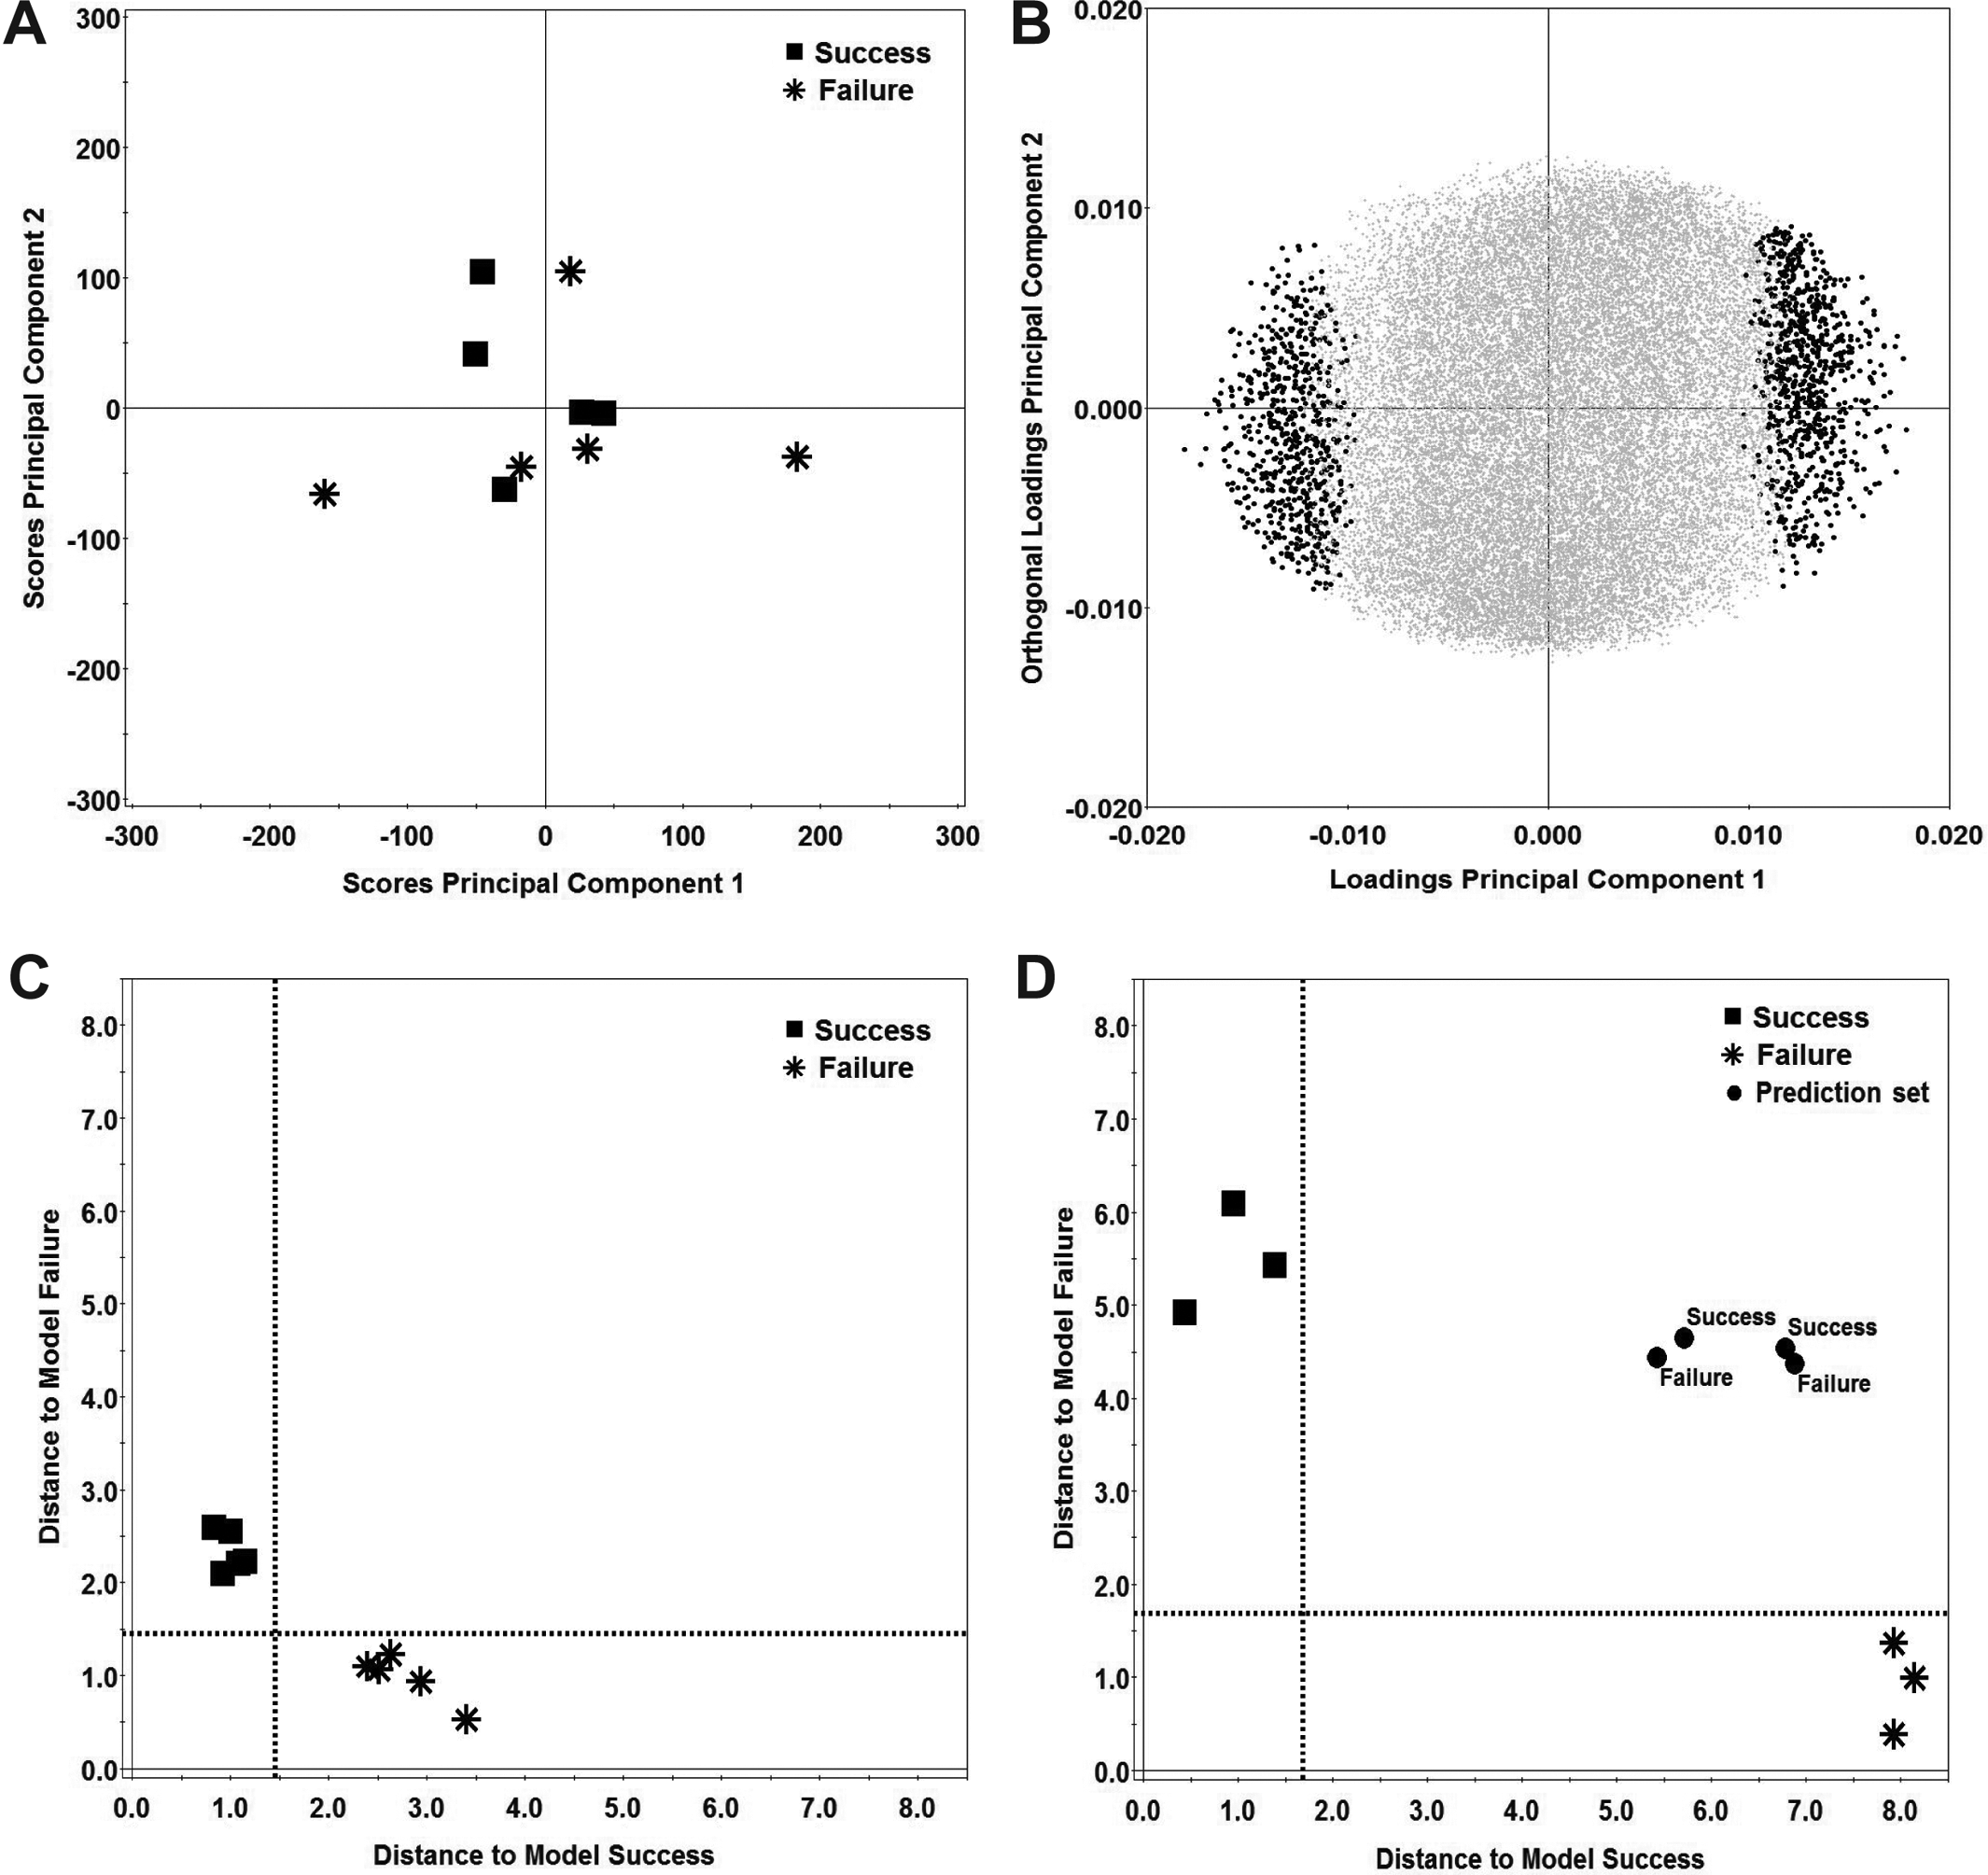
Multivariate data analysis of the centered and normalized array data. (A) Score plot of principal component analysis (PCA) of the centered and normalized data from the arrays including all 10 patients. (B) Loading plot of discriminant analysis using orthogonal partial least square analysis (OPLS-DA) of the data from the array including all 10 patients. Dots indicate the set of transcripts that participate most to the separation of the groups; black dots, the set of 1443 transcripts; gray dots, the cloud of excluded transcripts. (C) Coomans plot showing the prediction PCA models for the 5 success patients and the 5 failure patients where the 5% of the variables that participated the most to the OPLS-DA were used to perform the PCA. Dotted line, 5% confidence limit of the model. (D) Coomans plot showing the prediction for all 10 patients. In this analysis, 3 randomly selected patients from the success and failure groups were included. The 5% of the variables that participated the most in this OPLS-DA were used as data in the PCA models. The excluded patients failed to fit their respective model. Dotted line, 5% confidence limit of the model.

Heatmap of (A) chondrogenic genes and (B) the predefined set of gene markers showing no clustering of the success and failure groups. (Continued)
Induced Genes in the Success Group

Repressed Genes in the Success Group

Gene Ontology Analysis
The GO biological process term GO:0007185 “transmembrane receptor protein tyrosine phosphatase signaling pathway” showed to be enriched among the induced genes in the success group. The 2 genes that contributed to this term enrichment were PTPRD and PTPRF. The repressed genes in the success group showed enrichment of several terms related to a reparative potential, for example, the GO biological process terms GO:0042981 “regulation of apoptotic process” (contributing genes: GCLC, PRLR, GRIK2, LYST, AGT, FAIM2, PHLDA1) and the term GO:0043062 “extracellular structure organization” (contributing genes: CSGALNACT1, MUSK, RXFP1, and AGT).
Gene Set Enrichment Analysis
Gene set enrichment analysis with KEGG gene sets demonstrated 15 enriched gene sets in the failure group and 0 enriched gene sets in the success group (Table 5). Among the 15 enriched gene sets in the failure group, the cytokine cytokine-receptor interaction pathway showed enrichment of several cytokines (IL3, IL8, IL19, IL20, IL22 IFNA16, IFNA21, IFNA8, IFNB1, and IFNK) (see the Appendix).
Enriched Gene Sets From the KEGG Database in the Failure Group a

a FDR, false discovery rate; KEGG, Kyoto Encyclopedia of Genes and Genomes.
Real-Time Quantitative Polymerase Chain Reaction
Validations of the microarray results using qPCR were performed for genes selected for their contribution to the gene ontology enrichment analysis by DAVID. The qPCR confirmed the induced genes PTPRD, PTPRF, and ST6GAL2 and the repressed genes GCLC, PRLR, GRIK2, LYST, AGT, FAIME2, and PHLDA1 in the success group. The qPCR results also confirmed expression patterns seen in the microarray analysis. The gene expression variance was low in the success group for the genes GCLC, GRIK2, LYST, and AGT. Similar to the microarray analysis, no significant intergroup difference in expression was found for the predefined marker set FGFR3, BMP2, COL2A1, ACAN, CD44, and ACVRL1 (Figure 4).

Quantitative polymerase chain reaction validation of the results from the microarray analysis. Each value is plotted, and the mean is marked with a line. P < .05 was considered significant.
Discussion
The most important finding of the present study was that microarray analysis revealed no difference in gene expression between failed and successful ACI while subtle differences could be identified in expression of apoptosis-related genes, interleukin signaling, and β-catenin regulation. These results are important, as the increased availability and use of articular cartilage repair create a need for supportive tools when predicting clinical outcome. Although the expression of the genes FGFR3, BMP2, COL2A1, ACAN, CD44, and ACVRL1 has been proposed to be involved in chondrogenesis in a mouse model, the cellular mechanisms behind a successful ACI remain elusive. 12 This encouraged us to thoroughly investigate the transcriptome from chondrocytes used in a human in vivo environment. We searched for expression patterns that could help predict the clinical outcome of ACI as well as reveal cellular mechanisms behind a successful ACI repair tissue, although the cellular fate of the implanted chondrocytes cannot be determined in the present study.
Despite the differences in clinical outcomes of the included groups, the microarray analysis showed no global clustering, indicating no transcriptional differences between the successful and failed ACI treatments. A prediction analysis testing the separation found in the OPLS-DA between the success and failure groups failed to predict the group classification of the excluded patients, indicating that there is no strong separation between the 2 groups. Thus, the model-defining transcripts do not discriminate between the 2 groups on a global scale but only for the selected group. The model-defining transcripts in the 2 models have to be the same to assess true predicting transcripts. In addition, the results showed no intergroup expressional differences in the gene set proposed to predict chondrogenic capacity, further emphasizing that the chondrocytes are seemingly alike before surgery, with no possibility to assess their chondrogenic potency based on gene expression.
Dell’Accio et al 12 found the marker set that was included in this study to be of importance for cartilage forming capacity in vivo. Nonclinical data have supported the introduction of a gene marker profile that included several of these markers to determine in vivo cartilage-forming potential of characterized chondrocyte implantation (CCI). 11,13,46 In a randomized controlled trial comparing CCI and microfracture, Saris et al 47 found CCI patients with a high gene profile score to achieve greater improvement from baseline at 36 months compared with lower gene scores. However, this correlation was not corroborated in the recent 5-year follow-up report. 53 Furthermore, similar clinical outcomes were found for both microfracture and CCI at the latest follow-up, suggesting that the used gene profile score is predictive of cartilage regeneration but not clinical outcome. 34 In a study by Pestka et al 40 on 252 consecutive ACI patients, neither the expression of CD44, ACAN, or COL2A1 nor cell density or viability after proliferation seemed to correlate with the grade of joint degeneration, defect etiology, or patient sex. In a similar study, Niemeyer et al 38 investigated the influence of cell quality on clinical outcome after ACI based on expression of CD44, ACAN, and COL2A1. Postoperative International Knee Documentation Committee (IKDC) subjective knee scores were reported to be significantly influenced by COL2A1 expression (P < .05) at 6, 12, and 24 months and CD44 expression at 24 months. Interestingly, neither ACAN nor the number of viable cells correlated with clinical outcome. The reports mentioned above, taken together with the present results, raise the question of whether expression of these biomarkers is predictive of cartilage formation capacity in vivo and/or clinical outcome. It could be that aiming at more comprehensive prediction models, possibly including other biomarkers in the biopsy, synovium, and/or serum, as well as patient characteristics may better reflect the complexity of cartilage repair. 8,14,22,30,39,52,54
Therefore, this study searched for a more subtle expressional difference between the 2 groups, as such small differences might be missed by the stringent statistical analyses used in the microarray technology. Fine-tuning of gene expression has been reported in several differentiation studies and could possibly be of importance for the clinical outcome of ACI. 5,17 Thirty-nine genes were found to be induced and 37 genes to be repressed in the success group. Among the induced genes in the success group, PTPRD and PTPRF were included in the enriched GO term transmembrane receptor protein tyrosine phosphatase signaling pathway involved in the regulation of a variety of cellular processes, such as focal adhesion, migration, cell growth, differentiation, mitosis, and apoptosis. 15,31,55 PTPRD and PTPRF are closely related to each other, 44 and PTPRF is suggested to be a negative regulator of β-catenin tyrosine phosphorylation, which preserves focal adhesion via prevention of β-catenin release from E-cadherin. 37 Thus, PTPRF prevents accumulation of free β-catenin in the cytoplasm and may subsequently have a negative effect on β-catenin–mediated signaling. Canonical Wnt signaling is such a β-catenin–mediated signaling pathway that has been shown to be associated with activation of chondrocyte maturational genes, matrix degradation, and osteoarthritis. 7,57,59 The elevated PTPRD expression in the success group may indicate that these patients were less affected by degeneration as PTPRD is upregulated in intact cartilage biopsies as compared with damaged osteoarthritic cartilage within the same knee. 51 Similarly, Wnt7b expression, which is present during mouse limb development in perichondrial cells flanking the prehypertrophic chondrocytes, was also induced in the success group. 23,56 The roles of the genes mentioned above are unknown in ACI and need further investigation.
The present results further indicate that there is an enrichment of apoptosis-related genes among the repressed genes in the success group, including GCLC, PRLR, GRIK2, LYST, AGT, FAIM2, and PHLDA1. In validating these genes using qPCR, LYST was found to be significantly (P = .002) repressed in the success group. LYST plays a role in vesicle fusions, for example, of lysosomes, and has previously been identified in articular cartilage. 18,33 Dysfunction of LYST could result in greater propensity toward lysosome membrane permeabilization and subsequent cell death and/or an impaired plasma membrane repair due to defective lysosomal exocytosis. 26,49 Although chondrocytes used for ACI have been reported to contain a low level of apoptotic cells, the functions of the reported apoptosis-associated genes in ACI are unknown and warrants further investigation. 58 Pietschmann et al 43 suggested that research aiming at apoptosis may provide new insights in the influence of cell quality on clinical outcome as they found a negative correlation between the number of morphologic abnormal cells and clinical outcome after ACI.
In the present study, GSEA analysis suggests that there is an activation of the cytokine system in the chondrocytes from the failure group. The cytokine system is known to be involved in the pathogenesis of osteoarthritis and has serious adverse effects on cartilage extracellular matrix. 21,28 This finding is in line with the recent study by Albrecht et al, 2 which showed that IL-1β expression in the transplanted chondrocytes negatively correlate with clinical outcome.
There are limitations of the present study that need to be addressed. Although the selections of failed ACIs were based on patients requiring a reintervention due to graft failure within 3 years after surgery without a traumatic or other apparent cause for failure, a heterogeneity within the failed group could exist because of unknown factors such as lack of graft integration, a disturbed joint hemostasis, lifestyle, and/or different compliance to rehabilitation. The differences in defect size between the 2 groups may have influenced the study results. However, we consider the included sizes to be clinically relevant for both groups, and there is, to our knowledge, not necessarily a correlation between clinical outcome and the differences in defect sizes in this study. In addition, the number of included patients may not give sufficient statistical power to separate the 2 groups on the basis of gene expression differences. The chondrocyte dedifferentiation state after monolayer culture was not fully assessed in the present study as the cells underwent the same amount of expansion culture and were therefore considered to be equally affected. Furthermore, known markers of dedifferentiation (eg, collagen type I and versican) were not among the regulated genes between the 2 groups. The fate of the implanted cells is an important question that may affect the clinical outcome; however, it is outside the scope of the present study and challenging to study in patients without clinical risks. Although, the relatively low expressional differences between the 2 groups might have little or no effect on the clinical outcome, we would emphasize the possibility that fine-tuning of gene expression may lead to new insights in the cellular behavior after ACI and the identification of potential biomarkers. This is exemplified by the aforementioned gene PTPRF that is subjected to such expressional fine-tuning where high ectopic expression leads to activation of caspase-driven apoptosis. 55 As discussed above, Müller et al 37 reported that even such low differences as twice the endogenous levels of PTPRF were enough to reduce the free pool of β-catenin, which could be supportive of the present results.
Conclusion
This is the first study that evaluates the differences in gene expression of the chondrocytes before they are used in ACI to assess the chondrogenic potency of the inserted cells based on clinical success or failure. The study shows that gene expression analysis of the expanded chondrocytes prior to ACI is not a robust means of predicting clinical outcome after ACI, a result of importance when addressing legislation regulating the potency aspect of cell therapies. The results reveal subtle differences in gene expression in apoptosis, interleukin signaling, and β-catenin regulation between the 2 groups prior to ACI, which can strengthen the basis for future studies aiming to further uncover cellular mechanisms in cartilage regeneration and provide reliable biomarkers for quality control in articular cartilage repair.
Footnotes
One or more of the authors has declared the following potential conflict of interest or source of funding: This research was funded by The Swedish Research Council, grant No. 2012-2517; IngaBritt and Arne Lundberg Research Foundation; The Sahlgrenska University Hospital, Western Region, grant No. ALFGBG-137801; and the University of Gothenburg.
Appendix
Genes Contributing to the Enriched Cytokine Cytokine-Receptor Interaction Pathway
Gene Symbol
Gene Description
UniGene ID
CCL11
Chemokine (C-C motif) ligand 11
Hs.54460
CCL20
Chemokine (C-C motif) ligand 20
Hs.75498
CCL26
Chemokine (C-C motif) ligand 26
Hs.131342
CCL3
Chemokine (C-C motif) ligand 3
Hs.514107
CCL5
Chemokine (C-C motif) ligand 5
Hs.514821
CCL7
Chemokine (C-C motif) ligand 7
Hs.251526
CCL8
Chemokine (C-C motif) ligand 8
Hs.271387
CCR4
Chemokine (C-C motif) receptor 4
Hs.184926
CCR5
Chemokine (C-C motif) receptor 5
Hs.536735
CCR5
Chemokine (C-C motif) receptor 5
Hs.536735
CCR8
Chemokine (C-C motif) receptor 8
Hs.113222 // Hs.716265
CD40LG
CD40 ligand
Hs.592244
CSF2
Colony stimulating factor 2 (granulocyte-macrophage)
Hs.1349
CSF3R
Colony stimulating factor 3 receptor (granulocyte)
Hs.524517
CX3CR1
Chemokine (C-X3-C motif) receptor 1
Hs.78913
CXCL1
Chemokine (C-X-C motif) ligand 1
Hs.789
CXCL10
Chemokine (C-X-C motif) ligand 10
Hs.632586
CXCL16
Chemokine (C-X-C motif) ligand 16
Hs.716600
CXCL2
Chemokine (C-X-C motif) ligand 2
Hs.590921
CXCL3
Chemokine (C-X-C motif) ligand 3
Hs.89690
CXCL5
Chemokine (C-X-C motif) ligand 5
Hs.89714
CXCL6
Chemokine (C-X-C motif) ligand 6 (granulocyte chemotactic protein 2)
Hs.164021
CXCR6
Chemokine (C-X-C motif) receptor 6
Hs.34526
CXCR4
Chemokine (C-X-C motif) receptor 4
Hs.593413
EDA
Ectodysplasin A
Hs.105407
EGF
Epidermal growth factor (beta-urogastrone)
Hs.419815
GH2
Growth hormone 2
Hs.406754
GHR
Growth hormone receptor
Hs.125180 // Hs.684631
IFNA16
Interferon, alpha 16
Hs.56303
IFNA21
Interferon, alpha 21
Hs.113211
IFNA8
Interferon, alpha 8
Hs.73890
IFNB1
Interferon, beta 1, fibroblast
Hs.93177
IFNK
Interferon, kappa
Hs.591083
IL15RA
Interleukin 15 receptor, alpha
Hs.524117
IL18R1
Interleukin 18 receptor 1
Hs.469521
IL18RAP
Interleukin 18 receptor accessory protein
Hs.158315
IL19
Interleukin 19
Hs.661017
IL20
Interleukin 20
Hs.272373
IL21R
Interleukin 21 receptor
Hs.210546
IL22
Interleukin 22
Hs.287369
IL23R
Interleukin 23 receptor
Hs.677426
IL2RG
Interleukin 2 receptor, gamma (severe combined immunodeficiency)
Hs.84
IL3
Interleukin 3 (colony-stimulating factor, multiple)
Hs.694
IL7R
Interleukin 7 receptor
Hs.591742 // Hs.635723
IL8
Interleukin 8
Hs.624 // Hs.443948
IL9R
Interleukin 9 receptor
Hs.406228
IL9R
Interleukin 9 receptor
Hs.406228
LTA
Lymphotoxin alpha (TNF superfamily, member 1)
Hs.36
LTA
Lymphotoxin alpha (TNF superfamily, member 1)
Hs.36
LTA
Lymphotoxin alpha (TNF superfamily, member 1)
Hs.36
PF4
Platelet factor 4
Hs.81564
PF4V1
Platelet factor 4 variant 1
Hs.72933
PRL
Prolactin
Hs.1905
PRLR
Prolactin receptor
Hs.368587
TGFBR1
Transforming growth factor, beta receptor 1
Hs.494622
TNFRSF11B
Tumor necrosis factor receptor superfamily, member 11b
Hs.81791
TNFSF10
Tumor necrosis factor (ligand) superfamily, member 10
Hs.478275
TNFSF14
Tumor necrosis factor (ligand) superfamily, member 14
Hs.129708
TNFSF15
Tumor necrosis factor (ligand) superfamily, member 15
Hs.241382
TNFSF4
Tumor necrosis factor (ligand) superfamily, member 4
Hs.181097
XCL1
Chemokine (C motif) ligand 1
Hs.546295
XCR1
Chemokine (C motif) receptor 1
Hs.248116