
Abstract
Introduction
Virological failure is defined as a plasma viral load >1000 copies/mL on 2 consecutive tests after 3 months of adherence support and 6 months of ART. In Ethiopia, limited studies have developed risk prediction models, though such models are vital for guiding patient-specific interventions and improving HIV treatment outcomes.
Objective
This study aims to determine the incidence and prognostic factors of virologic failure among HIV patients on first-line HAART following the one-J program at Felege Hiwot Hospital, Northwest Ethiopia, in 2025.
Methods
A retrospective cohort study was conducted using patient records from Felegehiwot Comprehensive Specialized Hospital. Data were analyzed with STATA 17 and R 4.5.0. Descriptive statistics and multivariable logistic regression (via LASSO-selected predictors) were applied to develop a simplified nomogram. Model performance was evaluated using discrimination, calibration, and decision curve analysis to assess clinical utility.
Result
The incidence of virologic failure was 20.2% (95% CI: 17.9-22.6). Key predictors included TB-HIV co-infection, INH prophylaxis, CPT, adverse drug reactions, disclosure, alcohol use, smoking, and CD4 level. The model showed good performance (AUC = 0.817; reduced AUC = 0.810), strong calibration (Brier = 0.117), and superior clinical benefit in decision curve analysis.
Conclusion
A nomogram integrating 8 predictors TB-HIV co-infection, INH prophylaxis, CPT, adverse drug reaction history, disclosure status, alcohol use, smoking status, and CD4 count showed excellent discrimination (AUC = 0.817) and good calibration, indicating strong potential for individualized risk prediction in HIV patient management.
Plain Language Summary
This study examined why, even after taking their medications for several months, some HIV-positive individuals in Ethiopia do not respond well to their treatment (a condition known as virologic failure). When the blood virus level stays elevated in spite of treatment, it is known as virologic failure. To determine the prevalence of this issue and potential predictors, researchers examined historical medical records from Felege Hiwot Hospital. They discovered that virologic failure affected roughly 20% of patients, or 1 in 5. Numerous factors that raise the chance of treatment failure were found in the study. These include having HIV and tuberculosis (TB), not taking preventive treatments for infections (like INH or CPT), experiencing HIV medication side effects, not disclosing one's HIV status to others, smoking, drinking alcohol, and having a low CD4 count (a sign of weakened immunity). The researchers used these variables to develop a nomogram, a straightforward prediction tool that can assist medical professionals in determining each patient's risk of treatment failure. In tests, the tool performed well, and it may be able to assist physicians in determining which patients require additional attention and monitoring. Such a tool could enhance long-term treatment success in Ethiopia and personalize HIV care.
Introduction
HIV remains a major global health challenge, affecting millions worldwide. Since the first AIDS cases were reported in the United States in 1981, over 84 million people have been infected with HIV, and more than 40 million have died from AIDS-related illnesses. 1
According to the Joint United Nations Program on AIDS (UNAIDS) report in 2022, 38.4 million, 33.9 million-43.8 million people globally were living with HIV in 2021. Out of this, 36.7 million were adults and 1.7 million were children (0-14 years). About 54% of all people living with HIV (PLHIV) were women and girls. According to the overall prediction, 85% of HIV-positive individuals were aware of their status in 2021. The fact that sub-Saharan Africa accounted for 66% of new HIV infections is much more alarming.2,3 People in East and Southern Africa are disproportionately burdened by HIV, constituting more than half of the global PLHIV, with 20.7 million people currently estimated to be HIV positive.3,4 Different studies revealed that the virologic failure among HIV patients on first-line HAART in Ethiopia ranged from 5.8% to 20.85%.5-11
Based on the 2022 EPHI Spectrum estimate, Ethiopia's national adult (15-49 years) HIV prevalence is 0.91%, with women representing 61% of infections (1.0% in women vs 0.6% in men). Marked regional disparities exist, with the highest rates in Gambella (3.7%) and Addis Ababa (3.2%), and the lowest in the Somali region (0.2%). The national adult HIV incidence rate in 2022 was estimated at 0.08%. 12 The Ethiopian HIV/AIDS epidemic is characterized as mixed, with wide regional variations and concentrations in urban areas. According to estimates, the country's adult HIV incidence rate in 2022 was 0.08%, with an anticipated 11,000 deaths and 8300 new infections each year, with the majority (67%) of these cases happening in those under 30. HIV continues to be a major burden on the nation, with an estimated 610,350 PLHIV, 36,812 (6.0%) of whom are under the age of 15. 13
Effective antiretroviral therapy (ART) significantly reduces morbidity and mortality among PLHIV. Successful ART typically results in an undetectable viral load (VL) within 6 months of initiation. Achieving early viral suppression (within 24 weeks) is a strong predictor of long-term treatment success, reflected by sustained virological control, increased CD4 + cell counts, and reduced mortality. 14
The World Health Organization (WHO) recommends routine HIV VL testing as the preferred method for monitoring treatment response and detecting treatment failure among PLHIV on ART. While routine virologic monitoring is standard practice in high-income countries, targeted VL testing remains common in resource-limited settings to confirm immunologic or clinical failure before switching to second-line therapy. 15 A unsatisfactory or unsustained response to ART, as determined by clinical, immunological, or virological parameters, either separately or in combination, is referred to as HIV treatment failure. 16 HIV patients frequently experience viral failure following the start of treatment. 17 According to WHO recommendations, virological failure should not surpass 10% following the start of treatment. 18
Increasing and monitoring the capacity for VL testing are important measures for the global control of HIV, particularly in Sub-Saharan Africa, which has the highest incidence of HIV worldwide. 19 The WHO recommends one-J program (Tenofovir + Lamivudine + Dolutegravir) as a preferred first line ART for adults and adolescents. Dolutegravir (DTG) in combination with a nucleoside reverse-transcriptase inhibitor (NRTI) backbone is recommended as the preferred first-line regimen for PLHIV. DTG combined with 2 NRTIs leads to higher viral suppression and lower risk of discontinuing treatment and developing HIV drug resistance compared with EFV (Efavirenz)-based regimens among treatment-naive adults. 20
Assessing and understanding the mechanisms and factors of virologic failure is of utmost importance in the development of future interventions. 21 The clinical importance of validating risk prediction models is its reliability and accuracy in different patient populations and clinical settings, its applicability for assessing the model's clinical relevance, confirming that it incorporates relevant risk factors and aligns with current clinical practices and guidelines, and enhancing patient trust and compliance in the care they receive through the use of validated tools. Patients may be more likely to adhere to treatment recommendations when they believe their healthcare providers are using reliable and scientifically validated methods. Though the outputs of individual patient risk prediction models are important in designing and providing patient-specific intervention, only a few risk prediction studies have been conducted in Ethiopia and these studies couldn’t even address all the important variables that would have been predictors for virologic failure. 22 Preventing virologic failure can reduce the long-term costs associated with more complex treatment regimens, hospitalization, and management of advanced HIV-related conditions.
Methods and Materials
A retrospective cohort study was conducted from January 2025 to February 2025 to determine the incidence and prognostic determinants of virologic failure. The follow-up time was from the time people get diagnosed with HIV and initiated ART (t0) to the time virologic failure was tested (t1). The investigation was carried out in Bahir Dar at the Felegehiwot Comprehensive Specialized Hospital. The hospital serves as one of the area's referral centers. It can accommodate more than 500 beds. Since 1995, it has been treating patients with ART. At the hospital, 6690 patients are currently enrolled on HAART. 5996, 651, and 43 of the total ART patients are on first, second, and third lines, respectively.
Patients were included if they were aged 15 and older, who had been on first-line ART between 2017 and 2024, had at least 2 consecutive recorded VL test results, and had records in the Felegehiwot Comprehensive and Specialized Hospital's ART computerized database. Patients were excluded if they had incomplete baseline clinical or laboratory data, transferred out before VL testing and were lost to follow-up. Of the total 1151, initially assessed 5 records were excluded due to missing VL measurement, 5 due to missed baseline data, and 3 due to transferred out before VL assessment. After employing inclusion and exclusion criteria, a total of 1138 participants included into the final analysis. The sample size was determined based on the minimum standard of 10 events per candidate predictor considered; thus, the formula used was N = (n × 10)/I, where N is the sample size, n is the number of candidate predictor variables, and I is the estimated event rate in the population. 23 We have 24 prognostic predictors of virologic failure and the magnitude of virologic failure in a recent study was 20.85%. 10 Hence, the final sample size calculated was 1151. Regarding sampling, computer-generated random sampling was employed, and data were extracted from both patients’ charts and ART register databases.
Outcome measurement: Events were defined as patients who, following 3 months of adherence support and at least 6 months of ART, had a plasma VL of more than 1000 copies/mL based on 2 consecutive VL assessments.
Operational Definitions
Virological failure: It is characterized by 2 consecutive VL tests within 3 months, with improved adherence support following the first VL test, and a VL greater than 1000 copies/ml. 20
Treatment adherence: It is the proportion of a person's medication-taking habits that follow established guidelines from a medical professional. More than 95% is considered good adherence, 85% to 94% is considered acceptable adherence, and less than 85% is considered poor adherence. 20
Prognostic determinants: Socio-demographic factors (age, sex, occupation, marital status, religion, residence, educational status) and treatment-related factors (disclosure status, support group, baseline functional status, adherence, CPT, INH prophylaxis, baseline clinical WHO stage, first line ART regimen, duration on ART, history of adverse drug rxn, baseline CD4 at switch), behavioral-related factors (cigarette smoking, alcohol consumption), nutritional-related factors (baseline Hg, BMI), comorbidities-related factors (TB, other comorbidities).
A semi-structured data extraction tool (checklist) was developed based on the available literature, and data were extracted from the patient chart and computer. Four clinical nurses who trained on HIV care and treatment were involved on data collection. Training for 2 days was given for data collectors and supervisors on the objective of the study, confidentiality, steps, and data extraction. Furthermore, data completeness and quality was monitored by the supervisors.
Data Processing and Analysis
The data containing socio-demographic, diagnosis and treatment, behavioral factors, nutritional factors, and comorbidities-related factors were entered into Epi-info version 7. Then it was exported to R version 4.0.5 for analysis. Variables with missing values were: Educational status 78 (6.8%), history of other opportunistic infection 64 (5.6%), baseline alcohol use 100 (8.8%), baseline smoking status 112 (9.8%), BMI 93 (8.1%), and baseline Hgb 113 (9.9). The “mice” package in R was used to handle the missing data using multiple imputation approaches, assuming that the data were missed at random (MAR). Five imputed datasets were produced after the entire dataset underwent the imputation process. Sensitivity analysis was performed to examine the MAR assumption's plausibility. The mean, standard deviation (SD), and percentages were among the descriptive statistics that were calculated and displayed in text and table format. The rate of virologic failure was determined. Lastly, the P-values and effect sizes are presented along with their 95% confidence levels.
For the multivariable prediction model development, according to the theoretical design, prognostic factors such as comorbidities, dietary, behavioral, and diagnosis-related factors, as well as demographic and treatment-related factors, influence the likelihood of virologic failure.
To choose the strongest predictors, the Least Absolute Shrinkage and Selection Operator (LASSO) algorithm was applied. By reducing over-fitting, this feature selection technique is recommended for creating an objective and cost-effective risk prediction model. 24
In the multivariable analysis, the strongest factors identified by LASSO regression were included. The multivariable model's variables were then eliminated, and a simplified reduction model was constructed at the <0.05 level. A nomogram representing the final simplified risk prediction model was displayed, and its calibration and discriminatory power were evaluated to characterize its performance.
The discriminatory power was ascertained by computing c-statistics, and the accuracy of the simplified risk prediction model was assessed using the calibration plot and the area under the receiver operating characteristic (ROC) curve (discrimination). The range of c-statistics could be 0.5, which indicates no prediction ability, to 1 (perfect discrimination).25,26 An AUC of 0.5 indicates that a model is useless, while AUCs between 0.80 and 0.90 and 0.90 and 1.0 indicate good and outstanding model performance, respectively.27,28
The model was validated internally using a bootstrapping technique. Regression coefficients and AUC of the validated model were provided and compared with the original model after repeated resampling was done for model derivation. The Youden index was used to determine the best cut-off point for virologic failure, and patients were categorized as either high or low risk. The model decision curve analysis (DCA) standardized net benefit over a range of threshold probabilities was 0 to 1 in order to assess the clinical and public health impact of the analysis. 29 TRIPOD (transparent reporting of a multivariable prediction model for individual prognosis or diagnosis) was the final statement that was used to report the study (Supplemental material). 30
Results
This study comprised 1138 adult HIV-positive patients receiving first-line HAART between 2017 and 2024, with an overall inclusion rate of 98.8%. For the rest 13, the outcome was not recorded and the status was unknown.
Socio-Demographic and Admission Characteristics
One-third (799, 70.2%) of adult HIV positive patients on first-line HAART came from urban areas. More than half, 579 (50.9%) of adult HIV positive patients on first-line HAART have secondary and above educational status. The mean (±SD) age of the study participants was 38.26 (±11.19) years old. Nevertheless, 275 (24.2%) and 253 (22.2%) of adult HIV positive patients on first-line HAART had TB-HIV co-infection and a history of adverse drug reaction, respectively. Moreover, 345 (30.3%) of the study participants have a CD4 value below 200. Additionally, 925 (81.3%) of adult HIV positive patients on first-line HAART had good last follow-up adherence. Furthermore, 82 (7.2%) of the study subjects had ≤ 10 hemoglobin level (Table 1).
Baseline Socio-Demographic, Comorbidity and Clinical and Treatment Related, Behavioral and Nutrition Related Characteristics of HIV Patients on First Line HAART at Felegehiwot Comprehensive and Specialized Hospital 2017-2024 (n = 1138).
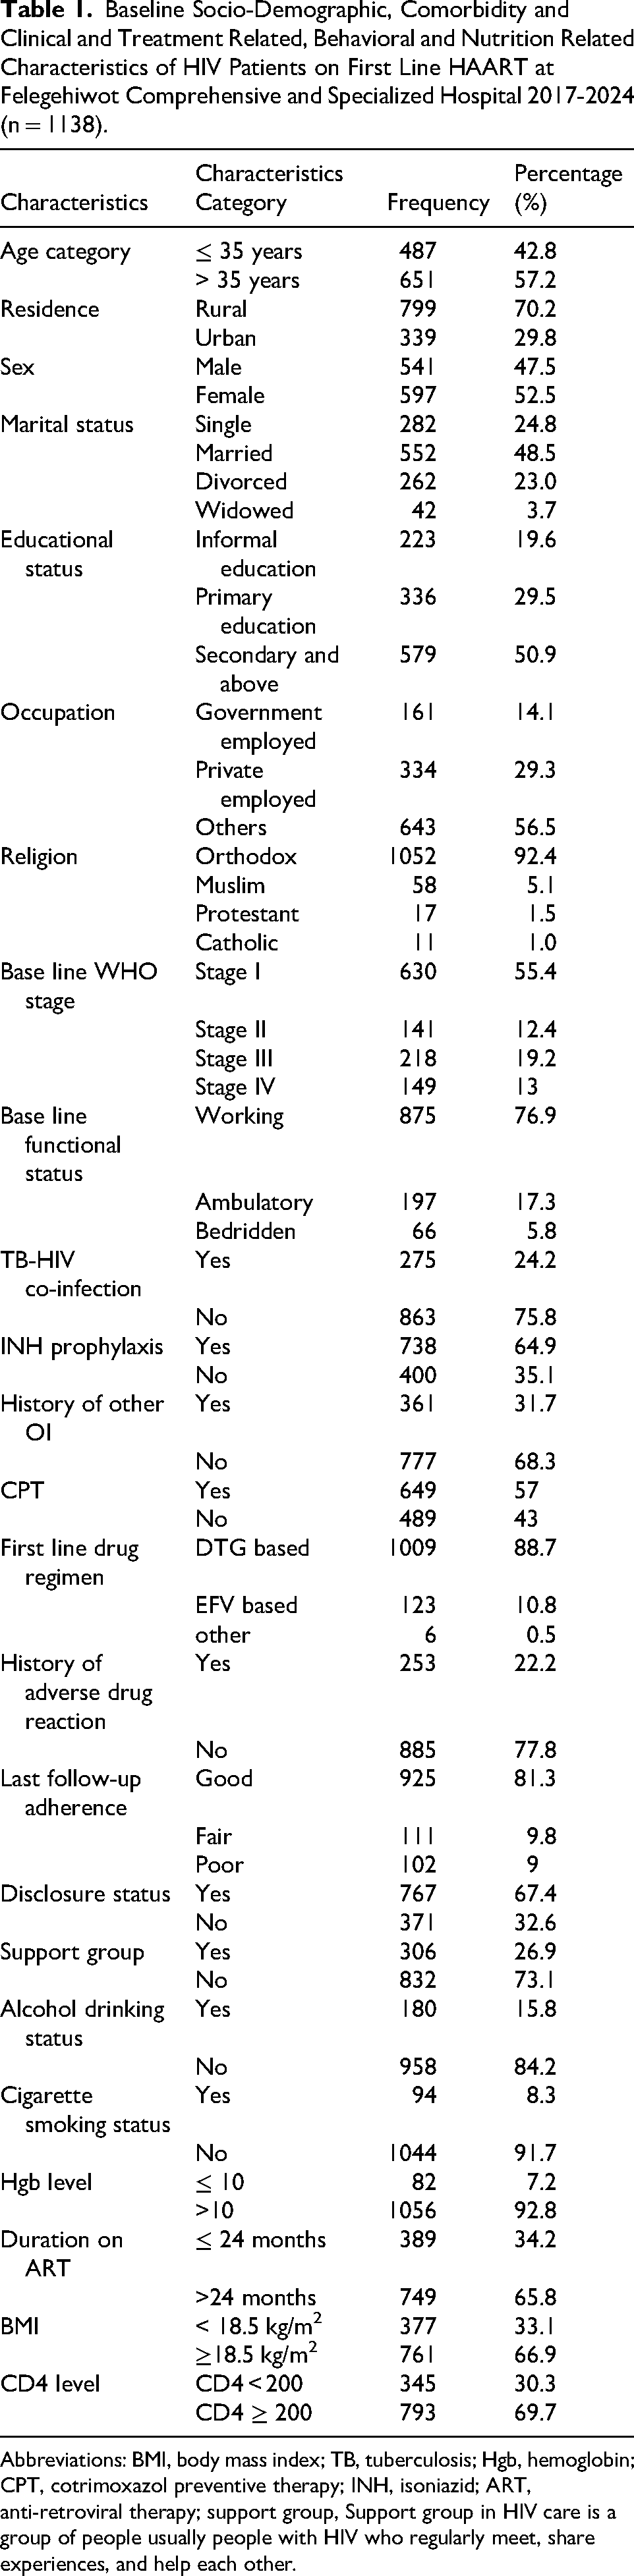
Abbreviations: BMI, body mass index; TB, tuberculosis; Hgb, hemoglobin; CPT, cotrimoxazol preventive therapy; INH, isoniazid; ART, anti-retroviral therapy; support group, Support group in HIV care is a group of people usually people with HIV who regularly meet, share experiences, and help each other.
Incidence of Virologic Failure
The study participants’ total virologic failure incidence was 20.21% [95% CI: 17.9%, 22.6%].
Variable Selection and Model Diagnosis
Using LASSO regression and 10-fold cross-validation, 44 models in all were created. The model with the lowest mean deviation and the optimal penalty factor (λ = 0.0047875) was found to be the most parsimonious. Fourteen of the 24 candidate predictors were kept because of their clinical significance and supporting data. The event-per-variable ratio (≥10) for dependable estimation was met with 230 events among 1138 individuals. Model stability and interpretability were improved by pre-selecting clinically significant variables, which was in line with TRIPOD's recommended best practices. In LASSO regression, 12 possible features (predictors) were chosen from a total of 14 co-variants (Table 2).
Optimum Shrinkage Factor (Lambda) and Potential Predictors Identified by LASSO Regression by the 10-Fold Cross-Validation Selection Method.
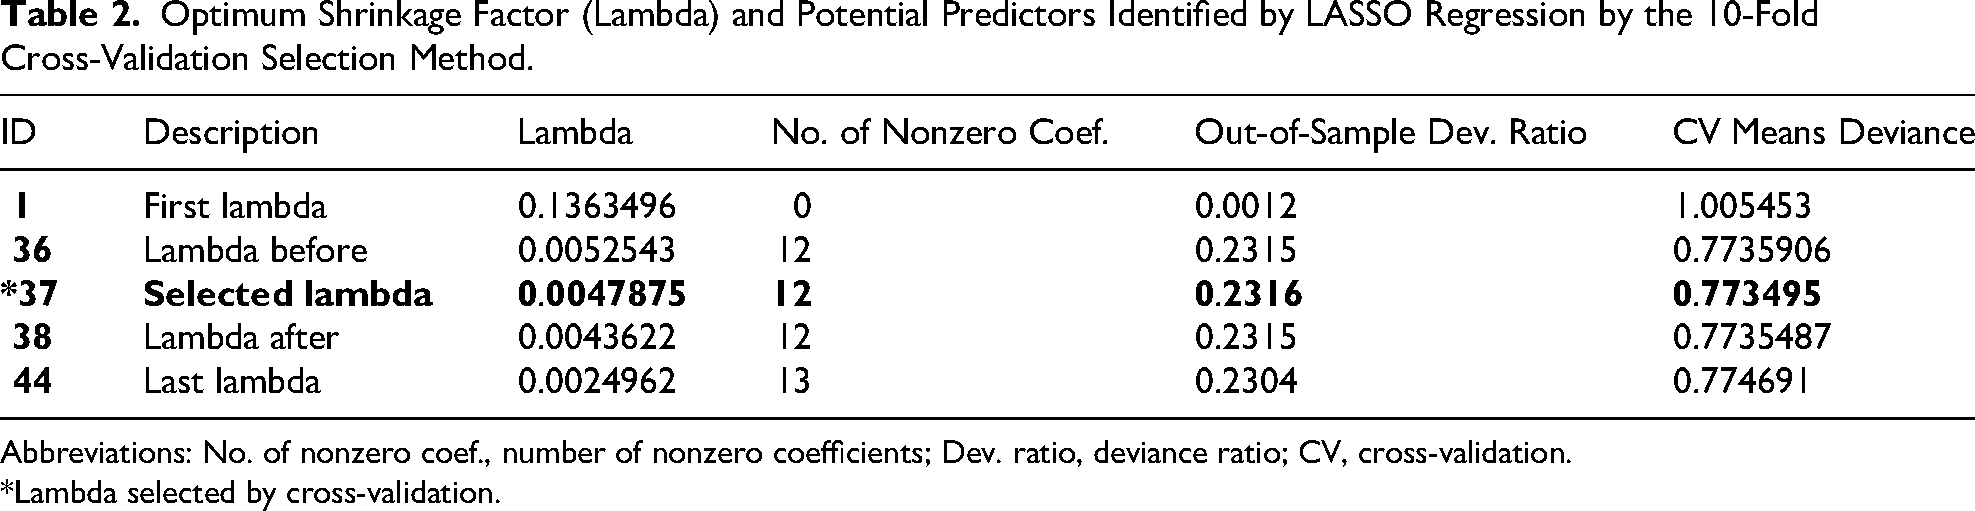
Abbreviations: No. of nonzero coef., number of nonzero coefficients; Dev. ratio, deviance ratio; CV, cross-validation.
*Lambda selected by cross-validation.
The identified 12 potential predictors selected by LASSO regression were incorporated into the multivariable analysis. These variables were: sex, TB-HIV Co-infection, INH prophylaxis, CPT, History of adverse reaction, Disclosure status, Alcohol, Smoking status, Duration on ART, BMI, CD4, and age.
Constructing a Customized Risk Prediction Model
The identified possible factors chosen by LASSO regression were used to create a customized virologic failure risk prediction model based on multivariable binomial regression analysis. At the moment of patient enrollment, the majority of the predictors are readily ascertainable (Table 3).
Multivariable Logistic Regression Analysis and Model Reduction Using Potential Predictors of Virologic Failure of HIV Patients on First Line HAART at Felegehiwot Comprehensive and Specialized Hospital 2017-2024 (n = 1138).

Abbreviations: Coef., coefficients; CI, confidence interval.
Variables included in the final simplified model.
P-value denoted with *= < .05, ** ≤ .01, *** = .001.
The Original Full Model
The original prognostic prediction model was developed using 12 candidate variables: age, sex, BMI, smoking status, alcohol consumption, duration on HAART, TB-HIV co-infection, History of adverse drug reaction, CD4 level, disclosure status, INH prophylaxis, and CPT. This full model demonstrated excellent discrimination, with an AUC of 0.817, 95% CI: 0.786, 0.847(Figure 1). Based on statistical significance and clinical relevance, 8 variables were selected for inclusion in the final nomogram: TB-HIV Co-infection, INH prophylaxis, CPT, History of adverse reaction, Disclosure status, Alcohol, Smoking status, and CD4.
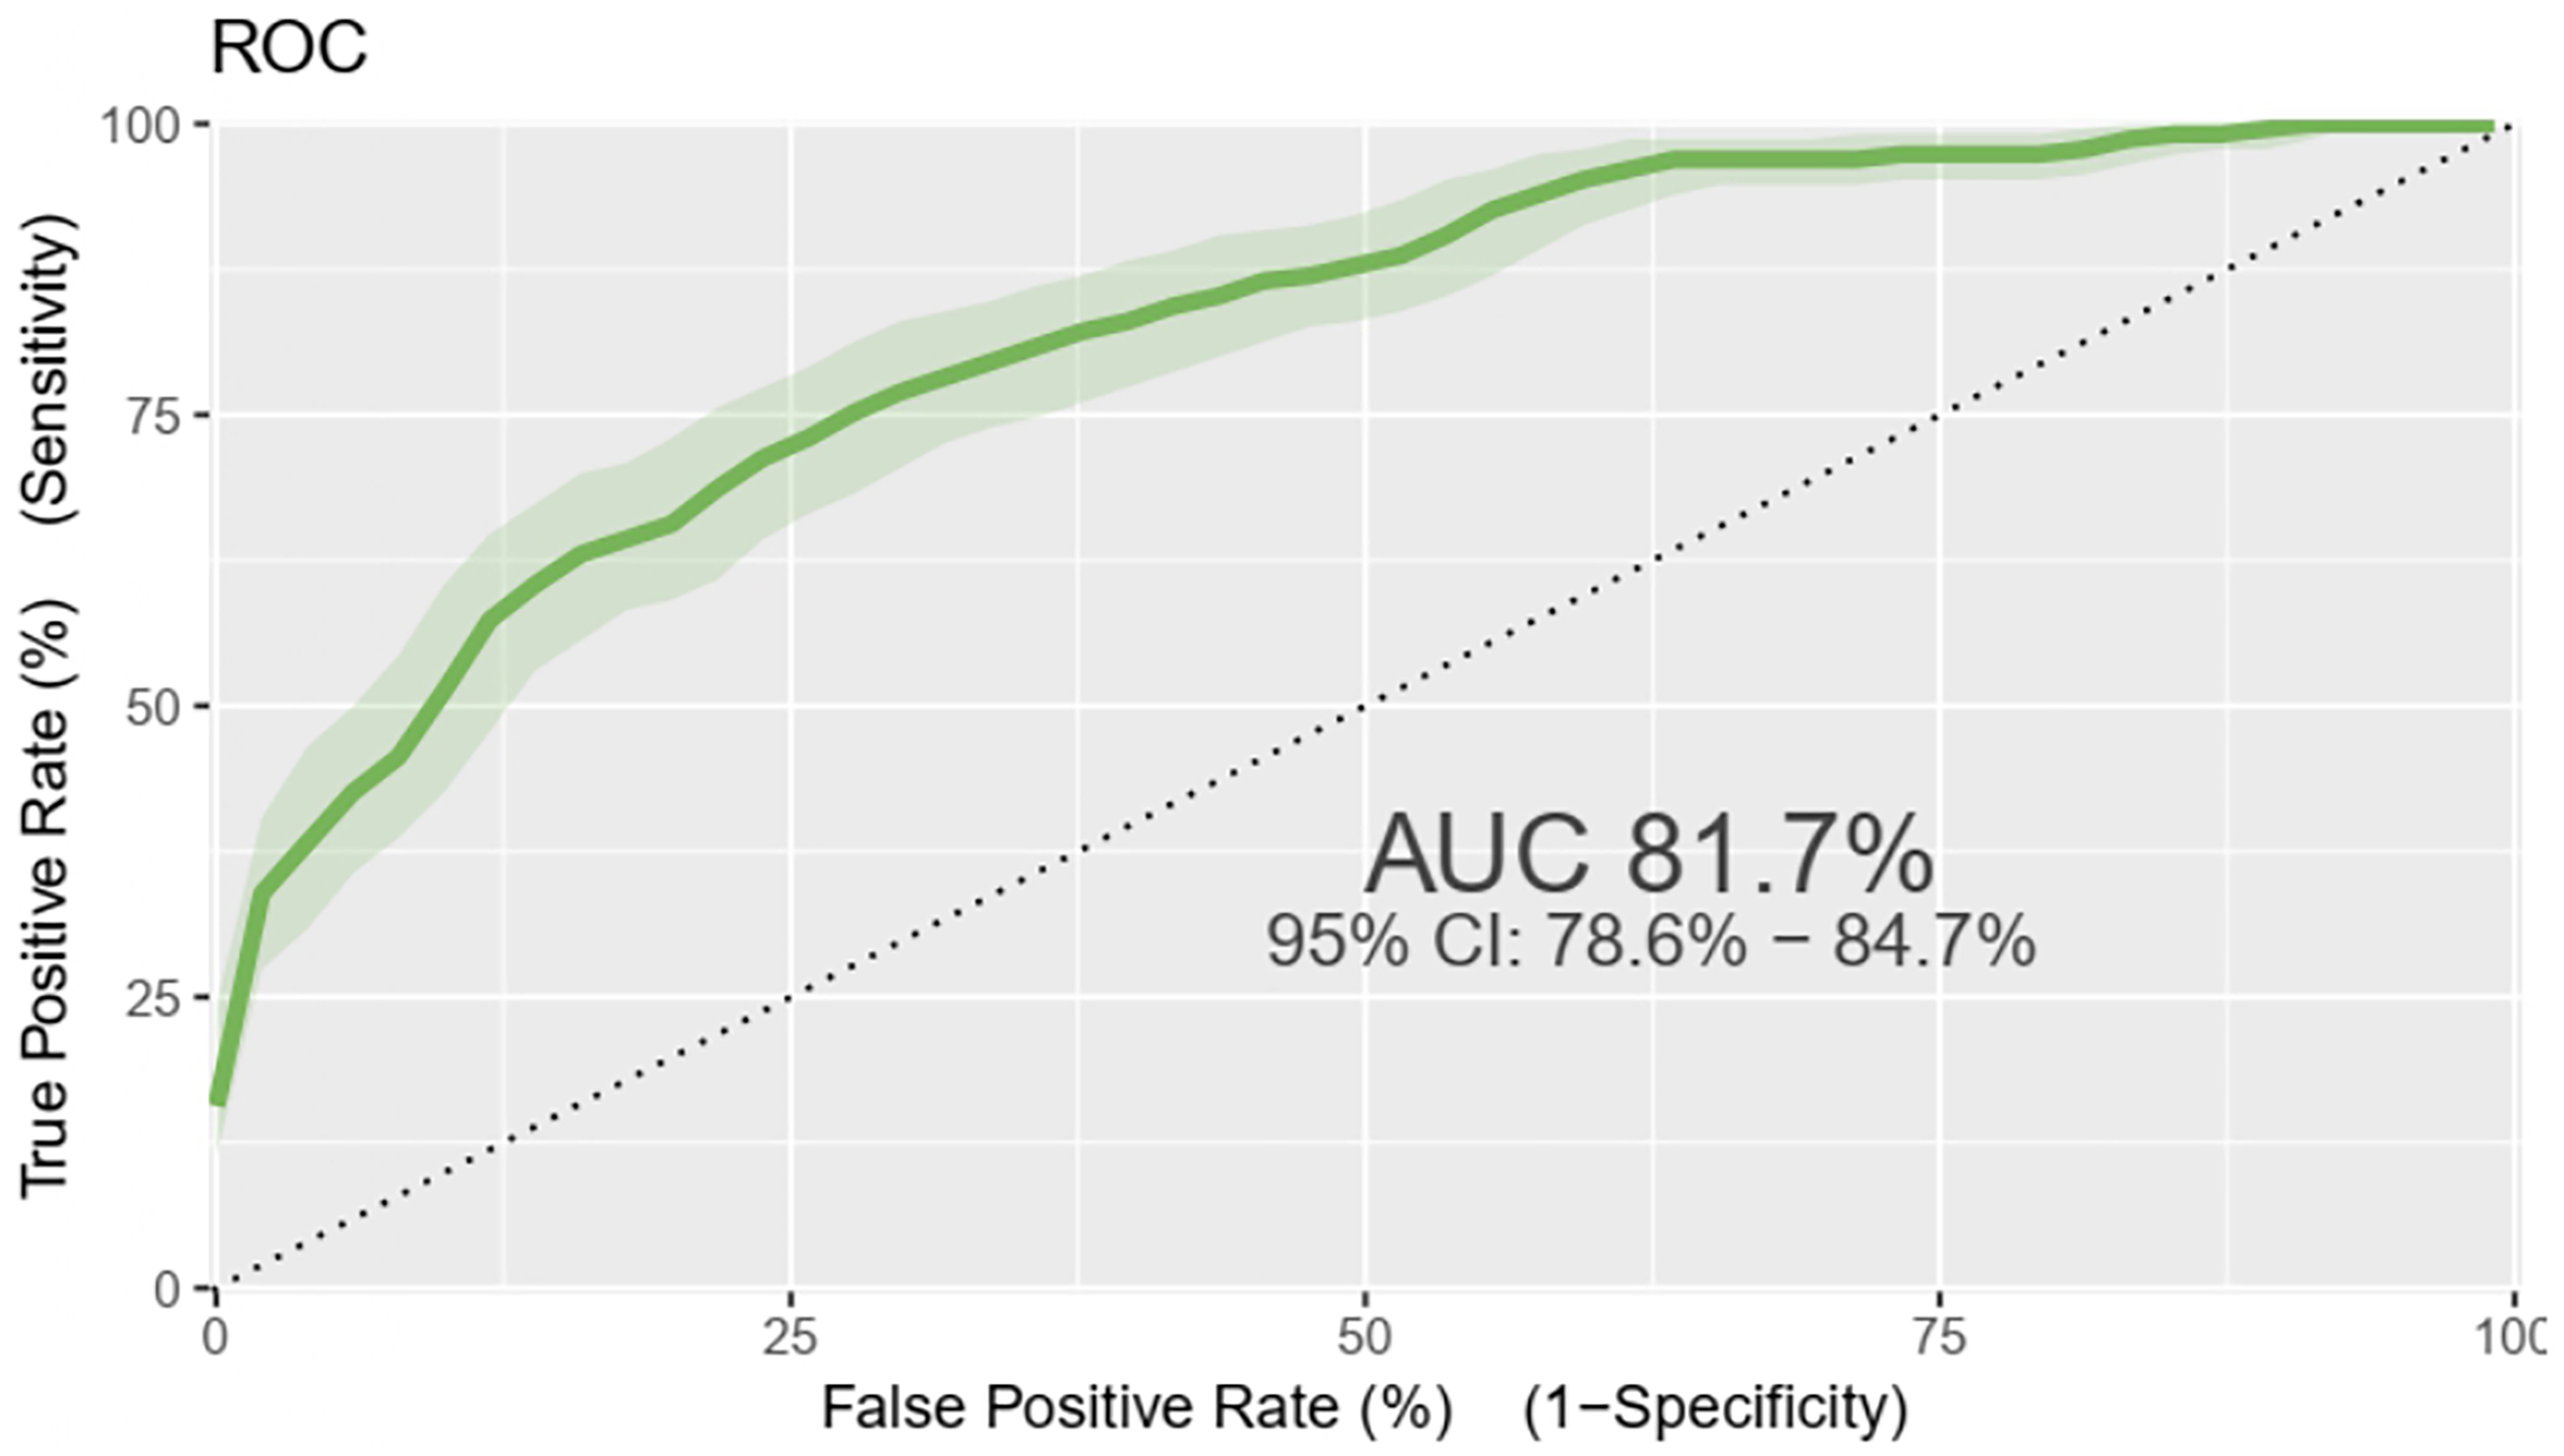
Orginal model ROC curve of virologic failure risk prediction model of adult HIV patients on HAART at Felege Hiwot specialized hospital at Amara region, 2017-2024 (n = 1138).
Nomogram of the Final Model
A nomogram model was developed using predictors that demonstrated significant associations in the multivariable logistic regression analysis. Eight variables were included: TB-HIV co-infection, INH prophylaxis, CPT, history of adverse reaction, disclosure status, alcohol use, smoking status, and CD4 count. The nomogram estimates individual risk of virologic failure, with variable scores ranging from 0 to 10 and total scores from 0 to 43 where 0 indicates 0% and 43 indicates 100% probability of virologic failure.
For example: a patient with CD4 < 200 (2.5) + who doesn’t smoke (0) + take alcohol(10) + someone disclosed (0) + had history of adverse drug reaction (5) + who took CPT (0) + complete INH prophylaxis (0) + Have TB-HIV co-infection (5.5), can have a total score of 23. This corresponds to a 68% risk of VF (Figure 2).

Nomogram for predicting virologic failure in adult HIV patients receiving first-line HAART at Felege Hiwot specialized hospital in the Amara region, 2017-2024 (n = 1138)
Performance of the Nomogram Developed
The performance of the developed nomogram was assessed using its discriminatory power and calibration plot. The area under the ROC curve demonstrated strong discrimination, with an AUC of 0.817 (95% CI: 0.786-0.849), closely matching the performance of the original model (Figure 3).
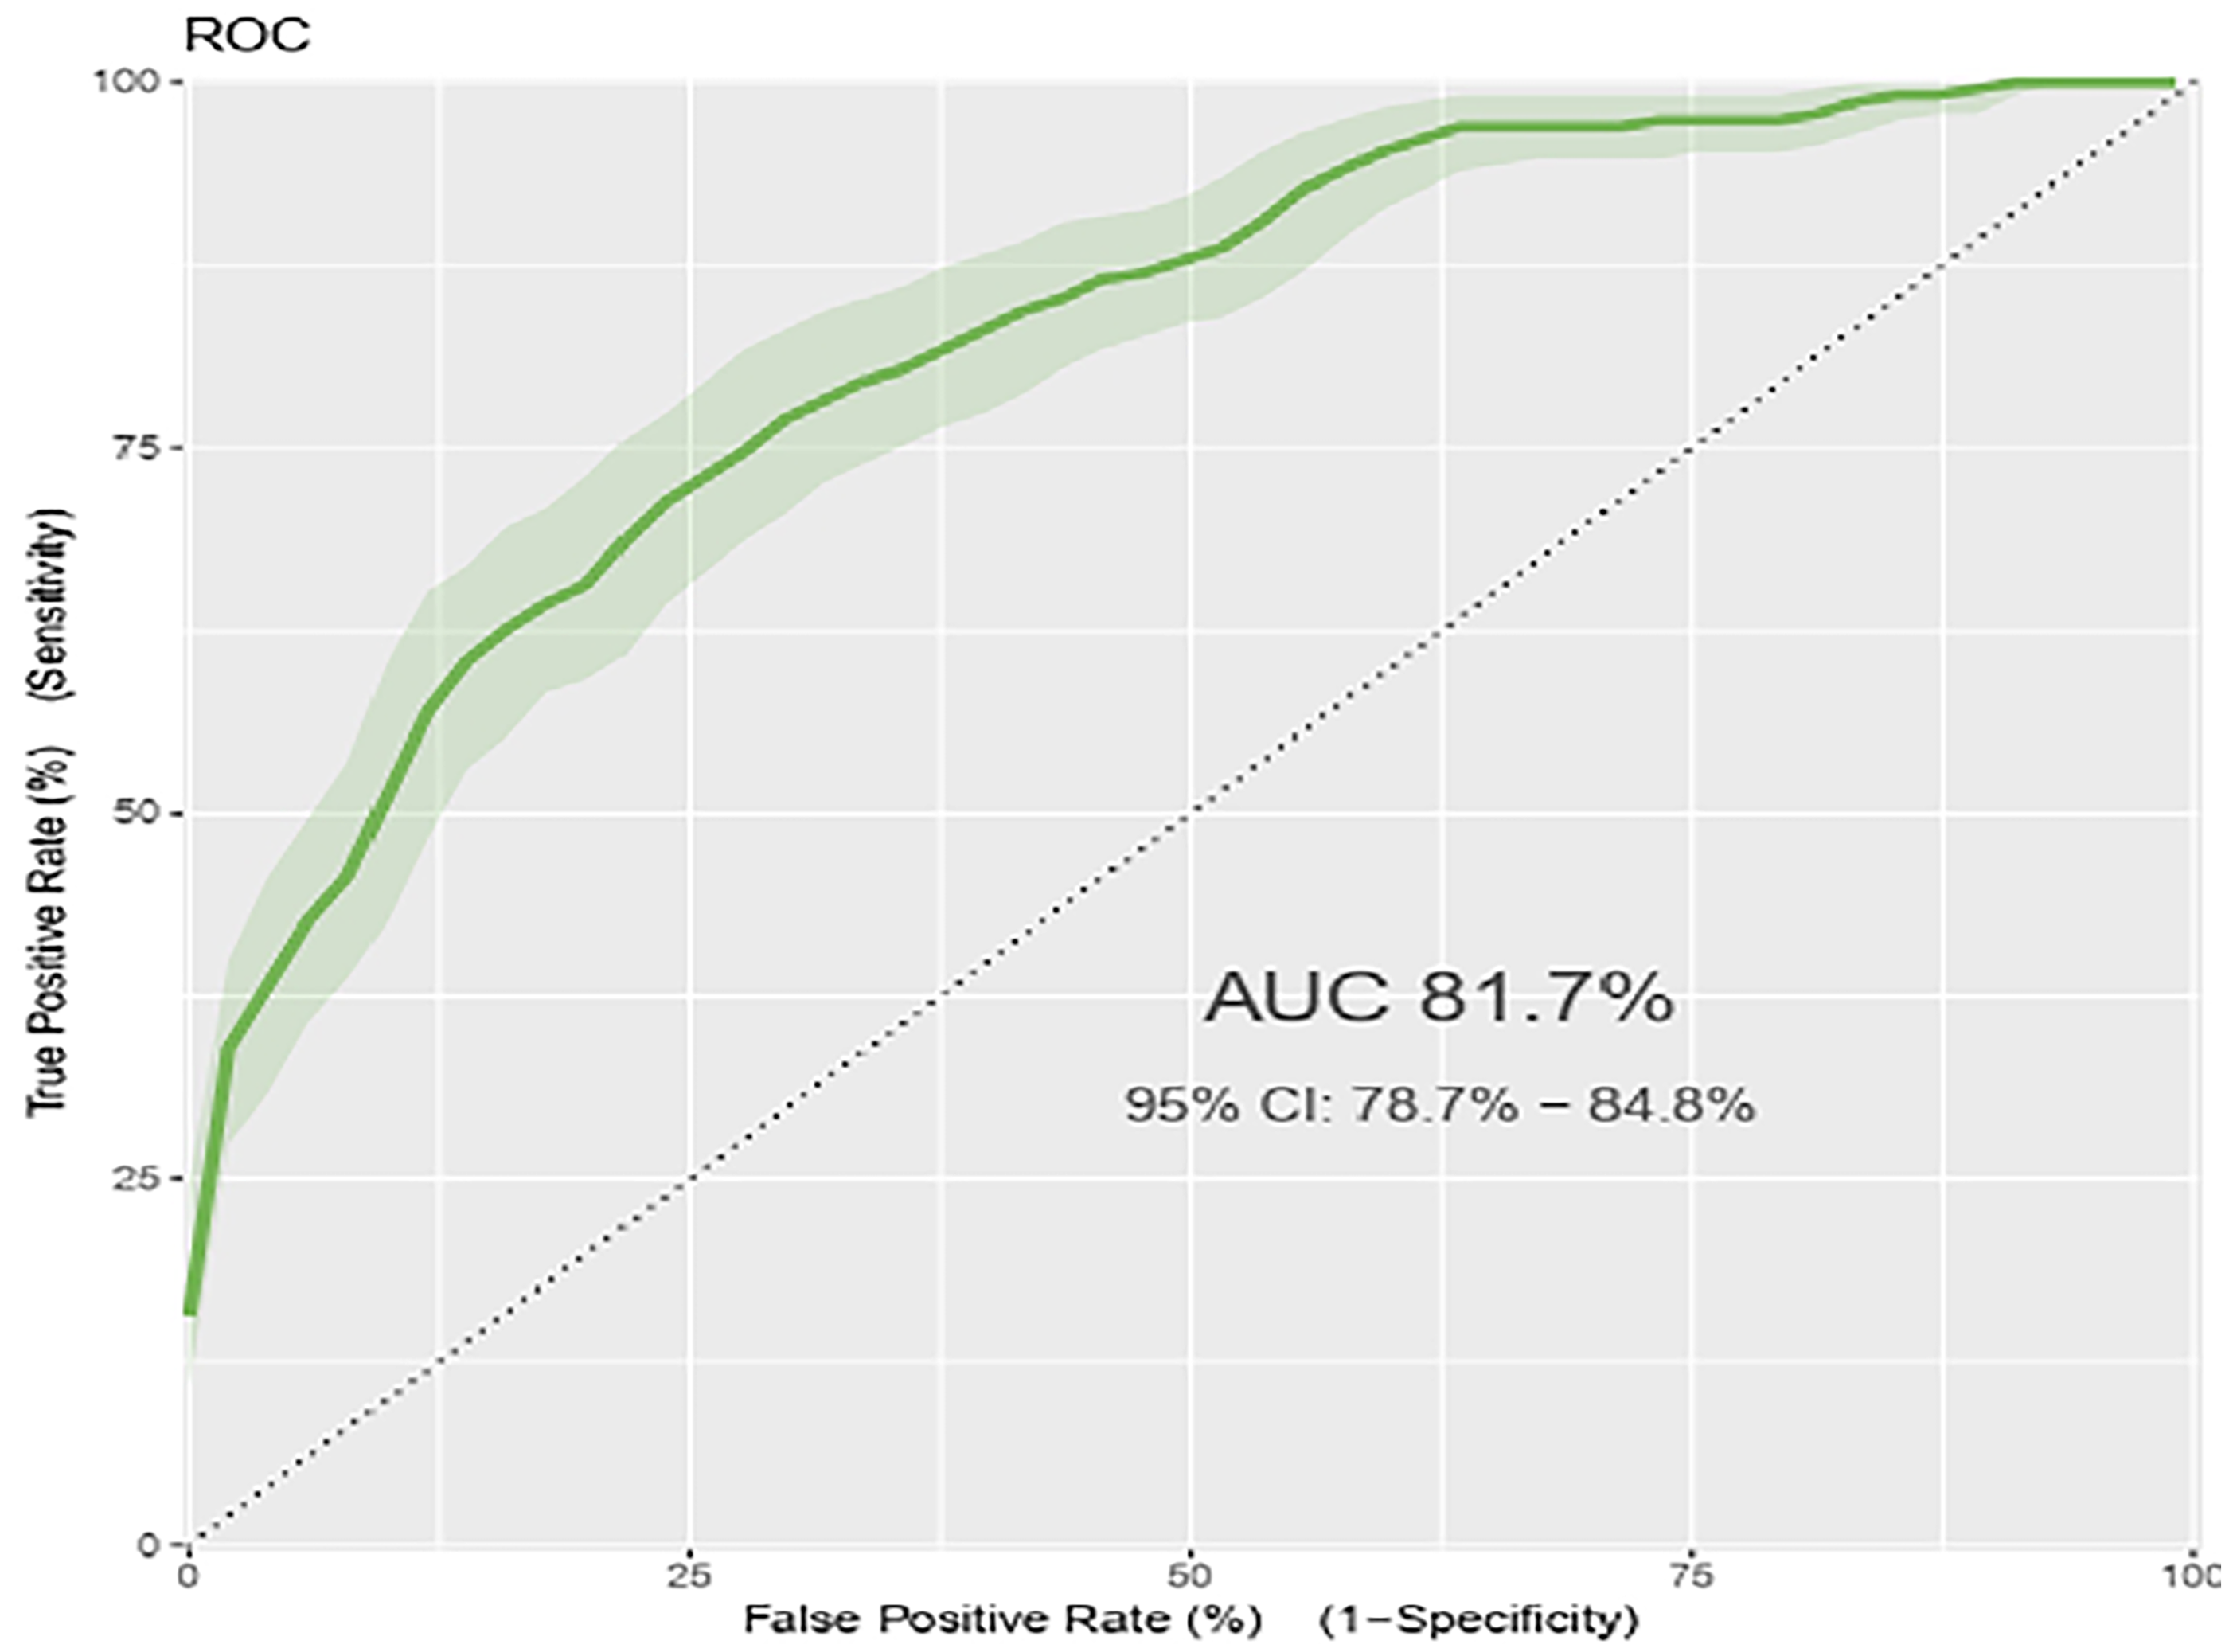
ROC curve for the final nomogram model of the virologic failure risk prediction model for adult HIV patients on HAART at Felege Hiwot specialized hospital in the Amara region, 2017-2024 (n = 1138).
Model Calibration
The model exhibited strong overall performance, with a Brier score of 0.117, indicating accurate probability predictions. The calibration plot closely aligned with the 45-degree reference line, demonstrating strong agreement between predicted and observed outcomes across risk levels. These results confirm that the model is well-calibrated and provides reliable individual risk estimates (Figure 4).
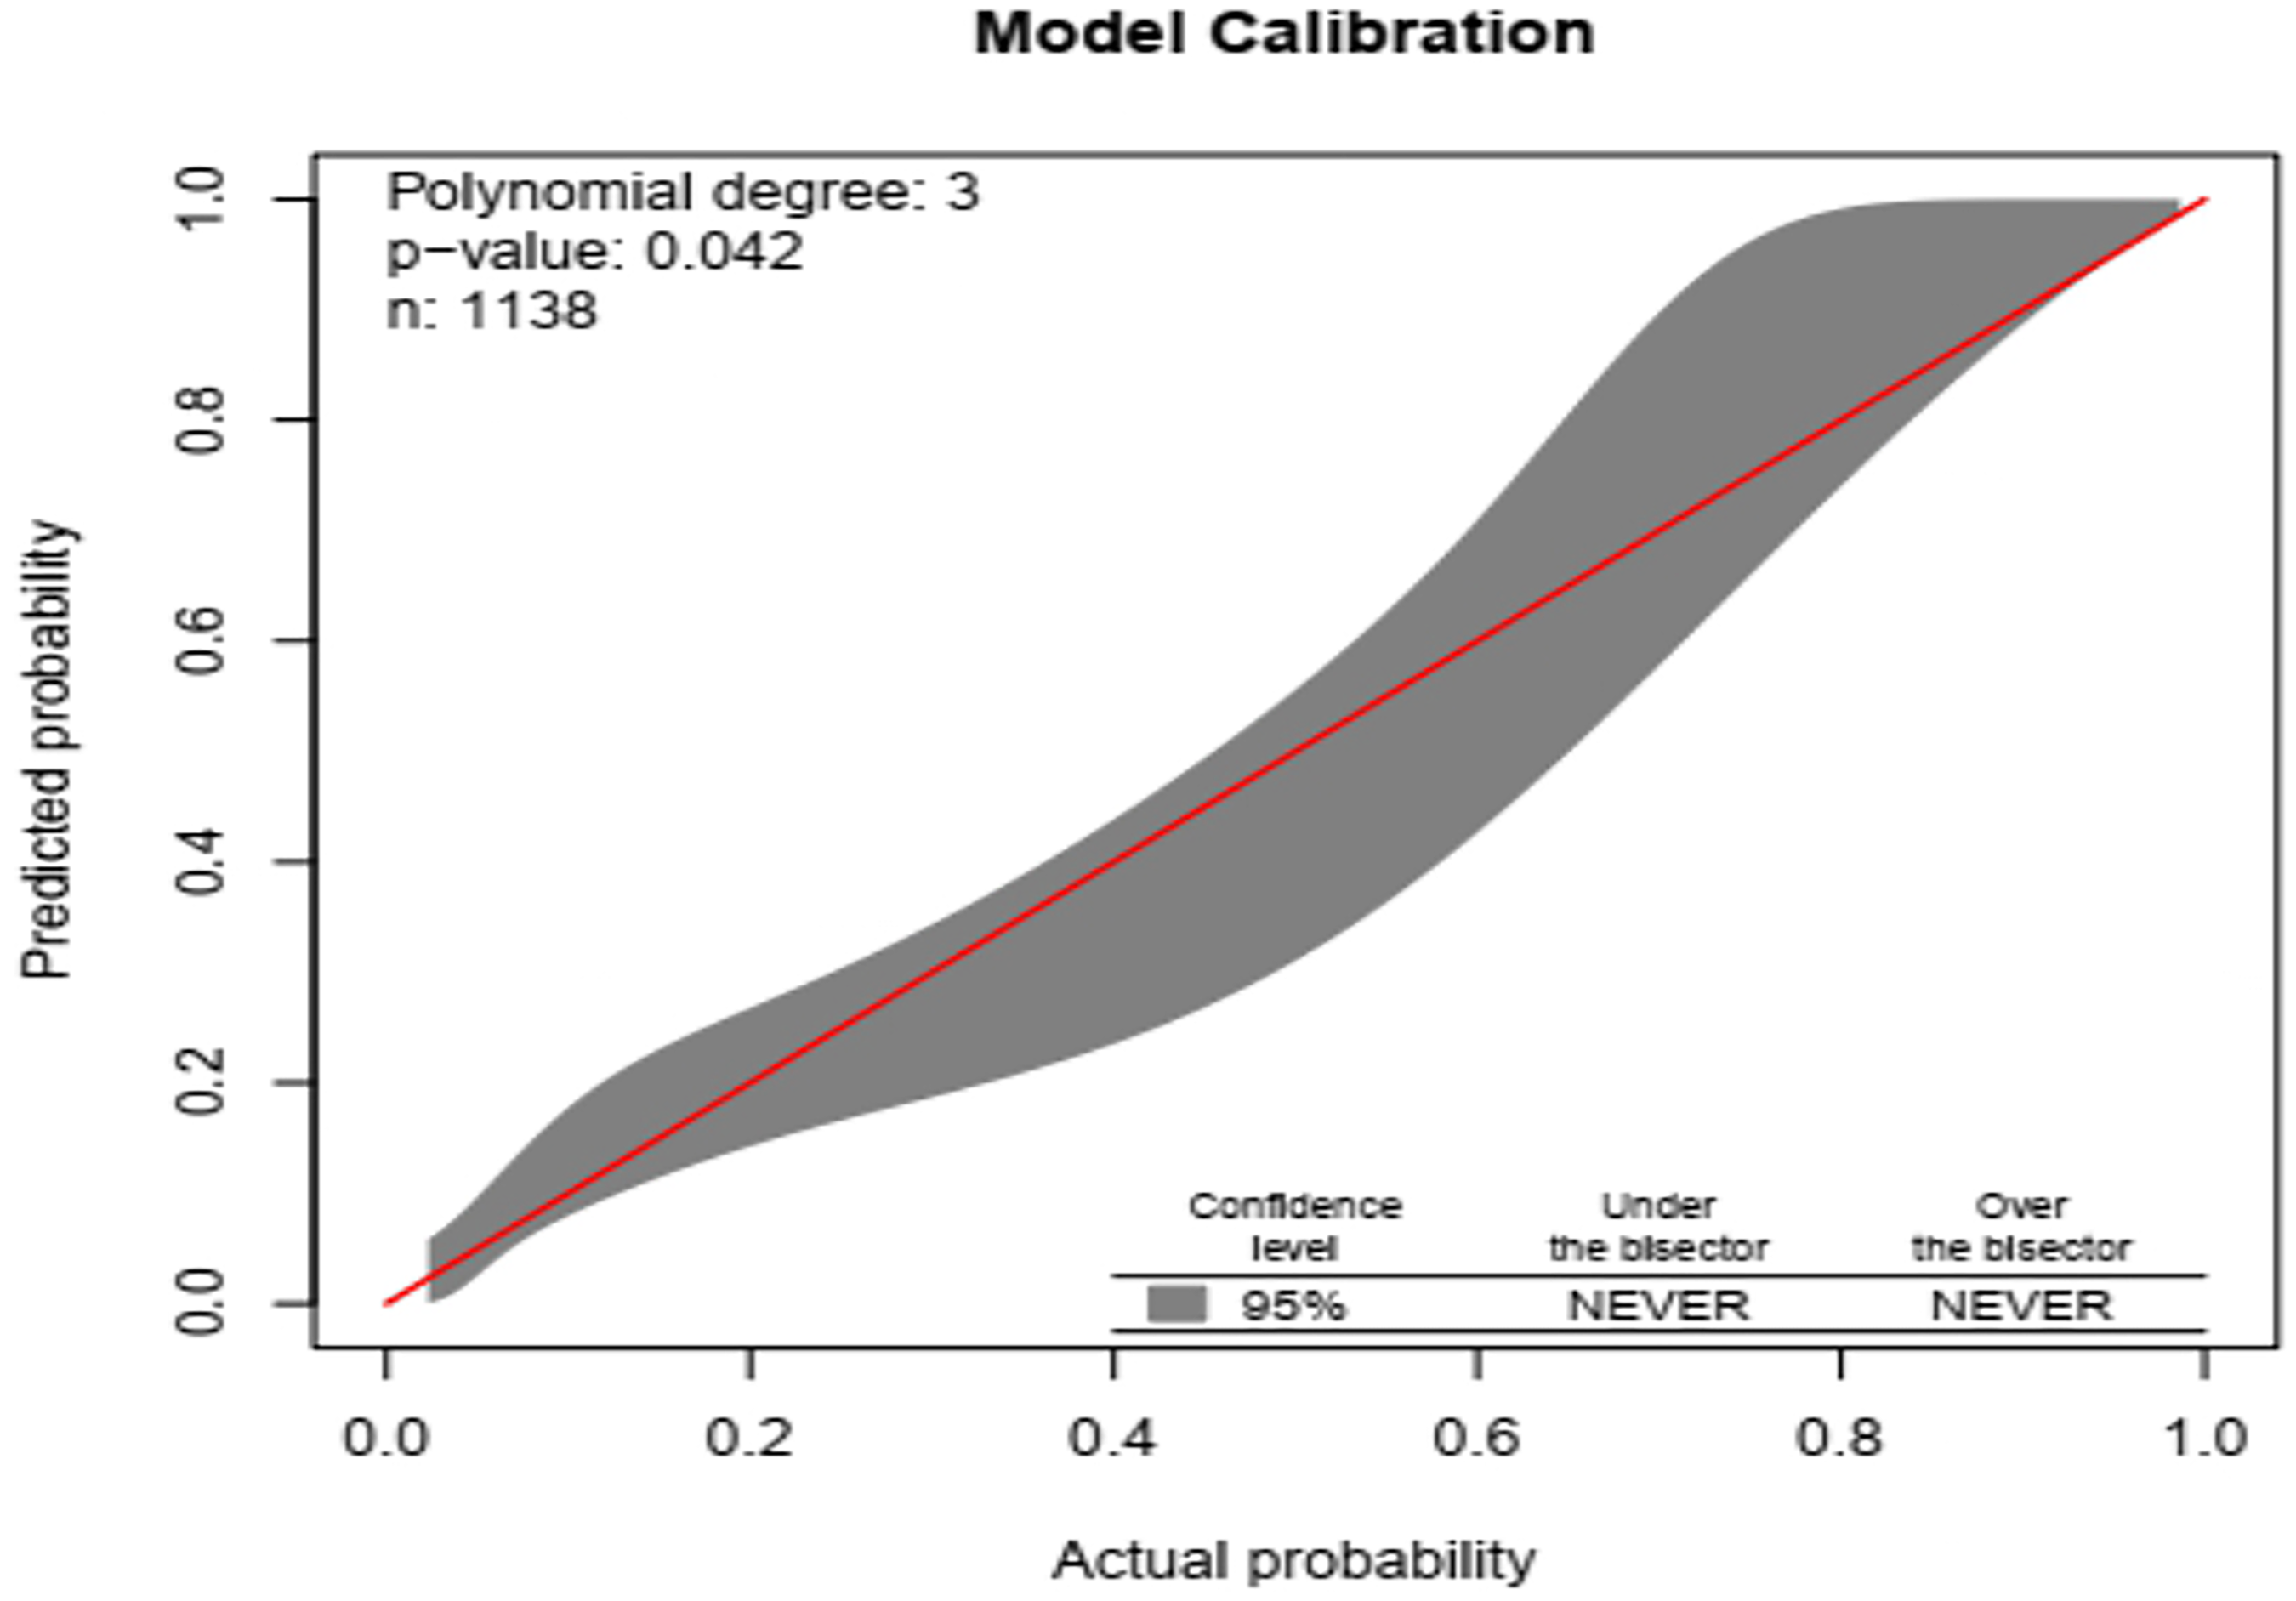
Virulologic failure risk prediction model of adult HIV patients on HAART at Felege Hiwot specialized hospital in the Amara region, 2017-2024 (n = 1138): comparison between observed and predicted.
The original model's accuracy was 0.8418 (15.82% misclassification rate) with a sensitivity of 0.378, specificity of 0.959, positive predictive value (PPV) of 0.701, and negative predictive value (NPV) of 0.858, all while using the default 0.5 cutoff probability. Accuracy was 0.839 (95% CI: 0.816-0.860), sensitivity was 0.408, specificity was 0.959, PPV was 0.666, and NPV was 0.863 at the ideal threshold (Youden index = 0.4753) (Figure 5).

Virologic failure risk prediction model with optimal cut-off point (Youden index) for adult HIV patients on HAART at Felege Hiwot specialized hospital in the Amara region, 2017-2024 (n = 1138).
The created nomogram categorized patients with virologic failure as “1” and those without as “0,” as shown in the prediction density plot. According to the simplified multivariable model, virologic failure occurred in 20.2% of individuals. In the plot, the red curve represents patients on HAART with a low risk of virologic failure, while the blue curve represents those at high risk. Some overlap between groups was observed at certain threshold probabilities, reflecting that no model achieves perfect classification. Overall, the plot provides a visual summary of the nomogram's predictive distribution (Figure 6).
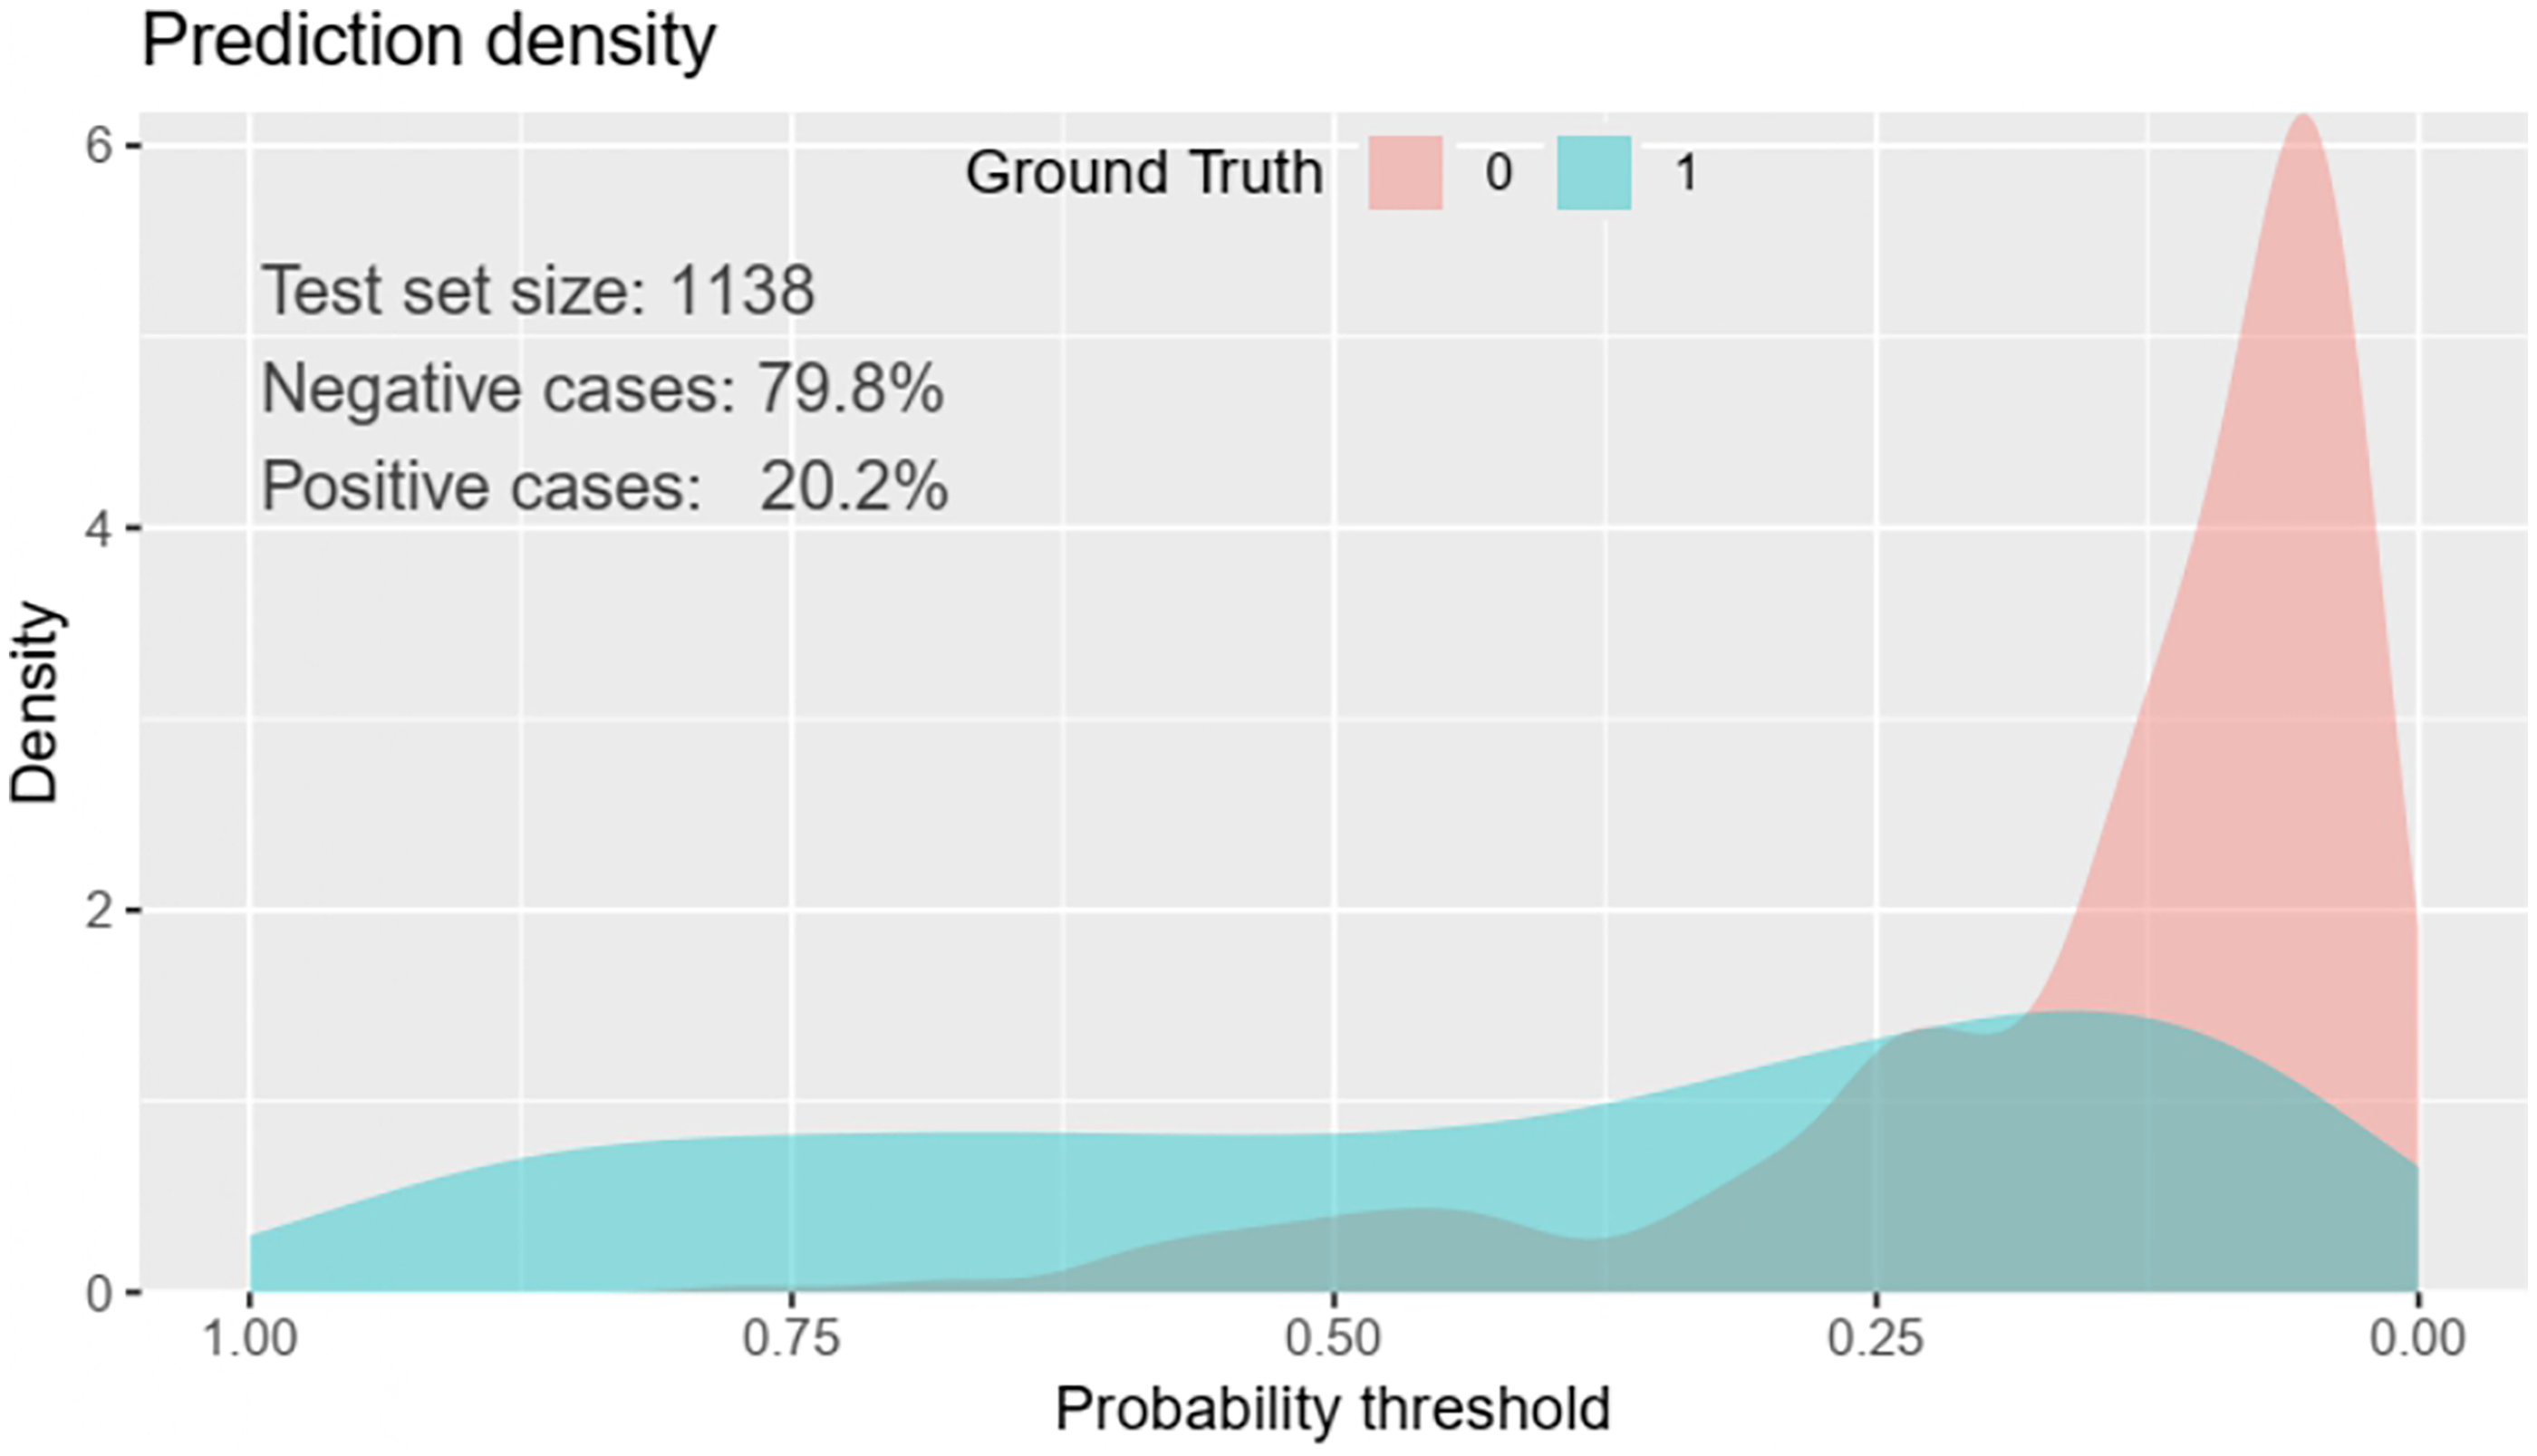
Predictive density plot of the virologic failure risk prediction model for adult HIV patients receiving HAART at Felege Hiwot specialized hospital in the Amara region, 2017-2024 (n = 1138).
Validation of Model
To lessen over fitting and over optimism, the model was internally validated using the bootstrapping approach with 1000 resamples (via the “mrs” package). With a corrected discriminating power of AUC = 0.810, the validated model closely matched the original model. The bootstrap analysis's β coefficients were almost the same as the initial estimates, and the optimism coefficient was low (0.014), suggesting that there was little chance of overfitting. With only a small variation between 0.3 and 0.6 probability ranges, the calibration plot demonstrated excellent agreement between the projected and actual probabilities. All things considered, the model showed outstanding calibration and is probably going to function well on external datasets (Figure 7).

Virologic failure risk prediction model calibration model following bootstrap for adult HIV patients on HAART at Felege Hiwot specialized hospital in the Amara region, 2017-2024 (n = 1138).
Based on the determined predictors of verified regression coefficients, the estimated likelihood of risk for virologic failure can be used to forecast an individual's estimated risk for virologic failure in adult HIV patients on first-line HAART. = 1/1 + exp−(−3.752 + 1.090) * Co-infection of TB and HIV (Yes) + 0.602 * History of adverse reaction (Yes) + (0.817) * CPT (No) + (0.947) * INH prophylaxis (No) * Status of disclosure (No) + 1.957 * Yes, alcohol + (1.662) * Condition of IV smoking (Yes) + (0.474) * CD4 (<200).
Analysis of Decision Curves
In terms of the choice to employ our model, the decision curve performs better over the whole range of threshold probabilities than the default strategies (referencing all and none). The thick black line indicates that none of the patients are at risk of virologic failure, the thin black line indicates that all patients are at danger of virologic failure, and the purple line reflects the produced risk prediction nomogram.
The net benefit was determined by deducting the percentage of false positives from the percentage of genuine positives, weighted by the relative damage of not taking an intervention versus the detrimental effects of needless intervention. (pt/(1−pt)) was the formula used to determine the relative harm. 31 The threshold probability, or “pt,” is the point at which the anticipated benefits of a certain intervention and avoiding it are equal. According to the DCA plot, addressing virologic failure in patients on first-line HAART by using the model to implement a specific intervention—which could be chosen based on the clinical setting—was found to have a greater net benefit than addressing all or none of the cases.
If the threshold probability is greater than 10%, the decision curve indicates that using the risk prediction nomogram developed in this study to predict virologic failure in adult patients undergoing first-line therapy is more beneficial than implementing an intervention for all or none of the patients’ strategies. This implies that the model has the greatest clinical and public health significance (Figure 8).

A decision curve diagram comparing all or none schemes illustrates the net benefit of the developed model for implementing a specific intervention approach in adult HIV patients on HAART at Felege Hiwot specialized hospital who are at risk of virologic failure.
Classification of Risk Using a Nomogram
For practical purposes, the final simplified model was presented as a nomogram. Patients are categorized as having a low or high risk of virologic failure based on the risk probability determined by the nomogram. The nomogram makes the calculation of the risk probability so easy that any health professional, regardless of level, can do it. Therefore, patients are classified as having a low or high risk of virologic failure using the cutoff (0.4753) determined by the Youden index method.
In the low-risk (<0.4753) and high-risk (≥0.4753) groups, the percentage of virologic failure was 13.6% and 66.7%, respectively. However, for ease of interpretation in clinical settings, we divided risk scores into 2 groups: low-risk (less than 19 points) and high-risk (greater than or equal to 19 points), based on the Youden index (optimal cut-off point), which in the model corresponds to the probability of 0. 4753. There were 141 (12.39%) and 997 (87.51%) study participants in high-risk and low-risk categories, respectively (Table 4).
Risk Assessment of Adult HIV Patients on First-Line HAART for Virologic Failure Using a Simple Prediction Score.

Discussions
This study aimed to validate a risk prediction nomogram for detecting virologic failure among patients on first-line HAART. The nomogram incorporated clinically relevant and routinely available variables in HIV care and demonstrated strong predictive performance. Its use can help clinicians identify high-risk patients early, enabling timely interventions and improved treatment outcomes. This approach supports evidence-based decision-making and personalized HIV care.
The study found that 20.21% of adult HIV-positive patients receiving first-line HAART experienced virologic failure, which is defined as a retroviral load greater than 1000 copies/mL [95% CI: 17.9%, 22.6%]. This suggests that the study population is heavily burdened. This result emphasizes how difficult it is still to achieve long-term viral suppression even with the expansion of ART services in this research region. The observed incidence is in line with Addis Ababa, Ethiopia, 19.8%, 32 Tanzania 19%. 33 The results, however, were less than those of other studies in Mozambique (24.4%), Canada (37.1%), Vietnam (23%), Saudi Arabia (23.8%), Peru (24%), Southwest Ethiopia (25.1%), and Eastern Ethiopia (22.7%).34-41 However, several earlier studies found far lower failure rates: Zambia 11%, India 16.5%, China 11.8%, Southern Ethiopia 11.1%, Northwest Ethiopia 14.7%, and Northern Ethiopia 11.5%.42-47 Differences in the definition of virologic failure, study design, inclusion criteria, study period, and study setting are the causes of the discrepancy. A few studies set a cutoff value for virologic failure at 400 or 5000 copies/mL.38,47,48
A multivariable risk prediction nomogram was developed and internally verified to forecast virologic failure in patients on first-line HAART. The primary goal was to create a practical tool that would help health care providers improve HIV management, especially in nations with high HIV loads. Model predictors were selected using the LASSO approach, a penalized regression technique, according to their relationship to the outcome variable. This technique allowed for the creation of a robust and economical model by reducing the number of possible predictors from 14 to 12. Using multivariable regression, these factors were further examined and progressively eliminated according to their significance level (P < .05).
The final, simplified model, shown as a nomogram, included 8 distinct predictors of virologic failure: disclosure status, alcohol drinking status, smoking status, CD4 level, history of adverse reaction, INH prophylaxis, TB-HIV co-infection, and CPT. Similar to a study that found TB-HIV co-infection was a contributing factor to virologic failure in Addis Ababa, this study examined whether TB-HIV co-infection is a primary predictor of virologic failure. 6 This may be due to the drug–drug interaction if anti-retroviral drugs and anti-TB drugs are taken concurrently, which will lead to virologic failure. Another study conducted in north-west Ethiopia demonstrated that clients who did not disclose their HIV status as a contributing factor for virologic failure. 19 Viral replication and CD4+ T-cell numbers have been shown to be inversely correlated in a number of prior investigations. Reduced CD4+ T-cell counts are associated with increased vulnerability to virologic failure, which increases the probability and frequency of opportunistic infections and, in turn, promotes disease progression and higher death rates.36,49
A machine learning study conducted at the University of Gondar to predict virologic failure in HIV patients receiving antiretroviral medication also found that low CD4 counts and not taking CPT were predictors of virologic failure. 22 Low CD4 count was also found to be a predictor variable in another Wuhan, China, prediction study. This study's area under the curve (AUC) for validation was 0.80. 50
This model's good calibration and strong predictive performance (AUC of 0.817) showed that predicted probability closely matched observed results. At a cut-off value of 0.4753, as determined by the Youden index, the model's reliability was validated internally using bootstrap resampling (1000 iterations), yielding acceptable levels of specificity, sensitivity, PPV, and NPV. Clinicians can modify the risk threshold to favor specificity or sensitivity depending on the clinical context and available resources thanks to this predictive model's flexibility. Using a bootstrapping technique, internal validation was carried out by training the model on resampled datasets and comparing it to the original sample. The model's expected optimism is represented by the discrepancy between the verified performance in the original dataset and the perceived performance in the training (derivation) dataset. The model has good generalizability and is not unduly reliant on the particulars of the development dataset, as indicated by its optimism coefficient of 0.014, which also shows little over-fitting.
DCA compares the benefits of the prediction model to conventional treat-all or treat-none approaches. DCA provides information that goes beyond traditional performance indicators like calibration and discrimination. The analysis demonstrated that when patient threshold probabilities surpass 10%, the nomogram provides a higher net benefit. For example, employing the nomogram to make intervention decisions has a net benefit of about 0.055 at a personal threshold probability of 50%. Accordingly, 5.5 additional true positives per 100 patients would be obtained if the model were used to inform intervention choices at this level, all without increasing the number of needless therapies. Nevertheless, its efficacy diminishes for threshold probabilities below 10%, suggesting diminished usefulness in those situations. In order to help doctors, determine whether to apply the nomogram for patients at risk of virologic failure, threshold probabilities are essential in DCA. This approach helps medical professionals make well-informed choices, maximizing the use of resources and improving patient care by concentrating on those who are most likely to gain from focused interventions. In clinical practice, the nomogram is often a useful tool that enhances decision-making when managing HIV patients on first-line HAART.
Clinicians at all levels can utilize the created risk prediction model for predicting virologic failure in patients with HIV on first-line HAART since it is simple to apply and depends on readily available factors. Without the need for intricate mathematical computations, it enables medical professionals to classify individuals as higher or lower risk and evaluate the risk of virologic failure. The dependability of the model is increased by its clinical interpretability and DCA validation. This prognostic model is especially pertinent to local healthcare contexts because it is the first to focus on virologic failure among HIV patients receiving first-line HAART in the Amhara region of Ethiopia.
Healthcare providers can use this nomogram to help them tailor care and treatment for HIV patients receiving first-line HAART. Additionally, it encourages increased research and innovation to hasten the creation and application of new medical instruments. The high rates of virologic failure in HIV patients on first-line HAART can also be addressed by policymakers and program managers using this approach to create customized, patient-specific policies and programs. The nomogram has the potential to greatly enhance patient care and results in the area by offering an organized method of decision-making.
Strengths and Limitations of the Study
Strengths of the Study
This study focused on the validation of a risk prediction nomogram developed to identify patients at increased risk of virologic failure while receiving first-line HAART. The model demonstrated good discriminatory power and calibration, suggesting its potential utility in routine HIV care. One of the strengths of this study is its relatively large sample size, which enhances the statistical power and generalizability of the findings. In addition, the use of internal validation through bootstrapping minimized the risk of overfitting and provided a more accurate estimate of model performance. The inclusion of readily available clinical and demographic variables further strengthens the practical applicability of the nomogram in resource-limited settings, where advanced prognostics may be constrained.
Limitation of the Study
Despite its strengths, this study has some limitations that should be considered. First, the study used data from a single geographic region, which may limit the generalizability of the nomogram to other populations with different clinical or demographic characteristics. Second, due to the retrospective nature of the data, some potentially important predictors, such as income level was not included.
Conclusion
A nomogram was created based on 8 important predictors, including TB-HIV co-infection, INH prophylaxis, CPT, history of adverse reaction, disclosure status, alcohol, smoking status, and CD4. The study's overall incidence of virologic failure was 20.21% [95% CI: 17.9%, 22.6%]. With a Brier score of 0.117 and projected probabilities that closely matched observed results on the calibration plot, the final model showed high calibration and excellent discriminative performance (AUC of 0.817).
Recommendation
For Clinicians
After external validation this tool can be implemented in routine clinical practice to enable early identification of high-risk patients, facilitating timely and personalized interventions that can prevent treatment failure and improve overall outcomes. The nomogram can also support clinical decision-making by integrating it into electronic medical records or decision-support systems to assist clinicians in making evidence-based, data-driven decisions that align with both individual care and broader public health strategies.
Policy Makers and Program Planners
Before applying the nomogram should go under external validation to ensure its reliability across different settings. After validation, policymakers and program managers are highly recommended to integrate it into national HIV management strategies, as it offers a robust tool for risk stratification, effective program monitoring, and evaluation.
Resource Allocators
After ensuring its external validity, apply the model in settings with limited resources to prioritize care for patients most in need, thereby improving the cost-effectiveness of HIV programs and ensuring equity in care distribution.
For Other Researchers
Other researchers are encouraged to externally validate the nomogram in diverse populations and healthcare settings to assess its generalizability, calibration, and discrimination performance.
Supplemental Material
sj-docx-1-jia-10.1177_23259582261428509 - Supplemental material for Validation of a Risk Prediction Nomogram for Virologic Failure Among Patients on First-Line ART After ONE-J Program Implementation in Northwest Ethiopia
Supplemental material, sj-docx-1-jia-10.1177_23259582261428509 for Validation of a Risk Prediction Nomogram for Virologic Failure Among Patients on First-Line ART After ONE-J Program Implementation in Northwest Ethiopia by Bekalu Bewket, Etsubdink Dessalew Abawa and Zelalem Alamrew Anteneh in Journal of the International Association of Providers of AIDS Care (JIAPAC)
Footnotes
Acknowledgment
We acknowledge Bahir Dar University for offering us ethical approval to commence our study, and the authors are grateful to the FHCSH that granted permission to conduct this study, the data collectors, and the supervisors of the study. Finally, our special gratitude goes to healthcare providers at the ART unit of Felege Hiwot Specialized and Comprehensive Hospital who participated in the data collection process.
Ethical Consideration
The Bahir Dar University Ethical Review Committee granted ethical clearance under protocol number BDU/CMHS/1087/202. Letters were written from Bahir Dar University to the hospital for a corporation. Permission letters were granted from the hospital administrative office to conduct the study on the grounds. Written informed consent was obtained from all individual participants included in the study. Identification numbers were used in place of participant names to prevent potential identifiers and maintain data confidentiality.
Author Contributions
BB: conceptualized the study, designed the study, performed data analysis, interpreted the findings, and drafted the manuscript. EDA: manuscript preparation, thesis write up and data analysis. ZAA: supervise the study, perform data analysis, and critically review the manuscript. All the authors read and approved the final version of the manuscript.
Funding
The authors received no financial support for the research, authorship, and/or publication of this article.
Declaration of Conflicting Interests
The authors declared no potential conflicts of interest with respect to the research, authorship, and/or publication of this article.
Supplemental Material
Supplemental material for this article is available online.
References
Supplementary Material
Please find the following supplemental material available below.
For Open Access articles published under a Creative Commons License, all supplemental material carries the same license as the article it is associated with.
For non-Open Access articles published, all supplemental material carries a non-exclusive license, and permission requests for re-use of supplemental material or any part of supplemental material shall be sent directly to the copyright owner as specified in the copyright notice associated with the article.