
Abstract
This study aimed to assess second-line antiretroviral therapy (ART) outcomes in a National HIV Treatment program. People living with HIV aged ≥18 years initiating first-line ART who switched to second-line protease inhibitor-based regimens from January 2008 to May 2019, with a minimum of 1-year follow-up were studied. The primary outcome was second-line treatment failure (two consecutive virological failure episodes (viral load ≥1000 copies/mL)). Of 318,506 PLH initiating ART, 29,015 (9.1%) switched to second-line regimens after a median (IQR) ART duration of 1.63 (0.60-3.59) years. Lost to follow-up (LTFU) occurred in 5316 (18.3%) of whom 1376 (5%) remained LTFU and alive; 4606 (15.9%) died. Cumulative second-line failure incidence was 9.8% at 6 years, more common in females, younger PLH those with lower switch CD4 cell counts. Multidisciplinary, innovative support systems are needed to improve second-line treatment outcomes, particularly those relating to modifiable risk factors.
Plain Language Summary
We assessed the rates of virological failure, losses to follow-up and death in 29,015 people who switched to second line antiretroviral therapy in Thailand. The cumulative rate of virological failure was a 9.8% at 6 years, loss to follow-up occurred in 18.3% (5% who remained alive) and 15.9% died. Women and those with lower CD4 counts at switch had the highest risk of virological failure.
Keywords
Introduction
National treatment programs for HIV are a cost-effective health investment in settings with limited resources, 1 and life expectancy of people living with HIV (PLHIV) has substantially increased with rollout of effective of combination antiretroviral therapy (ART).2–4 However, PLHIV initiating first-line ART with drug intolerance, transmitted drug resistance or poor adherence leading to treatment failure, require a switch to a second-line regimen. Before 2018, the World Health Organization (WHO) recommended first-line ART regimen was a non-nucleoside reverse-transcriptase inhibitor (NNRTI) plus 2 nucleoside reverse transcriptase inhibitors (NRTIs). After first-line regimen failure, a boosted protease inhibitor (PI) plus 2 NRTIs was recommended as second-line ART. 3 In 2018, WHO recommendations changed to recommend dolutegravir (DTG) in combination with 2NRTIs as a preferred first-line combination, and suggested DTG plus 2NRTIs as a preferred second-line regimen in those failing non-DTG-based first line regimens. 5 For reasons including availability and cost, uptake of WHO recommendations on DTG were delayed in many settings. For example, Thai National treatment guidelines were updated to be consistent with WHO recommendations in 2022. 6 Therefore, until recently, most PLHIV in lower and middle-income countries (LMIC) who needed to switch from first-line regimens would be switched from NNRTI-based to PI-based ART.7,8
WHO estimated the proportion of adults receiving second-line therapy in low- and middle-income countries in 2021 to be 6.0%. 9 Switching to second-line therapy most commonly occurs due to virological failure (VF), although switches are made for other reasons including intolerance or pregnancy. A recent study reported that 13% of Asian patients failing NNRTI-based ART switched to second-line regimens after a median of 9 years. 8 In the same research network, the VF rate in 1378 patients who failed first-line ART was 7.3%, after a median second-line duration of 3 years. 10 However, data documenting second-line treatment outcomes in a National treatment program in Asia have not been reported. We aimed to describe the history and treatment outcomes of PLHIV who initiated first-line ART and switched to second-line ART according to treatment guideline recommendations, in the Thai National AIDS Program (NAP).
Methods
Study Design, Setting, and Sample
The NAP has offered free treatment and care to Thai PLHIV since 2007. 11 The NAP database is administered by the National Health Security Office (NHSO), who provided datasets for this analysis. Treatment sites across the country record patient information (clinical information, laboratory test results, and ART dispensing records) at all clinic visits after registration, as a mechanism reimbursement to individual hospitals for services provided. CD4 cell count tests are provided every 6 months. HIV-RNA is measured 6 months after starting ART and annually thereafter; once CD4 counts are >350 cells/mm3 and HIV RNA <50 copies/mL on 2 consecutive occasions, CD4 monitoring is not required. 11 ART are provided based on National HIV treatment guidelines. The database is linked with the National Death Registry and updated in real time.
Study Population
This analysis included PLHIV aged ≥18 years, who initiated first-line NNRTI-based ART through the NAP, from January 2008 to May 2019. At least 1-year of follow-up to May 2020 was available. PLHIV were considered lost to follow-up (LTFU) if they had no clinic contact for more than 1 year from their last visit, and can be distinguished from mortality by death registry linkage. 12
Definitions and Outcomes
First-line and second-line regimens were defined according to National treatment guidelines. Switching to a second-line regimen was defined as changing to a PI-based regimen after at least 6 months treatment on an NNRTI-based regimen. VF was viral load (VL) ≥ 1000 copies/mL; patients were considered as failing second-line treatment after 2 consecutive VF episodes. The reason for second-line switch was classified as VF if there was a confirmed episode of VF on first-line therapy, and clinical failure if switch occurred with no VL but CD4 count was <200 cells/mm3. CD4 cell count at ART start or second-line switch was taken as the closest result within a window 12 months before, and up to 1 month after ART initiation or switch.
Statistical Analysis
Patient characteristics, including demographics and HIV disease and treatment characteristics were summarized using descriptive statistics by first-line and second-line regimens. Characteristics at second-line switch and outcomes after switch were summarized by the number of VL tests above 1000 copies/mL: no VL results (patient recently switched to second-line therapy and not eligible for VL assessment, or early LTFU), VL always <1000 copies/mL at every test after switch, and 1, 2, or >2 VF episodes after switching. Competing risk models were used to assess factors associated with second-line regimen failure in those who had at least 2 VL tests: death and LTFU were considered as competing events. Incidence rate ratios (IRR) for any episode of VF and patient characteristics at second-line switch were analyzed using a Poisson generalized estimating equation. Cox regression was used to assess factors associated with death after switch. Patients who did not die were censored at their most recent clinic visit. Covariates assessed in these models included age, gender, period of second-line regimen initiation, second-line regimen, active opportunistic infections (OI) at second-line switch, country region, CD4 cell count, VL (when it was not the outcome variable) and geographic region within Thailand. These regions were classified as Bangkok, and 6 other regions, consistent with groupings used by government organizations. Across these regions there are regional variations in culture and socio-economic disparities. Multivariable models adjusted for covariates with P < .10 in univariable models. Analysis was performed with Stata version 17 (StataCorp LLC, College Station, TX) and SAS version 9.4 (SAS Institute Inc, Cary, NC).
Ethical Approval and Informed Consent
This study was approved by the Institutional Review Board (IRB) of the Institute for Development of Human Research Protection, Ministry of Public Health, Thailand (No. 589/2554). A waiver of consent was granted for this retrospective cohort study, and all data were deidentified by the NHSO before analysis.
Results
Study Population
From January 2008 to May 2019, 350,108 patients enrolled to the NAP, and 318,506 started NNRTI based ART. PLHIV were excluded if they commenced ART with mono/dual therapy or a combination of NNRTIs and PIs (n = 24,586, 7%), were aged <18 years (n = 7,006, 2%), or if sex was not recorded (n = 10). Study flow from registration to second-line switch is shown in Figure 1.
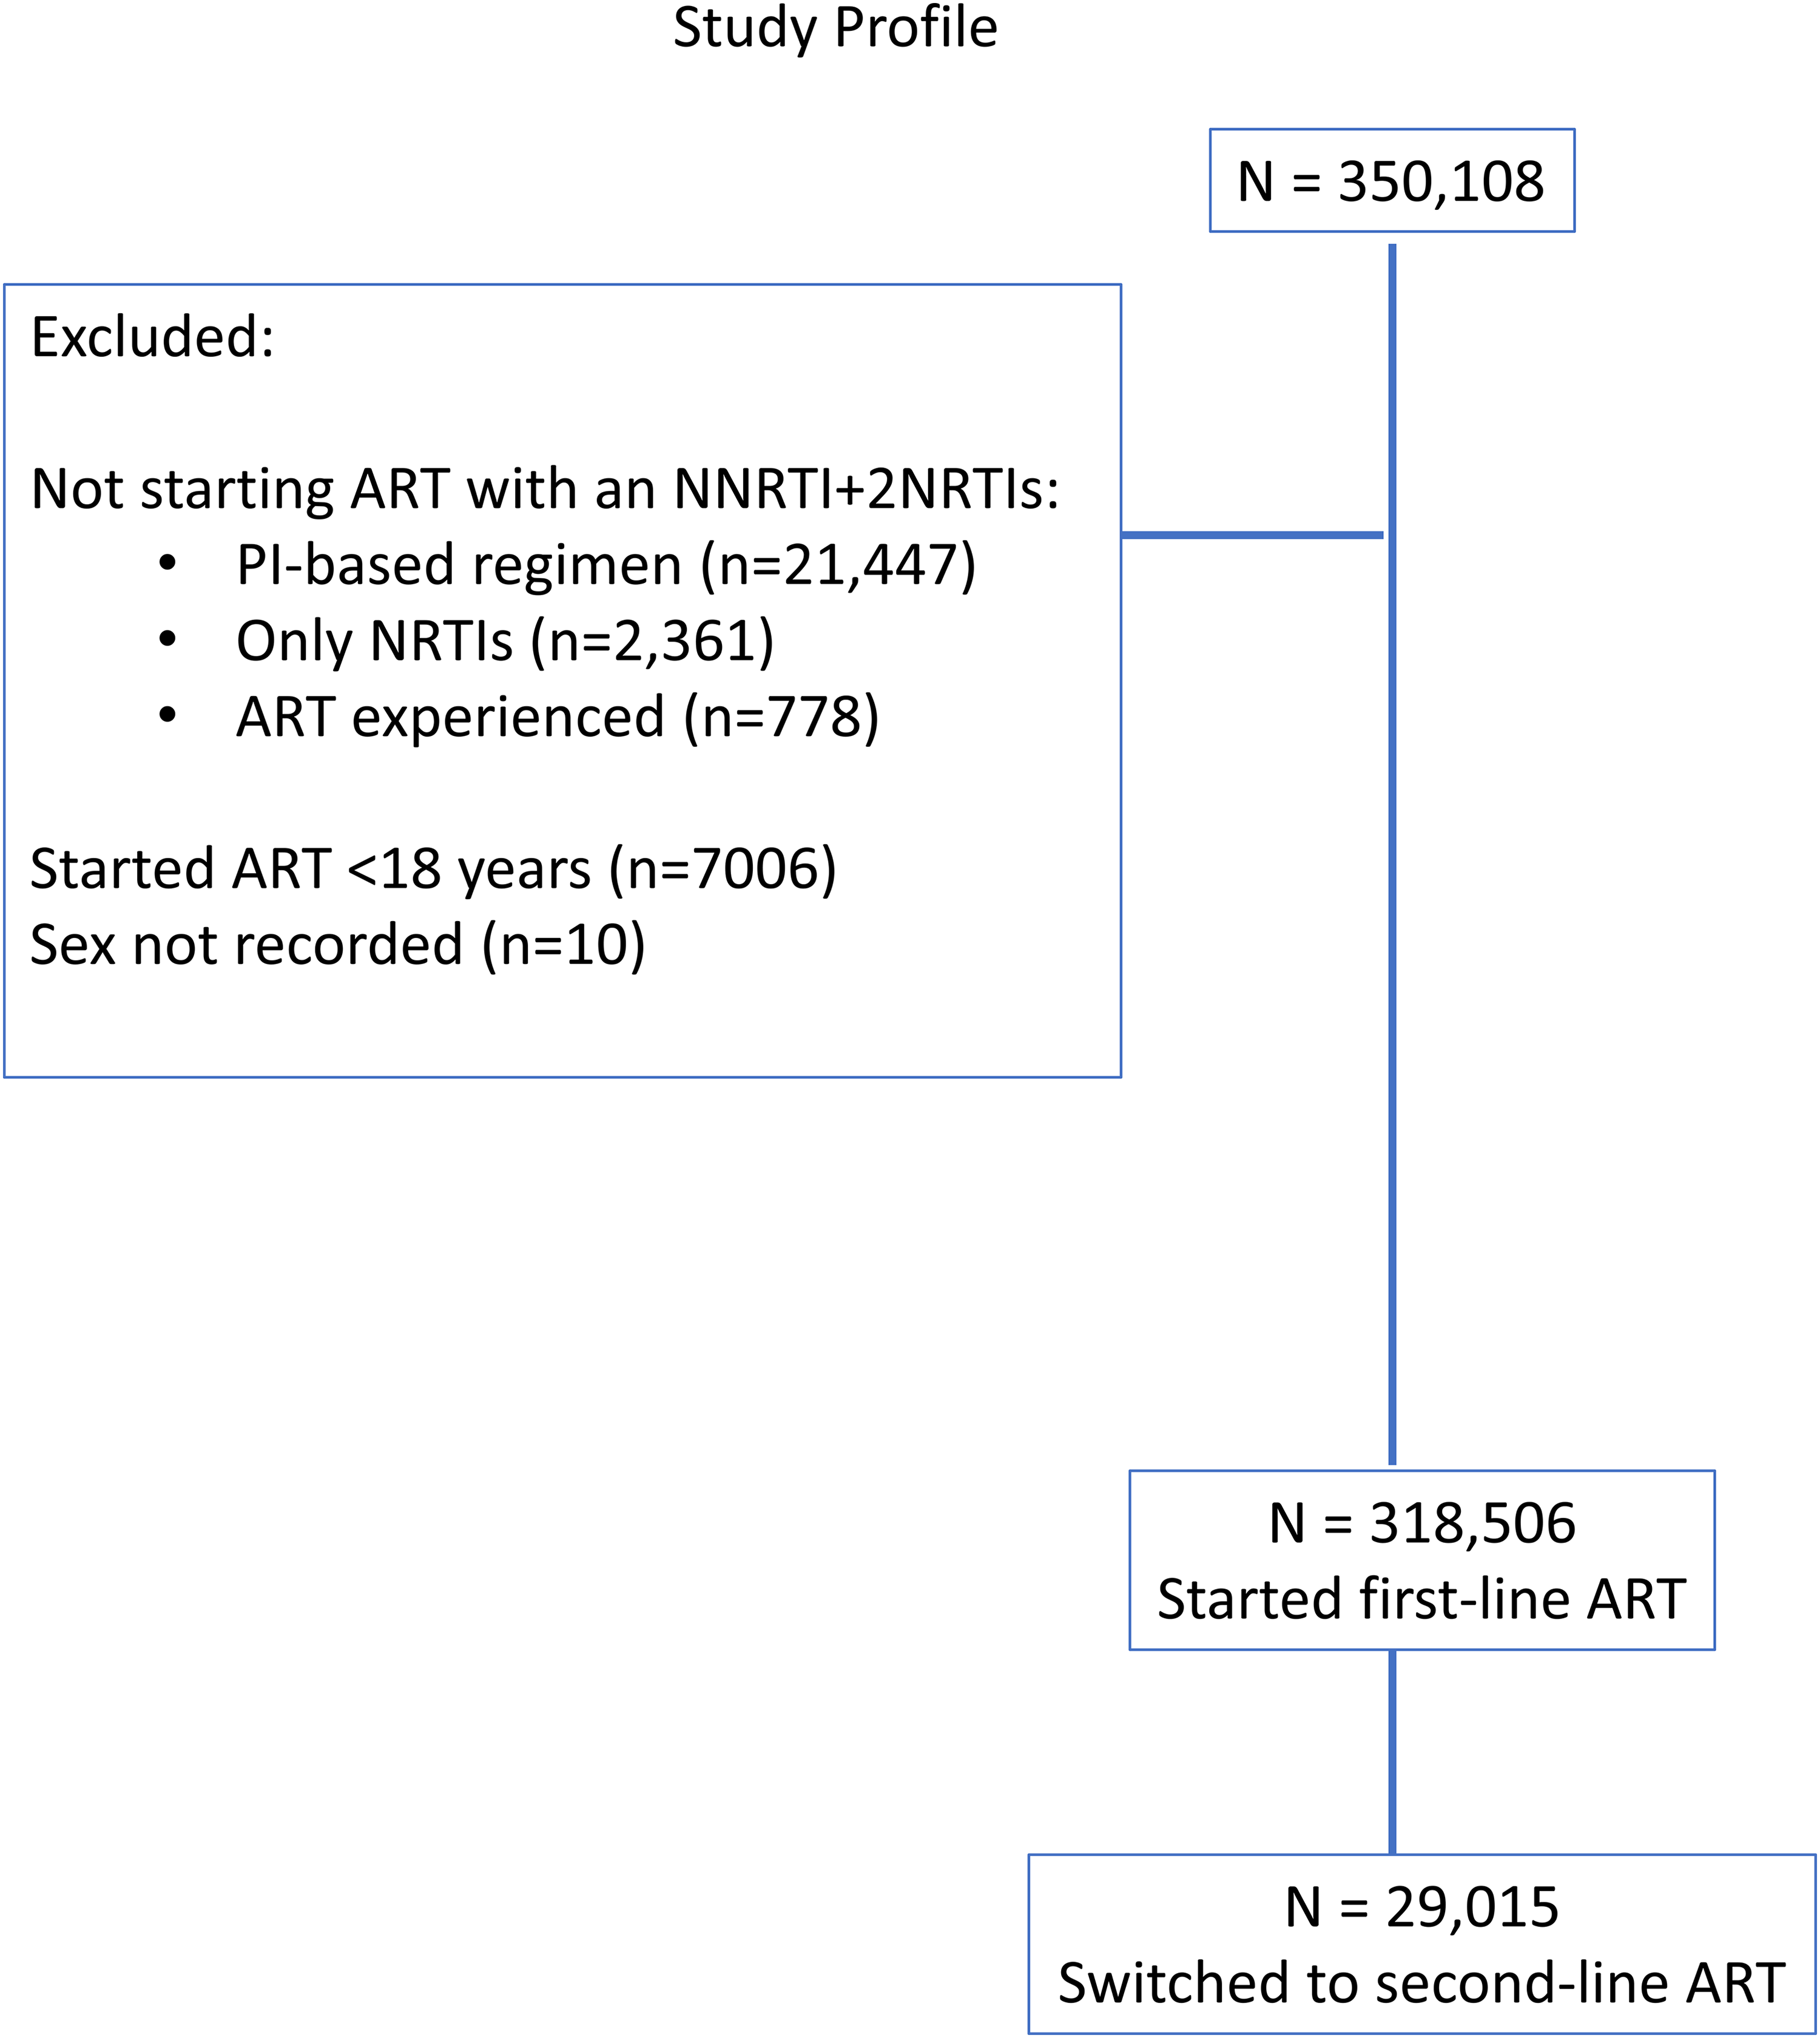
Study profile.
The median age at first-line NNRI-based ART initiation was 37 (IQR 29-44) years and 202,617 (64%) were male. NNRTIs used in the first regimen were efavirenz (EFV) (62%), nevirapine (NPV) (37%), and rilpivirine (RPV) (1%) and the most frequent backbone was 3TC/d4T (35%). The highest proportion were from North-eastern Thailand and 42,203 (13%) had OI at ART start. Median CD4 cell count in 231,343 (73%) with a measurement at first-line ART initiation was 135 (IQR 39-301) cells/mm3. One year after ART initiation, 184,445 (58%) had a VL measurement, and 150,052/184,455 (81%) were suppressed at <50 copies/mL. Median first-line ART follow-up duration was 3.9 (IQR 1.3-7.2) years, and over the study period, 40,996 (12.9%) PLHIV on first-line ART died and 54,998 (17.3%) were LTFU (Table 1).
Characteristics of PLHIV at First-Line ART Initiation.

Abbreviations: ART, antiretroviral therapy; IQR, interquartile range; EFV, efavirenz; NVP, nevirapine; PLHIV, people living with HIV; RVP, rilpirivine; VF, virological failure; VL, viral load; 95% CI, 95% confidence interval.
After at least 6 months on an NNRTI-based regimen, 29,015 (9.1%) PLHIV switched to second-line ART. Reasons for switching were VF/drug resistance (n = 16,343; 56.3%), clinical failure (n = 6926; 23.8%), adverse effects (3989; 13.7%), physician decision (n = 117), and 1640 (5.7%), of whom 737/1640 (45%) were women, had no recorded reason for switching. Median age at switching was 37 (IQR 31-44) years, 61% were male and 1735 (6%) had active OI. The PI started in second-line regimens was ritonavir boosted lopinavir (LPV) (95%), atazanavir (ATV) (3%), or other PIs (IDV/DRV/NFV/only RTV) (2%). At switch, 26,206 (90%) had a CD4 cell count recorded, with median of 148 (IQR 49-296) cells/mm3.
Second-Line ART Cohort Description
After commencing PI-based ART, 25,695 (89%) had at least 1 VL measurement; 3320 (11%) had no VL measurements. Of the PLHIV with VL measurements during second-line ART, 19,699 (68%) never experienced VF, 3645 (13%) had 1 VF episode, 1210 (4%) had 2 VF episodes, and 1141 (4%) had >2 VF episodes after switching. Characteristics and outcomes of people who switched to second-line ART, by the number of confirmed VF episodes are shown in Table 2. Median duration of second-line ART in the entire cohort was 3.6 (IQR 1.8-5.8) years, representing 117,022 person-years of follow-up (PYs). Twenty-one percent had at least 1 VF episode: a crude single VF rate of 7.08 (95% CI 6.90-7.26%) per 100 PY. In the first year after switch, 13,133/19,423 (51%) of people who had VL testing had levels <50 copies/mL. In people who were alive and under follow-up, 19,410/25,695 (76%) had undetectable VLs at their most recent clinic visit. In the follow-up period after second-line switch, 5316 (18.3%) PLWH were LTFU, of whom 1376 (5%) remained LTFU and alive at the end of the study period. Death occurred in a total of 4606 (15.9%) people. The group of patients who never experienced VF had substantially lower LTFU and death rates than groups who experienced 1 or more episodes of VF. The highest LTFU and mortality rates (56% and 49%, respectively), as well as the shortest follow-up (median 0.7 years) occurred in the 3320 PLHIV who never had VL testing.
Characteristics of Patients who Switched to Second-Line ART, by Pattern of Subsequent VL Assessments.
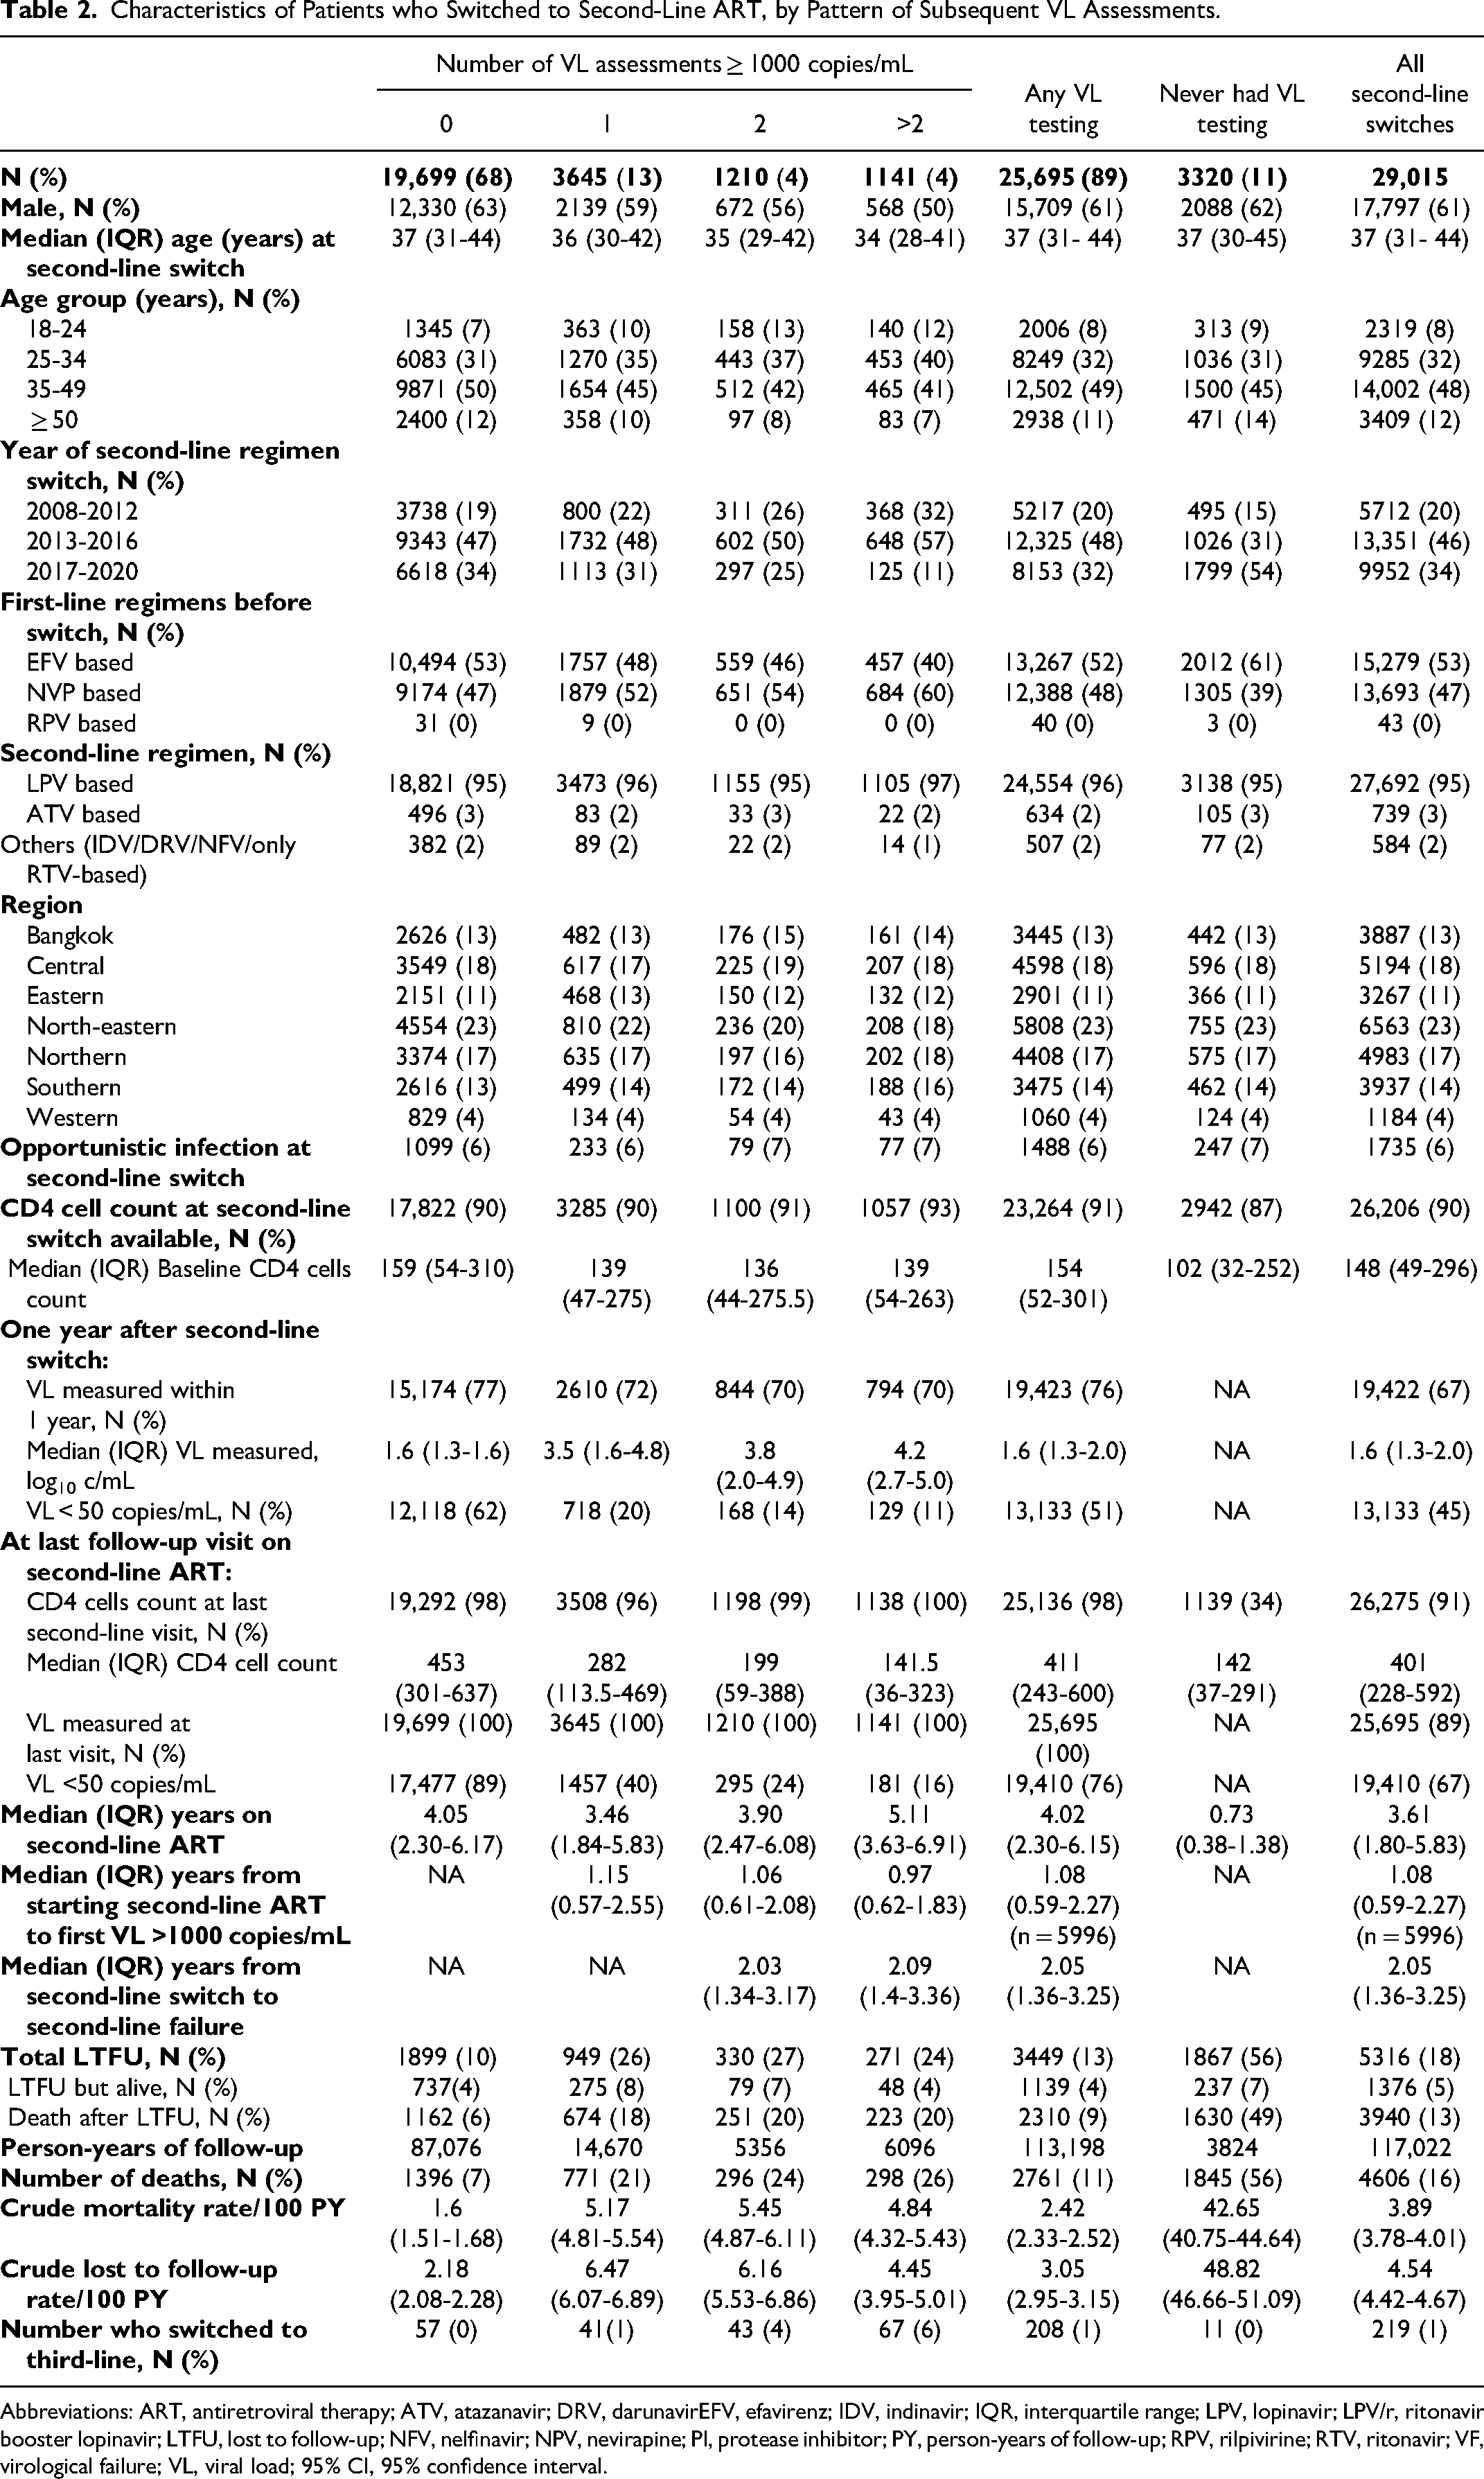
Abbreviations: ART, antiretroviral therapy; ATV, atazanavir; DRV, darunavirEFV, efavirenz; IDV, indinavir; IQR, interquartile range; LPV, lopinavir; LPV/r, ritonavir booster lopinavir; LTFU, lost to follow-up; NFV, nelfinavir; NPV, nevirapine; PI, protease inhibitor; PY, person-years of follow-up; RPV, rilpivirine; RTV, ritonavir; VF, virological failure; VL, viral load; 95% CI, 95% confidence interval.
Cumulative Incidence, and Factors Associated With Second-Line Treatment Failure, by Competing Risk Regression
A total of 2021 PLHIV had 2 consecutive episodes of VF after second-line switch: a failure rate of 1.85 (95% CI 1.77-1.93) per 100 PYs. The cumulative incidence of second-line treatment failure was 4.2% (95% CI 3.9-4.4%) at 2 years, 8.0% (95% CI 7.6-8.3%) at 4 years, and 9.8% (95% CI 9.4-10.2%) at 6 years (Figure 2). Median duration from second-line initiation to second-line failure was 2.05 (IQR 1.36-3.25) years. Switch to a third-line regimen occurred in 219 PLHIV during the study period, due to cost and stringent requirements for switching including the ability to demonstrate good adherence, and ongoing treatment supervision by a senior HIV physician. In a multivariable competing risk model (Table 3), females were 60% more likely to have second-line failure than males. PLHIV who switched at age 18 to 24 years (adjusted sub-hazard ratio [aSHR] 2.96, 95% CI 2.42-3.62) and age 25 to 34 years (aSHR 1.81, 95% CI 1.52-2.15) had a higher risk of second-line failure than those aged ≥50 years. PLHIV who started with regimens other than LPV- or ATV-based ART were less likely to experience second-line failure, although IDV was only prescribed early in the cohort to low numbers of people who subsequently switched to other regimens, and other PI use was infrequent as these drugs were not reimbursable. PLHIV with CD4 cell counts <200 cells/mm3 at second-line switch had the highest risk of second-line treatment failure (aSHR 1.48, 95% CI 1.30-1.69, compared to CD4 cell counts ≥350 cells/mm3). Although there were differences by country region in univariable models, after adjustment, the P-value for heterogeneity was longer significant, but the Northeastern region had a significantly decreased incidence of second-line failure (sHR 0.69, 95%CI 0.59-0.81) compared to Bangkok.

Cumulative incidence of second-line ART regimen failure (2 consecutive episodes of VF) and death
Factors Associated With Second-Line Failure (Two Consecutive Episodes of VL >1000 Copies/mL) After Switching to Second-Line ART, With Death and LTFU as Competing Risks.

Abbreviations: aHR, adjusted hazard ratio; ART, antiretroviral therapy; aSHR, adjusted sub-hazard ratio; ATV, atazanavir; DRV, darunavir; IDV, indinavir; LPV, lopinavir; NFV, nelfinavir; OI, opportunistic infection; PI, protease inhibitor; PLHIV, people living with HIV; RTV, ritonavir; SHR, sub-hazard ratio; VL, viral load; 95% CI, 95% confidence interval.
Incidence of VF Episodes After Second-Line Switch by Generalized Estimating Equations
In those who experienced at least 1 episode of VF, 40% subsequently re-suppressed and had VL <50 copies/mL at their last visit on second-line ART. Table 4 shows IRR for factors associated with the number of distinct episodes of VF (>1000 copies/mL) at any visit on second-line ART. In the adjusted model, the IRR were largely consistent with the results of the competing risks regression, with 1 or more episodes of VF being more frequent in younger female PLWHIV and those with lower CD4 cell counts at switch. Use of non-standard PI was associated with lower VF incidence, and the only region with a significantly different IRR to Bangkok was the North-eastern region.
Univariable and Multivariable Incidence Rate Ratios for Number of VF Episodes (HIV-RNA ≥1000 Copies/mL) During Treatment With Second-Line ART Regimen.
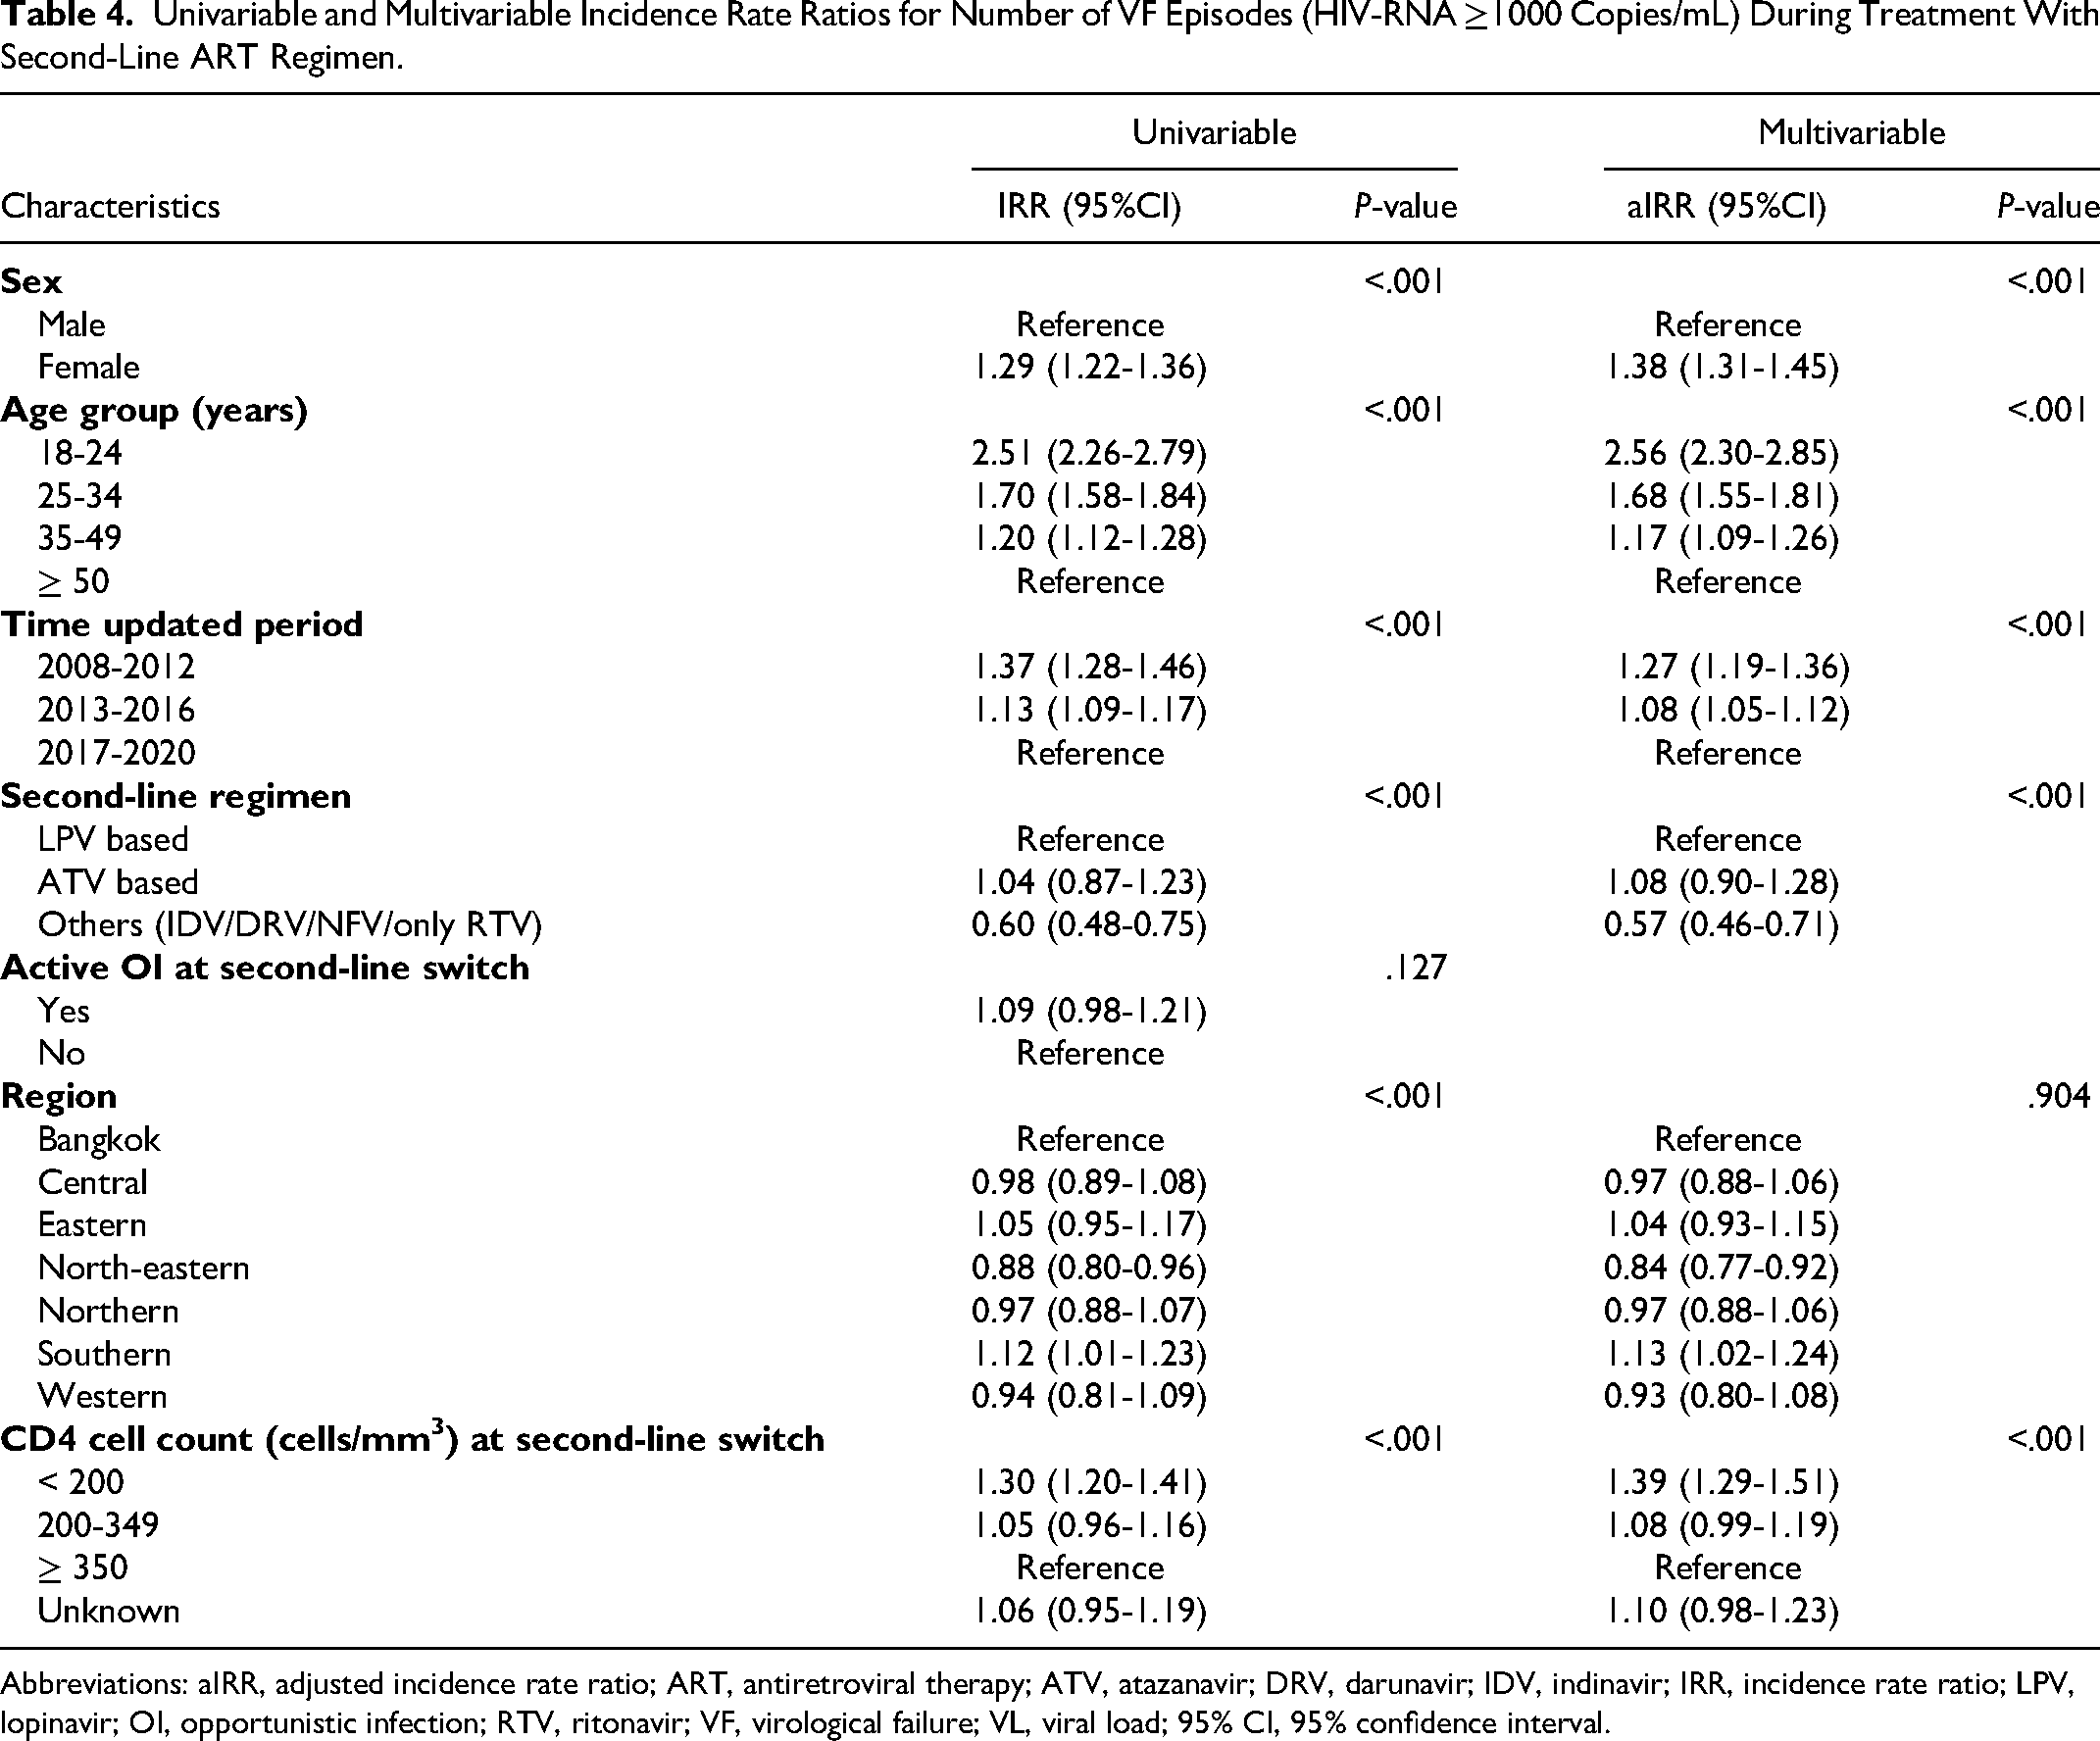
Abbreviations: aIRR, adjusted incidence rate ratio; ART, antiretroviral therapy; ATV, atazanavir; DRV, darunavir; IDV, indinavir; IRR, incidence rate ratio; LPV, lopinavir; OI, opportunistic infection; RTV, ritonavir; VF, virological failure; VL, viral load; 95% CI, 95% confidence interval.
Mortality After Switching to Second-Line ART
In adjusted Cox models (Table 5), death rates increased with age and were highest in those aged ≥50 years, those with active OI at second-line switch (adjusted hazard ratio [aHR] 1.40, 95% CI 1.27-1.55), those with CD4 cell counts <200 cells/mm3 (aHR 1.75, 95% CI 1.58-1.95 versus ≥350 cells/mm3 at swtich), those who never had VL testing (aHR 6.40, 95% CI 5.91-6.93), and those who were lost from care (aHR = 44.02, 95% CI 40.22-48.17). More pronounced regional differences by country region were apparent, with significantly higher mortality rates in the Northern, Southern, and Western regions compared to Bangkok.
Characteristics Associated With Mortality After Initiating Second-Line ART.

Abbreviations: aHR, adjusted hazard ratio; ART, antiretroviral therapy; ATV, atazanavir; DRV, darunavir; HR, hazard ratio; IDV, indinavir; LPV, lopinavir; OI, opportunistic infection; PY, person-years of follow-up; RPV, ritonavir; VL, viral load; 95% CI, 95% confidence interval.
Discussion
This is the first formal outcome evaluation of second-line ART treatment outcomes in adults receiving care through the Universal Coverage program in Thailand and reflects real-world outcomes of a large National HIV treatment program in Asia. We found 29,015 (9.1%) PLHIV switched to second-line ART, most commonly after first-line ART failure or suspected failure. At the most recent clinic visit, 76% of the cohort who were alive and had VL measurements, had VLs <50 copies/mL, with a median (IQR) follow-up of 3.6 (1.8-5.83) years on second-line ART. Eight percent of the cohort who started second-line regimens met our criteria for second-line failure of 2 consecutive episodes of VF, and the cumulative incidence adjusted for attrition as a competing risk almost doubled from 4.2% at 2 years to 8.0% by 4 years of second-line ART.
WHO recommends switching ART regimens when a second VL confirms treatment failure. Until recently, PI-based ART has been the second choice of ART regimen in many LMIC. The majority of PLHIV who switched to second-line ART in our study were taking LPV/r-based regimens. Although the second-line cohort comprised 39% of females, the failure rate after second-line switch was 60% higher in women compared to men. LPV/r has a high genetic barrier to resistance, 13 but LPV and ritonavir, have adverse effects which some people find difficult to tolerate. Women have higher plasma levels of many antiretrovirals, and reduced ritonavir clearance than men, which could make adverse effects more likely. 14 Consistent with our study findings, the ACTG A5288 strategy trial found poorer virological control at 48 weeks, higher confirmed VF rates, and more frequent reports of grade 3 and 4 symptoms in women, compared to men taking LPV/r. Resistance mutations to PIs were more common in men, suggesting non-adherence as the mechanism for VF in women. 15 This hypothesis was supported by an A5288 adherence sub-study that measured PI concentrations in hair, and found sex-related differences in VF were attenuated after adjusting for ritonavir hair levels. 16
PLHIV may have difficulty in maintaining adherence because of life circumstances or other reasons, apart from intolerance. Intermittent non-adherence with PIs can result in variable levels of viral suppression, with limited clinical resistance, and this pattern may be common in people who have variable adherence which improves closer to scheduled clinic visits. This is the likely explanation for 40% of our second-line cohort who subsequently re-suppressed after 1 episodes of VF. However, protracted periods of poor adherence with longer viremic time will result in virological and immunological failure and ultimately death. 17 Adjusted Cox regression analyses found the relative mortality risk was elevated by 49% to 75% in people with 1, 2, or ≥2 VL tests >1000 copies/mL during second-line treatment, respectively. The highest proportion of deaths and losses were in the group who had not been taking second-line regimens for long enough to quality for VL testing, or perhaps had disengaged from care, and in this group without a VL test, the adjusted HR for death was 6.40 (95% CI 5.91-6.93). The median and 25th percentile of CD4 cell count in this group was lowest among the groups categorized by number of VL results >1000 copies/mL after second-line switch (Table 2). However, in 90% of the cohort with a CD4 switch count available, at least 25% had CD4 counts <50 cells/mm3, and 6% of the entire second-line cohort had active OI at switch. Lower CD4 counts and active OI which reflect switching with more severe immunosuppression were associated with elevated morality risks after switch, a phenomenon similar to that observed in the Malawian National Treatment Program. 18 However, the highest relative mortality risk was in people who were LTFU. A meta-analysis of second-line ART treatment programs in resource limited settings found that a large number of patients who were lost could not be found, and in those who could be traced, the mortality rate ranged from 20% to 60%. 19 Mortality in the PLWH in our cohort was ascertained by death registry linkage, and the death rate among the group LTFU was 74%. Mortality risk was significantly increased in the Northern, Southern, and Western regions of the country compared to Bangkok, but the rates of second-line failure, or incidence of the number of occasions of VF were not significantly different to those observed in Bangkok. The reasons for this discrepancy are unclear, but may relate to cultural differences across regions, or socioeconomic factors which could impact care. 20
Higher second-line failure, but reduced relative mortality rates, in PLHIV who initiated second-line ART earlier in the study period reflect the amount of follow-up time available. In the case of second-line failure, those who switched more recently had reduced opportunity to have 2 consecutive VL tests which are conducted yearly. Higher mortality incidence in more recent years also relates to follow-up, since deaths were more frequent in the year following switch, so hazard ratios which incorporate person time are biased, as those who initiate ART in earlier periods but do not die, contribute more person time to analyses.
Only 45% of all PLHIV, and 51% of PLHIV who had a VL assessments, had VLs >50 copies/mL 1 year after switching to second-line ART, which is higher than rates described in studies from Africa21,22 and a meta-analysis of results from resource-limited settings, where rates ranged from 11.4% to 39.9% after 1 year of PI treatment. 23 We used a stringent endpoint of 2 consecutive episodes of VF in our study, to differentiate as far as possible, between non-adherence and second-line failure. In support of this, 40% of people who experienced 1 episode of VF subsequently suppressed to <50 copies/mL, highlighting that adherence can be variable in those switching to PI-based ART.
There are several limitations to our analysis. First, PIs, the mainstay of second-line treatment during our study period, are no longer a preferred second-line regimens in the most recent revision of the National Treatment guidelines. DTG is now available in the NAP, has low rates of intolerance, and is available as generic fixed dose combination tablets that can be dosed once daily. As such, these results, particularly those relating to LPV/r-related issues are no longer entirely relevant. Nevertheless, not all adherence issues relate to drug intolerance, and people who do not have transmitted, acquired resistant HIV who fail their first-line regimens may have further problems maintaining good adherence, independent of regimen given. Moreover, the high rates of death in the period soon after switch highlights the importance of switching before PLHIV become severely immunocompromised. This, and the high rates of LTFU in this early period suggests that more intensive follow-up and/or contact with clinic staff, perhaps using newer mobile technologies and or multidisciplinary strategies may assist in reducing attrition rates in PLHIV in the period after switching to second-line treatment. Second, of 5.7% PLHIV who switched to a second-line regimen for reasons other than first-line failure or adverse events, 45% were women. Given that LPV/r can be safely used in pregnancy, but pregnancy status was not available in our data extracts, pregnancy or wanting to conceive might be the reason for these switches. Third, no information regarding behavioral risk factors were available in our data extracts, and adherence measures are not standardized by site. Moreover, adherence assessments, patient physical status and weight and are not tied to reimbursement, so are frequently missing in the database. These factors can influence treatment failure rates, but their absence precluded modeling these covariates in analyses. Despite these limitations, our study reflects the entire Thai National Program between 2008 and 2020 and illustrates treatment outcomes in the largest National second-line cohort reported. Almost 10% of PLHIV who started first-line ART switched to second-line regimens, and in those who never experienced VF after second-line switch, 89% had VL <50 copies/mL at their most recent clinic visit. In the entire cohort who had VL testing, 76% of those in care were virally suppressed at their most recent clinic visit.
Conclusions
Failure after switching to second-line PI-based regimens was approximately 10% at 6 years, and overall rates of LTFU and death were high, particularly in those who recently switched, or who did not maintain virological suppression. VF was more common in younger adults and females, possibly due to non-adherence/intolerance to LPV/r. LTFU was the most important factor associated with subsequent death. However, the majority of the PLHIV who switched to second-line treatment never had an episode of VF, supporting the importance of second-line regimen options in National treatment programs.
Footnotes
Author Contributions
PS, ST, SK, AA, SG, SJK, PC, OP, and KR created the study concept and study design. PS, ST, SK, CL, RT, and KR were responsible for data collection and management or oversaw program implementation. PS, ST, and SJK conducted the analysis. SK, AA, and KR advised on the analysis. PS, ST, SK, AA, SJK, and KR interpreted the data. PS, ST, and SJK drafted the manuscript. All authors critically reviewed the manuscript and approved the manuscript for submission.
Declaration of Conflicting Interests
The authors declared the following potential conflicts of interest with respect to the research, authorship, and/or publication of this article: KR has received the Senior Research Scholar from Thailand Research Fund (TRF), and has received honoraria or consultation fees from Merck, Roche, Jensen-Cilag, Tibotec, Mylan and GPO (Governmental pharmaceutical organization, Thailand). He also has participated in company sponsored speaker's bureau for Abbott, Gilead, Bristol-Myers Squibb, Merck, Roche, Jensen-Cilag, GlaxoSmithKline, and GPO (Governmental pharmaceutical organization). The other authors declare no competing interests.
Funding
The authors disclosed receipt of the following financial support for the research, authorship, and/or publication of this article: De-identified data extracts were provided by the Thai National Health Security Office (NHSO). This research project was supported by the Second Century Fund (C2F), Chulalongkorn University, and through a grant from amfAR, The Foundation for AIDS Research with support from the National Institute of Health's National Institute of Allergy and Infectious Diseases, Eunice Kennedy Shriver National Institute of Child Health and Human Development, National Cancer Institute, National Institute of Mental Health, National Institute on Drug Abuse, the National Heart, Lung, and Blood Institute, the National Institute on Alcohol Abuse and Alcoholism, the National Institute of Diabetes and Digestive and Kidney Diseases, and the Fogarty International Center, as part of the International Epidemiology Databases to Evaluate AIDS (IeDEA; U01AI069907). The dataset was provided by the Thai NHSO and the Ministry of Health. The content of this publication is the sole responsibility of the authors, and does not necessarily represent the official views of any of the governments or institutions mentioned above.