
Abstract
The Partnership for HIV-Free Survival (PHFS) was piloted in rural Kenya using a quality improvement approach to integrate nutrition with prevention of mother-to-child transmission (PMTCT) of HIV services. Data were collected in a preintervention baseline (January 2013 to August 2013) and 3 periods during implementation (September 2013 to June 2016). Integration of nutrition assessment, counseling, and support (NACS) in PMTCT and retention of mother–baby pairs (MBPs) in care showed significant increase over time: The MBPs receiving NACS increased from a baseline median of 15% to 88% (P ≤ .05), and the proportion of MBPs retained in active care increased from a baseline median of 19% to a median of 66% (P ≤ .01). Declines observed in the number of HIV-exposed infants who tested positive for HIV at 18 months were not statistically significant. The PHFS was successful in integrating NACS into PMTCT services and increasing retention of MBPs in care in Kenya.
Introduction
In June 2011, the United Nations launched the global plan toward “the elimination of new HIV infections among children by 2015 and keeping their mothers alive.” 1 The emphasis was on prevention of mother-to-child transmission (PMTCT) that underlines the importance of reaching pregnant women living with HIV and their children from the time of pregnancy up to the first 18 months of the child’s life with life-saving antiretroviral therapy (ART). 1 There are strategies that can reduce HIV vertical transmission to less than 1% in developed countries, 2 but despite positive strides, success remained elusive in middle- and low-income countries. 3
One of the key factors affecting outcomes of PMTCT programs is the retention of mother–baby pairs (MBPs). Specifically, loss to follow-up (LTFU) during pregnancy to 18 months postdelivery has emerged as a clinical and epidemiologic challenge. 4,5 Approximately 10% to 14% of those receiving ART are LTFU. The LTFU estimates are even higher—at 20% to 40%—among HIV-positive children, not on ART and HIV-exposed children. 6 A recent review in low- and middle-income regions estimated PMTCT program losses of 49% among HIV-infected pregnant women between registration at the antenatal clinic and delivery, 34% of HIV-exposed infants (HEIs) by 3 months of age, and 45% among HEIs after testing HIV positive. 7
Malnutrition offers additional challenges for PMTCT. Growth impairment is reported in infants born to HIV-infected mothers, including HIV-exposed but uninfected infants. 8,9 Also, poor nutritional status in HIV-infected pregnant women may impair immunity and weaken epithelial integrity, which are associated with vertical transmission of HIV. 10 A South African study found that poor quality infant feeding counseling resulted in inappropriate infant feeding choices being made by the mother, leading to a 3-fold increase in risk of infant HIV transmission or death. 11 If elimination of mother-to-child transmission (MTCT) is to be achieved, then strategies need to address the whole cascade of interventions. 12 In Kenya, MTCT rates remained stagnant at 14% between 2011 and 2013. 13 Despite this, Kenya is not on the road to attain the Joint United Nations Programme on HIV/AIDS goals of “Elimination of New HIV Infections among Children and Keeping Their Mothers Alive by 2015.”
What Do We Know About This Topic?
Poor nutrition and infant feeding choices can increase the risk of vertical transmission.
How Does the Project Contribute to This Field?
The integration of NACS into the PMTCT program using QI methods, was designed to improve the nutrition component to to address or limit vertical transmission.
What Are the Implications of the Project Towards Theory, Practice or Policy?
This was as successful pilot project. That showed that QI methods can be effecting in resource challenged environment, and when applied to PMTCT programs, can address the key challenge of nutrition for HIV impacted mothers and infants.
Ultimately This Simplified Approach Helps to Test New Policy with Limited Risk.
The Partnership for HIV-Free Survival (PHFS) initiative aimed to accelerate the adoption of the World Health Organization HIV/AIDS treatment guidelines in 6 countries with high HIV prevalence, including Kenya. Given the multiple social, cultural, economic, and system-level challenges that hinder access to PMTCT services in developing countries, 14 quality improvement (QI) approaches were employed to target system-level challenges while also addressing associated nutrition challenges by integrating nutrition assessment, counseling, and support (NACS) services within PMTCT programs. Quality improvement can be used to address challenges to service delivery in resource-poor settings and has the potential to optimize the use of limited resources available from governments and global initiatives targeted at achieving shared aims. 15
Methods
The PHFS was launched by the Ministry of Health (MoH) in September 2013. It applied QI approaches to advance the quality of care for HIV-positive mothers and HEIs in Kwale County in Coast Province of Kenya. This evaluation of the PHFS implementation assessed the effect of QI on the integration of NACS within PMTCT services and the retention of MBPs at selected sites. The aim of this article is to describe how QI practices can effect key indicators and contribute to the country goal of eliminating MTCT. The analysis uses secondary data collected during the treatment process in the facilities. No data outside the clinic registers were used.
Sites
Sixteen facilities in the rural areas of Kwale County in the Coast Province were selected. Three were level 4 health centers, 8 were level 3 health centers, and 5 were level 2 dispensaries. Kwale County was targeted because of poor performance in PMTCT as established by the National AIDS and STI Control Program. 16 The facilities were allocated equally among the 3 subcounties (Msambweni [currently split into the 2 subcounties of Msambweni and Lunga], Kinango, and Matuga) to ensure full geographical coverage across the county. The facilities chosen in each subcounty had to ensure representation of the following levels of care: dispensaries (level 2), health centers (level 3), and subcounty referral health hospitals (level 4). The facilities also had to have the highest patient volume for antenatal care (ANC) with a high PMTCT case load within each subcounty. Table 1 shows the sites by facility type and across the subcounties.
Types of Health Facilities.a,b,c
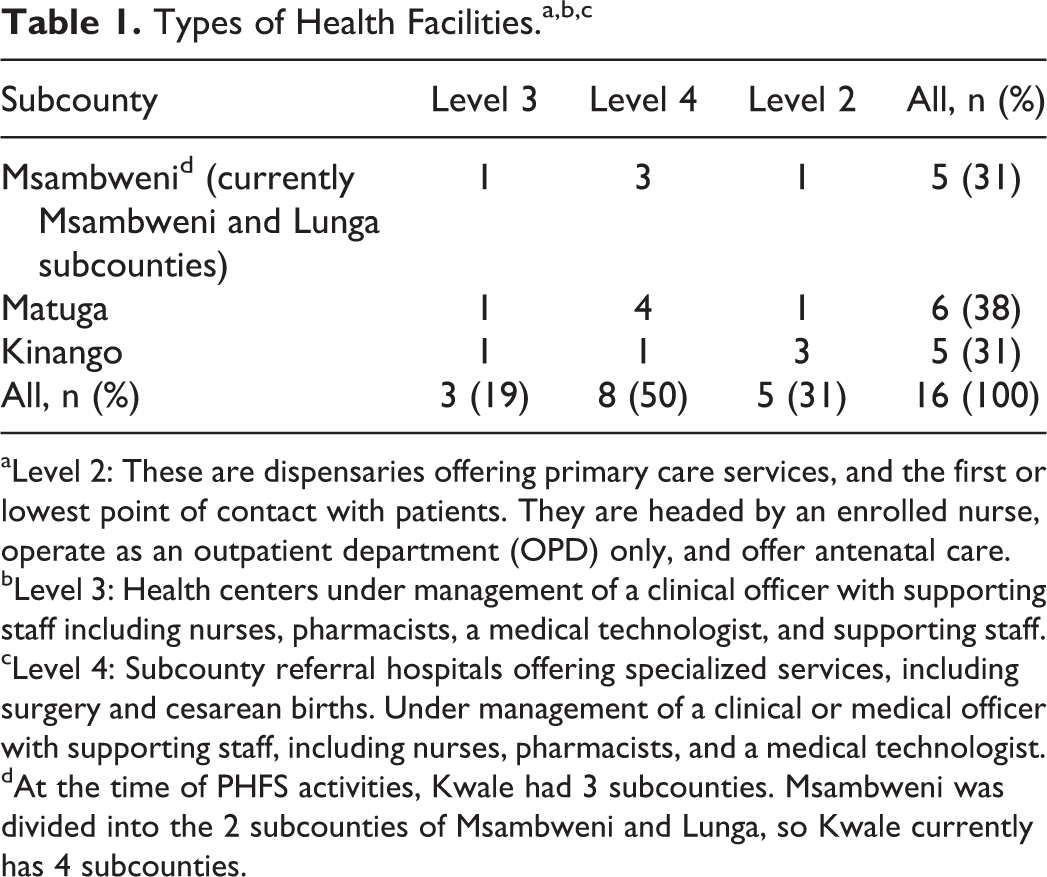
aLevel 2: These are dispensaries offering primary care services, and the first or lowest point of contact with patients. They are headed by an enrolled nurse, operate as an outpatient department (OPD) only, and offer antenatal care.
bLevel 3: Health centers under management of a clinical officer with supporting staff including nurses, pharmacists, a medical technologist, and supporting staff.
cLevel 4: Subcounty referral hospitals offering specialized services, including surgery and cesarean births. Under management of a clinical or medical officer with supporting staff, including nurses, pharmacists, and a medical technologist.
dAt the time of PHFS activities, Kwale had 3 subcounties. Msambweni was divided into the 2 subcounties of Msambweni and Lunga, so Kwale currently has 4 subcounties.
Quality Improvement Teams and Coaches
Implementation, selection of coaches, and formation of QI teams were subject to the existing administrative structures in Kwale County. The overall subcounty health system is overseen by a county health executive, under whom the chief officer of health works with the county director and their county health management team (CHMT) of 10 staff members, responsible for the technical components of the entire health system. The CHMT supervises the sub-CHMT. Each subcounty is led by the subcounty medical officer of health, who is responsible for all health facilities from levels 1 to 4. The general differentiation into levels of care is based on the complexity of services offered and capacity of facilities to deal with complications; level 4 facilities have the capability to handle comprehensive obstetric emergencies, while level 2 and 3 facilities only handle basic obstetric emergency care.
Quality improvement coaches were drawn from the subcounty teams and assigned specific program areas. Each facility was assigned a coach who guided the teams through the improvement process. Given the difference in size and complexity of operations, level 4 facilities included a QI committee that consisted of representatives from all the departments in the hospital: maternal, newborn, and child health (MNCH); laboratory; surgical; and medical. The committee was responsible for the coordination and oversight of all the departmental QI teams and for ensuring alignment between teams, especially in cases where the improvement aim transcended one department (eg, a laboratory representative in the MNCH work improvement [WI] team assisting with the reporting of test results). Departmental QI teams were called WI teams. For the level 2 and 3 facilities, there were only WI teams and no QI committee. Quality improvement teams consisted of 2 to 10 members depending on the facility level.
Quality Improvement Process
Baseline assessments occurred from January 2013 and implementation began in September 2013 for nearly 3 years, ending in June 2016. The PHFS implementation in each country focused on 4 steps in the PMTCT care cascade: (1) retention of MBPs in care; (2) ensuring all MBPs receive all recommended services, including NACS; (3) MBP HIV status is known; and (4) optimal ART coverage for the positive mother and her exposed baby. Improvement work for these 4 steps were implemented concurrently in all 16 facilities, and relevant process indicators were identified to track progress
The plan-do-study-act (PDSA) cycle is an iterative approach to QI. We engaged in a bottom-up approach. Health workers were empowered and given the capability-—while being guided by coaches—to identify areas that negatively impact care within their facility and to address those problems by testing small changes to the process with the aim of improving care (see Figure 1).

Quality improvement teams and processes at facilities in Kenya, 2013 to 2016.
Each QI team worked with overarching improvement aims established with their improvement collaborative. Those improvement aims described a shared target (eg, improving retention from 40% to 90%), but each team would tailor their intervention according to the unique context and challenges in their facility. Change ideas would be tested for at least a few days to give teams time to review process data daily and monitor changes to the indicator(s). The team would decide if the change idea was resulting in enough improvement. If the change idea showed promise but not enough improvement, it would be adapted; if it was ineffective, the change idea would be discarded. A compendium of changes would be tested one at a time toward collectively improving the target indicator. Typically, an indicator would need to meet or exceed its target for at least 6 data points (each data point typically represents 1 month) to be considered “improved.”
From their subcounty offices, the coaches visited the 16 facilities at least monthly. They met with the QI committee and WI teams to discuss progress and performance on the selected indicators. The WI teams at each level 4 facility also identified and prioritized factors across the departments that impacted processes of care and then brainstormed solutions. Teams then developed strategies and tested different change ideas to address these facility-wide problems, monitoring progress over time and their impact on the indicators. Successful processes—the change ideas that resulted in improvement—were institutionalized. All 16 facilities were evaluated on the same quality indicators in the continuum of care for PMTCT. Problems identified were diverse—at times unique to a facility—but mostly similar across all facilities. At times, different facilities tested different approaches to solving similar problems.
All facilities had to address data quality issues first. Often, little to no data were available in the clinics registers and patient cards, making it impossible for staff to have a full picture of who they were seeing, and services were not being given to patients. The QI coaches worked with teams to audit the clinic data sources and to find ways to improve data completeness and accuracy before moving on to other improvement areas.
Individuals on the QI teams who mastered the QI process also engaged in peer-to-peer learning to improve capacity in their facilities.
Peer-to-peer collaborative learning sessions provided an opportunity to share successful change ideas across the facilities. The learning sessions brought together representatives of the QI committees, WI teams, and coaches to discuss progress and challenges as well as to jointly develop action plans to support the ongoing QI strategies. The change ideas implemented in each facility were compiled into a change package for rapid implementation at facilities that were yet to implement QI.
Indicators
All 16 facilities monitored the same indicators monthly. These were primarily process indicators derived from the continuum of care as recommended by the PMTCT guidelines for Kenya. The indicators measured key milestones along the continuum of care from first ANC to the point of discharge of the MBPs from MNCH clinics or referral to Comprehensive Care Clinics in the event of a positive HIV diagnosis for the child. We also monitored an outcome indicator for the infant cohorts.
The 3 indicators selected for analysis are representative of the key aspects of the program: (1) the measure of retention in care of MBPs, defined as the percentage of HIV-affected MBPs in active care out of the estimated number of HIV-affected MBPs in the facility catchment population; (2) the measure for the evidence of NACS service provision—including nutrition assessment using mid-upper arm circumference, weight, and height measurements—defined as the percentage of MBPs receiving NACS in a given month out of the number of MBPs reviewed at the facility each month; and (3) the outcome measure—which is the HIV-positive status of HEIs at 18 months—is defined as the percentage of HEIs who are confirmed HIV positive out of the reported HEI per month in the facility.
Data Sources and Analysis
We conducted a longitudinal analysis of secondary data aggregated across all 16 facilities in Kwale County. Patients were counted if they met the defined numerator and denominator criteria. All patients were aggregated across the facilities for both the numerator and denominator, and one indicator was calculated for the county.
Data for all 3 indicators (retention of MBPs, NACS provision, and HIV status of HEIs) were obtained from the MBP register and verified with data from the HEI cards, HEI register, and the mothers’ patient encounter cards (MoH 257). The data were extracted by the QI team on a monthly basis from the facility records into an Excel database.
Each indicator was plotted monthly over the baseline period (January 2013 to August 2013) through the period of program implementation (September 2013 to June 2016). For the purpose of this analysis, the project time line was divided into 4 periods: baseline period 1 (January 2013 to August 2013), period 2 (September 2013 to August 2014), period 3 (September 2014 to August 2015), and period 4 (September 2015 to June 2016).
We used the nonparametric Wilcoxon signed rank test in Stata 13.0 to determine the statistical significance of a difference in the median of the indicator from one period to the next. The Wilcoxon signed rank test is a nonparametric test used to analyze repeated data.17,18 Unlike the parametric paired t test, there is no assumption about the distribution, and the analysis is based solely on the order in which the observations fall within each of the baseline period and the 3 periods during implementation. 17
Ethical Approval and Informed Consent
This was not a research study, but an analysis of secondary data collected as part of routine service delivery. There were no human subjects, and individual patient information was not used, thereby did not fall under purview of the National Commission for Science, Technology and Innovation.
Results
Summary measures for the 3 indicators aggregated across the 16 facilities in rural Kwale County are shown in Table 2.
Summary QI Measures, Kenya, 2013 to 2016.
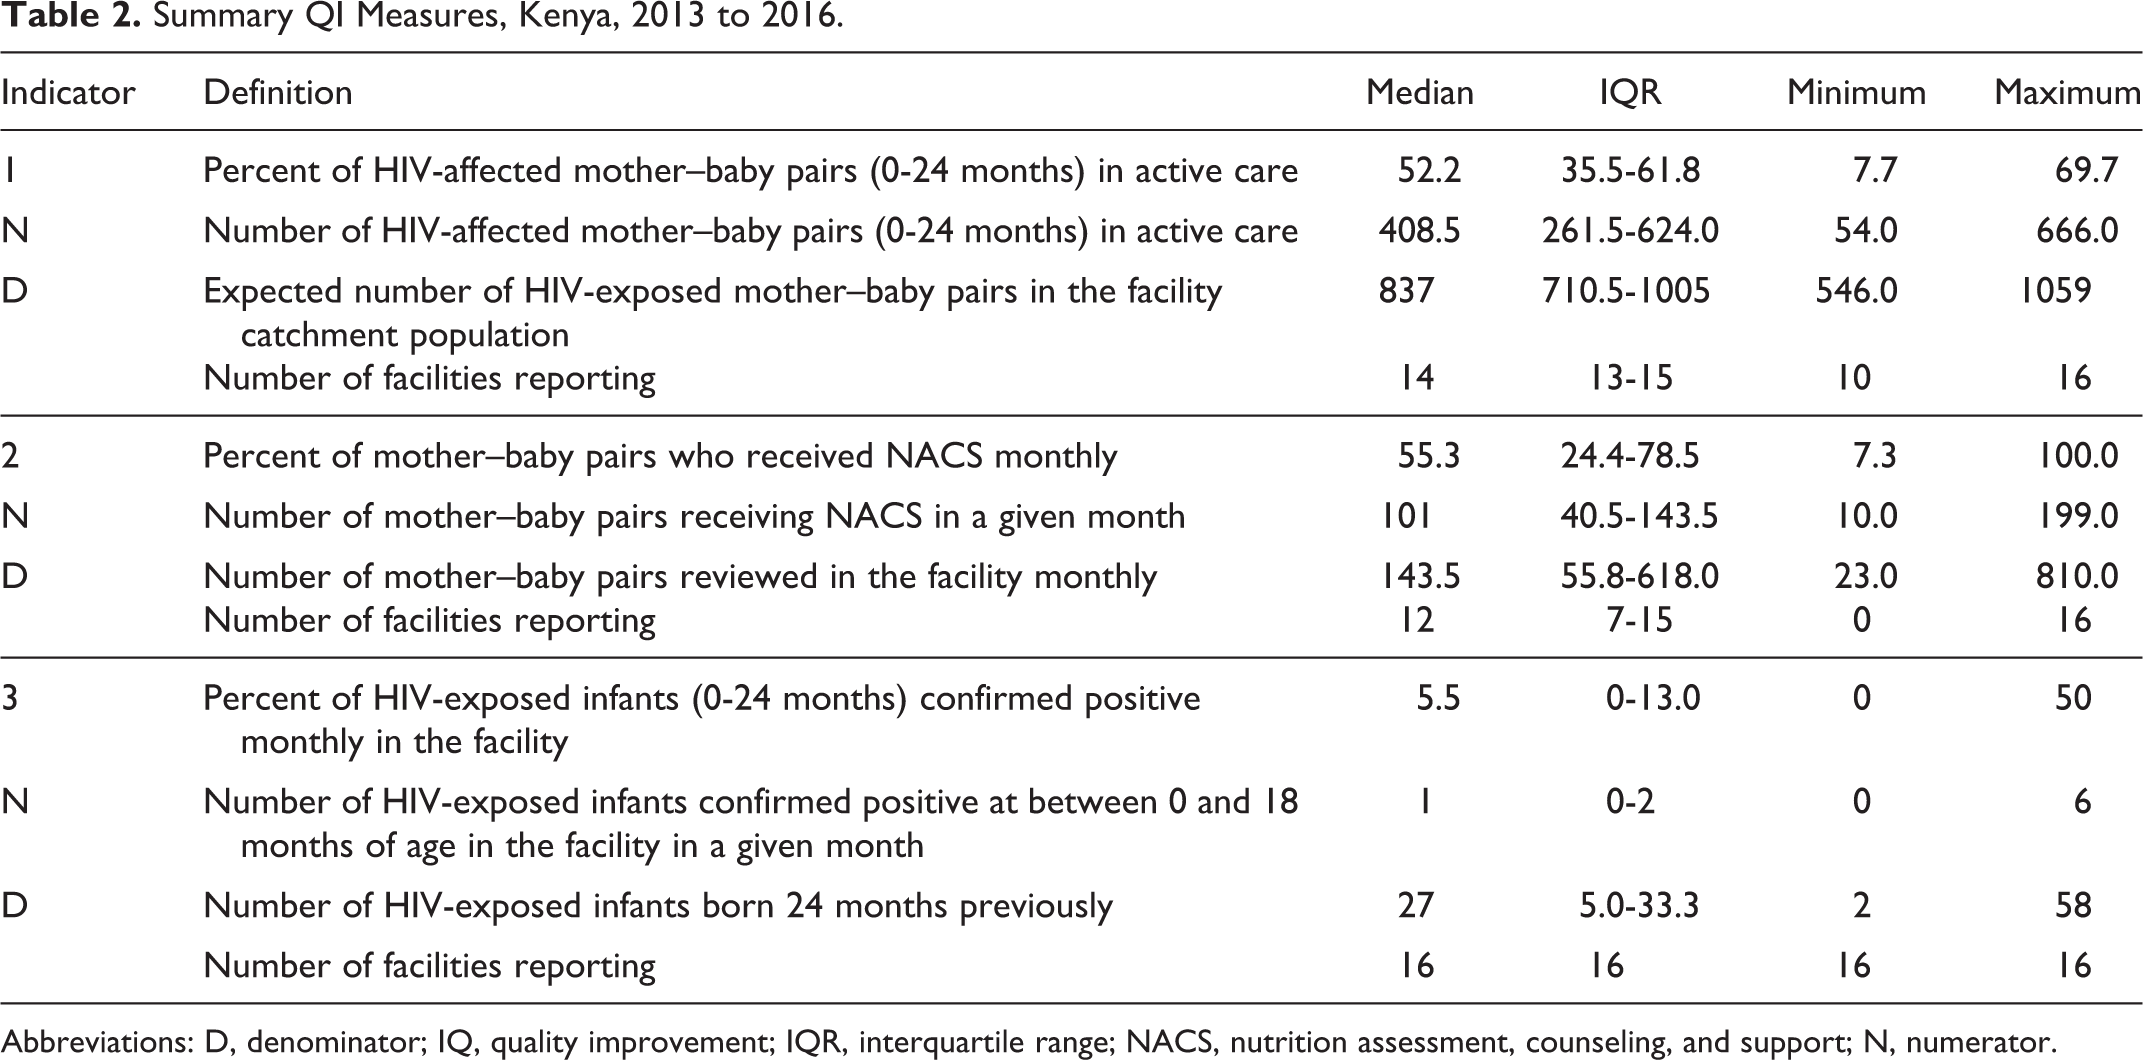
Abbreviations: D, denominator; IQ, quality improvement; IQR, interquartile range; NACS, nutrition assessment, counseling, and support; N, numerator.
Retention of MBPs
The overall median for expected number of MBPs was 837.0 (interquartile range [IQR]: 710.5-1005.0), out of which 408.5 (IQR: 261.5-624.0) were in active care across all facilities; 51.2% of the expected HEI MBPs are not seen at the facilities. The overall median of the percentage of MBPs in active care for the 4 periods was 52.2% (IQR: 35-65). Overall, there was consistent improvement even during the baseline period, which continued until the end of the reporting period. The Wilcoxon signed rank test showed consistent and significant increases over the baseline period median of 19%. In period 2 (the first 12 months of implementation), the median increased significantly to 42% (P ≤ .01). In period 3 (the second 12 months of implementation), there was another significant increase in the median to 60% (P ≤ .01), and in the final period, an increase to a median of 66% (P ≤ .01; see Figure 2A).

A, Indicator 1: HIV-affected mother–baby pairs (0-24 months) in active care (January 2013 to June 2016). B, Indicator 2: Mother–baby pairs who received nutrition assessment, counseling, and support (January 2013 to June 2016). C, Indicator 3: HIV-exposed infants (0-24 months) confirmed positive each month (January 2014 to June 2016).
Nutrition Assessment, Counseling, and Support
Compared to the overall median of those in active care (408.5; IQR: 261.5-624.0), even fewer MBPs were reviewed monthly (143.5; IQR: 55.8-618.0) at the facilities, with a median of 55% (IQR: 24.4-78.5) receiving NACS across the 4 periods. The median during the baseline period was 15%, and there was a significant improvement to 40% (P ≤ .01) in the first year of project implementation. Further significant improvements occurred in the last 2 periods from 69% (P ≤ .01) to 88% (P ≤ .01; Figure 2B). From January 2013 to January 2014, the number of patients recorded as receiving PMTCT services were relatively higher compared to later reports; over time, reporting improved, and fewer but more accurate numbers of patients were reported (see Figure 2B).
HIV-Positive Rates for HEIs Delivered at the Facilities
Facilities did not start reporting this indicator until January 2014. The overall median of the expected number of HEI deliveries across all facilities was 27 (IQR: 5.0-33.3), with a median of 1 (IQR 0-2.0) for the number of HIV-positive exposed infants and a median of 5.5% (IQR 0-13.0) for the MTCT outcome indicator. The outcome indicator showed considerable fluctuations from January 2014 to December 2015 (periods 2 and 3; Figure 2C). The change in the median of 9% in period 3 to the median of 4% in the last period was not statistically significant (see Figure 2C).
Tested Changes That Contributed to the Results
In general, improved documentation helped with completion of the registers relevant to PMTCT services and allowed for better calculation of the indicators. Facilities actively integrated and consolidated all relevant services to improve MBP retention. The services along the continuum of care for MBPs were offered in one location; clinic visits were synchronized for the MBPs to facilitate attendance and ensure that MBPs received all recommended services. For the NACS indicator, exclusive breastfeeding for the first 6 months was recommended while the mother was on ART. The nutrition assessment, counseling, and support provision improved with the introduction of the MBP register, a change from documenting services only for the mother. Community health workers and mentor mothers were trained to conduct nutrition assessment to enable health workers to concentrate on other tasks, and ensuring that a higher number of MBPs were assessed. To improve the number of HEIs being tested at the facility, staff conducted consistent reviews and follow-up with patients and regularly reviewed the MBP registry to assess if testing for HEIs occurred at 3, 9, and 18 months. Early detection ensured treatment initiation that could improve child survival. These changes are summarized in Table 3.
Tested Changes by Care Process.

Abbreviations: ART, antiretroviral therapy; MBP, mother–baby pair; MNCH, maternal, newborn, and child health; PMTCT, Partnership for HIV-Free Survival.
Discussion
Applying QI approaches to PMTCT services was associated with positive improvement in key services (including NACS) in the PMTCT cascade. From the baseline period to the end of program implementation, there was significant and consistent improvement in the retention and NACS process indicators. The improvement in the outcome indicator, which measured the percentage of HEIs who tested HIV positive, was not statistically significant.
Improvement in the retention and NACS process indicators was observed during the baseline period, although implementation of QI at the facilities did not occur until September. The improvement observed during the baseline period could be a result of changes in the facility in response to the announced QI program. The retention of MBPs is particularly relevant to the overall success of PMTCT as it addresses LTFU. 6 It is the entry point to the provision of health services 19 and thereby the first step to improving quality of care for MBPs. We learned that integration and consolidation of clinical services was an important part of retaining MBPs; all related PMTCT and NACS services were offered at 1 monthly visit at the same location. This eliminated some barriers to seeking care, including delays and interruptions, and ensured that MBPs received all recommended PMTCT services. Similarly, some studies showed positive findings even when fewer services were integrated. Integration of ART and ANC services doubled the proportion of treatment-eligible women initiating ART while pregnant, 20 while integration of PMTCT and ANC services with community support and addition of a service directly related to the indicator being assessed (laboratory courier for CD4 counts) improved the percentage of HEI with a 6-week polymerase chain reaction test in Zambia from 41.9% to 55.8%. 21
The NACS (Figure 2B) indicator was subject to data quality issues during the baseline period, which accounts for the relatively high denominators and numerators in comparison with the later periods, which was later improved with support of the coaches. Despite this, the improvement in the NACS indicator highlights the successful integration of nutrition with PMTCT services despite health systems factors that detract from improving quality of care for MBPs. Integration of services in weak and overburdened health systems 22 can be daunting when there is a lack of adequate and skilled human resources 23,24 to address a perceived low-priority concern such as infant feeding and counseling. Even with consistent malnutrition among mothers and infants in countries with high HIV prevalence, 25 confusing messages on HEI feeding 26 are often not addressed in PMTCT programs. Also, there has been poor support and supervision and weak monitoring and evaluation of infant feeding in Kenya. 27 Despite these problems, QI teams identified solutions within their immediate environment that were able to expand the provision of NACS to more MBPs over time.
The outcome indicator was reliant on improvement of the process indicators. Increased retention increased the chance that MBPs received all evidence-based PMTCT services as recommended by the national guidelines. 19 Exclusive breastfeeding when the mother is on ART—in addition to counseling—decreased the risk of vertical transmission. It also ensured that the child suffered fewer infections like diarrhea, which increase child mortality even without HIV. As noted in the change ideas, facility teams sought to ensure that the exclusive breastfeeding message was affirmed at each visit and within the support groups.
Although solutions were focused on processes within the facility, of note were the linkages facilitated by a mentor mother program and its expansion during the implementation period. The program supported patients with the help of fellow HIV-positive mothers who had experienced the PMTCT program. They supported the health workers in selected facilities to provide key services such as adherence counseling, routine home visits, tracing of MBPs, and formation of support groups, which all ensured active participation of new MBPs. They also provided much-needed assistance for nutrition assessment and support. Support from mentor mothers, together with cognitive-behavioral interventions, has been shown to improve knowledge of HIV and positive emotional outlook for mothers in South Africa. 28
The QI approaches implemented at the facilities led to the reorganization of PMTCT services to ensure adherence to the national program standard operating processes for the care of HEIs. They also resulted in facilities using administrative data to better understand problems and subsequently generate solutions that improved their performance on the indicators being monitored. The findings from this analysis demonstrate that the impact of QI on integration of NACS into PMTCT services and increased retention of MBPs is significant and can be attributed to the iterative QI approach and coaching support provided to health workers at the pilot facilities.
Strengths and Limitations
The strength of PHFS implementation in Kenya lies in the mobilization of facility-based teams that applied the QI process to foster learning among their peers and therefore helped to drive faster adoption of QI by the rest of the facilities. Peer learning proved to be an effective means of testing and packaging change ideas, while the improvement in using administrative data for QI purposes ensured that they could closely monitor and institute changes to health service delivery processes. The composition of the QI committees and WI teams ensured that the problems were identified by staff who were part of the health delivery process. Solutions were relatively simple and could be implemented quickly by the staff.
A key limitation of the PHFS implementation in Kenya was data management and quality. Staff encountered difficulty in correctly interpreting the indicators and subsequently in reporting the aggregate patient numbers. However, this improved over time with the help of the coaches. The evaluation does not measure the effect of the identified factors on the indicators.
The QI process relies on the experience and knowledge of the health workers to identify the issues within their facilities to which to apply PDSA cycles. Yet it is possible that certain factors could have been neglected. Even though the emphasis was to address processes of care within the facility, there have been reported advantages to other initiatives to improve retention of MBPs such as partner support and use of cell phones to facilitate appointment reminders, while male partner involvement has led to reduction in HIV among infants. 29 One of the key issues encountered at the facility was high turnover, meaning that new staff were consistently being trained to address limited competencies in HIV management.
Based on the population estimate used to calculate the number of MBPs expected in care, we note that retention in care is still low. There remain many MBPs in Kwale County who may never have accessed care at health facilities at all. This could be attributed to low health-seeking behavior in general and long distances between homes and the nearest health facility.
Conclusion
The PHFS has been a major area of concern in the strategy to reduce HIV transmission in rural Kenya. This demonstration underlines the importance of QI strategies in addressing aspects of the multifaceted problems encountered in the service delivery environment in rural Kenya. This demonstration is a starting point for more rigorous research in resource-limited facilities, which results in generalizable findings and builds on the culture of data use to inform programs or new initiatives within facilities.
The resulting change package offers practical solutions that can be helpful to facilities across the country. Sustainability of initiatives like the PHFS is susceptible to factors that weaken health system performance including inadequate human resources for health, especially in regard to evaluation and/or data management that affected initial aspects of the PHFS implementation. Ongoing health systems strengthening efforts, in addition to MNCH polices such as the free maternity policy that guarantees access to care, 30 can help Kenya attain its PMTCT goals.
Footnotes
Authors’ Note
The implementation of PHFS in Kenya was a collaborative process among several stakeholders. The authors acknowledge the leadership and support of Dr Martin Sirengo, Head, National AIDS & STI Control Program (NASCOP); Dr Rose Wafula, PMTCT Program Manager, NASCOP; Dr Hijara El Busaidy, County Health Director, Kwale County; and the QI coaches and facility-based QI teams in Kwale County who implemented the PHFS in Kenya. The authors also appreciate the technical support and guidance provided by Amy Stern, Anisa Ismail, and Edward Broughton of URC.
Kevin Kinyua, MBChB, and Aurora O. Amoah, PhD, MPP, MPH, equally contributed to this study.
Declaration of Conflicting Interests
The author(s) declared no potential conflicts of interest with respect to the research, authorship, and/or publication of this article.
Funding
The author(s) disclosed receipt of the following financial support for the research, authorship, and/or publication of this article: This work was supported by the US President’s Emergency Plan for AIDS Relief (PEPFAR) through the US Agency for International Development (USAID) and its Applying Science to Strengthen and Improve Systems (ASSIST) Project, implemented by University Research Co, LLC (URC), through Cooperative Agreement Number AID-OAA-A-12-00101.