
Abstract
The Health Resources and Services Administration requires that jurisdictions receiving Ryan White (RW) funding justify need, set priorities, and provide allocations using evidence-based methods. Methods and results from the 2011 Los Angeles Coordinated HIV/AIDS Needs Assessment–Care (LACHNA-Care) study are presented. Individual-level weights were applied to expand the sample from 400 to 18 912 persons, consistent with the 19 915 clients in the system. Awareness, need, and utilization for medical outpatient care were high (>90%). Other services (eg, child care) had limited awareness (21%). Majority of participants reported at least 1 service gap (81%). Lack of insurance (risk ratio [RR] = 3.0, 95% confidence interval [CI]: 1.5-6.2), substance use (RR = 2.9, 95% CI: 1.3-6.4), and past lapses in medical care (RR = 2.8, 95% CI: 1.3-5.9) were associated with gaps. Within clusters, past incarceration was associated with gaps for housing (RR = 13.5, 95% CI: 3.5-52.1), transportation (RR = 3.2, 95% CI: 1.2-8.4), and case management (RR = 4.0, 95% CI: 1.3-12.2). Applied methods resulted in representative data instrumental to RW program planning efforts.
Introduction
In the United States, the Ryan White (RW) Comprehensive AIDS Resources Emergency (CARE) Act was first enacted in 1990 to fund medical and social services for low-income persons living with HIV/AIDS (PLWHA). 1 Annual estimates incidate that the RW HIV/AIDS program provides services to over half a million PLWHA, ranking the program as the third largest funder for HIV/AIDS services nationally. 2 Following the latest 2010 CARE act reauthorization, fund increases were allocated at the national and local levels with new provisions toward core medical services and identifying undiagnosed HIV cases. Federal funding requirements indicate that each jurisdiction receiving funding justify need, set priorities, and allocate resources using evidence-based data. 2
Needs assessments serve as important tools for assessing social service needs for both new and existing programs. 3 Results are used by both planning bodies and policy makers to assess program utility and influence resource allocations. 3,4 Among HIV-infected populations, needs assessments are particularly helpful in evaluating the effectiveness of existing services, prioritizing their relative importance across regions and populations, and guiding funding in resource-limited settings. As RW CARE act funding is based on a jurisdiction’s needs assessment, it is important that the data collected are representative of, and therefore generalizable to, the eligible population. While obtaining representative samples from such community-based assessments is a subject of increasing importance for both the Institute of Medicine and the US Centers for Disease Control and Prevention (CDC), the majority of such assessments have relied on convenience samples with limited generalizability. 5 -9
Los Angeles County (LAC) is one of the largest counties in the United States geographically and is also home to the second largest number of PLWHA in an urban jurisdiction. 10 The RW system of care serves 45% of the approximately 50 550 PLWHA in LAC and funds a wide range of services that include oral health, HIV clinical care, psychosocial case management, residential care, transportation services, substance abuse treatment, and nutritional support. 11 In LAC, the population receiving RW services is largely male (86%), 40 years of age or older (67%), Latino (48%), living with an AIDS diagnosis (49%), and living at or below the Federal Poverty Guidelines (FPGs; 68%). 11
This paper presents a novel methodology to identify a representative sample of agencies and clients in the RW service delivery system. Additionally, it highlights system sociodemogrpahic disparities in awareness, utilization, and access to needed services and identifies important service gaps. While many needs assessments utilizing convenience sampling, our methods indicate a representative sample of clients in the RW system of care that has potential widespread utility nationally.
Methods
A 2-stage, stratified, probability proportional to size sampling design was used to identify and recruit a representative sample of agencies and clients in the RW system. 12 The approach used a combination of methods developed and implemented for the HIV Cost and Services Utilization Study (HCSUS) and 2 CDC-funded studies, the Medical Monitoring Project (MMP) and the National HIV Behavioral Surveillance System (NHBS). 9,13 -15 These population-based approaches were developed by the CDC to increase the representativeness of data collected from HIV-infected persons in the United States. 9,16 Facility sampling methods were based on MMP and patient sampling methods were a combination of NHBS and HCSUS methods. All study materials received appropriate approval from institutional review boards prior to enrollment and a Certificate of Confidentiality was acquired.
Stage 1: Facility Sampling Frame
The goal of the facility sampling stage was to select a representative sample of facilities from the universe of RW-funded agencies in LAC. These included a diverse group of service sites (eg, HIV outpatient clinics, community-based organizations, and social service agencies), with a variety of patient populations (range = 2-4000 persons), across a vast geographic region (4060 square miles). Probability proportional to size sampling was used to select specific service sites for recruitment. 12 Within LAC, 47 separate agencies provide RW-funded services through a complex network of approximately 100 service sites. To maximize the geographic diversity, individual service sites were used as sampling units.
First, agency sites were stratified into 5 mutually exclusive categories: HIV clinical care, HIV social services, residential services, substance abuse services, and oral health services. Within each stratum, sampling probabilities for each service site was proportional to size, with higher sampling probabilities for the larger sites. Size was determined by the number of RW-funded clients each service site reported to the LAC RW Case watch surveillance system in FY09 (March 2009-Feburary 2010). Initially, 46 service sites, representing 38 separate agencies, were randomly sampled to participate. An additional 3 service sites were added to the sample to improve geographic representation. In total, 49 service sites were selected for patient recruitment.
Stage 2: Patient Sampling
The goal of the second sampling stage was to generate a representative sample of patients from selected service sites. Standardized calculations indicated that a sample size of 400 was needed to estimate a population proportion with sufficient precision (assuming a 5% margin of error and 95% confidence level). 12 The patient sampling stage took into account both facility and patient sampling probabilities, adjusting the latter to ensure that patients from larger facilities were not overrepresented. Once the number of participants per sample site was established, real-time sampling (a method where eligible participants are sampled as they arrive for services) was used to conduct random participant selection. 15 Real-time sampling has been shown to be successful at recruiting statistically representative population-based samples from studies with similar multistage sampling frames. 14,15
Days and times that sampling occurred were chosen weekly at random from a list of available sites. The number of eligible participants at an individual site varied depending on the hours of operation, day of the week, and type of site. To account for this, recruitment was staggered based on daily facility patient load (eg, every patient for small facilities, every fourth patient for large facilities). Real-time sampling ensured that participant selection was appropriately adjusted if sampling took place over several days. On average, 2.3 site visits were needed to complete interviews at a particular site. To reduce selection bias, agency staff were instructed not to inform potential participants about the survey or make any special announcements.
Questionnaire
Data were collected using a computer-assisted survey instrument method programmed using QDS software (NOVA, Maryland), with interviews conducted in either English or Spanish. Survey questions focused on participant awareness, need, and utilization of 47 different HIV services available to RW recipents residing in LAC. Information regarding demographics, insurance status, HIV testing history, sexual behaviors, substance use, mental health, and oral health was also collected. Questionnaires were completed in 30 to 45 minutes, and participants were compensated with a US$30 gift card to local stores.
For each of the 47 service categories, participants were asked whether they were aware of the service, whether they needed the service, and whether they received the service. Skip patterns prompted additional questions for those who received a service to determine client satisfaction and identify access barriers. For analysis purposes, the 47 service categories were grouped into 5 service clusters: (1) HIV clinical care, (2) case management, (3) residential care and housing, (4) transportation, and (5) other social support services.
A service gap was defined as a service a client stated that he or she needed but did not receive. 17 For each gap, respondents were asked to report the main reason they were unable to access the needed service from a list of options. Barriers were categorized into structural, organizational, or individual types for analysis purposes. 18,19 Structural barriers included too much paperwork or red tape or too many rules and regulations. Organizational barriers included service provider was insensitive to client concerns, wait time for an appointment or in the waiting room was too long, or the organization provided the wrong referrals. Individual barriers included client was not aware that a service or treatment was available, client was not aware of the location of service(s), or client did not know whom to ask for help. When possible, qualitative responses were classified into the abovementioned categories.
Weighting
Individual-level analysis weights for respondents’ data were generated based on known sampling probabilities at both the facility and patient stages. 20 Due to high response rates, nonresponse adjustments yielded no significant alterations to the sampling weight distributions. Adjustments were made to account for repeated utilization of services, which afforded patients multiple opportunities to be sampled. 21 These included adjustments based on the number of times a participant accessed the same or similar services at the sampled facility, the number of visits to other sampled facilities, and the number of facilities accessed during the surveillance period. These data were obtained from the LAC Department of Public Health RW case watch database. Applying these adjustments resulted in a weighted sample size of 18 912, a population size estimate very similar to the 19 915 known RW recipients in the system during the surveillance period.
Statistical Methods
All analysis was conducted using SAS v9.2 (SAS Corp, North Carolina) and SUDAAN (RTI International, North Carolina), employing procedures that took the complex sample design into account. Several statistical methods were used to analyze results, including t tests, analysis of variance, risk ratios (RRs), and logistic regression. 22 -24 Unless otherwise specified, standard cutoff values (P ≤ .05) determined significance. Estimated proportions and RRs are accompanied by 95% confidence limits. Variable selection for logistic regression was based on a combination of bivariate analyses and model selection techniques that included best subset selection. 24
To determine the overall generalizability of the sample, demographic characteristics were compared to patients in the RW-funded system during the surveillance period. 11 The geographic distribution of the study sample sites and participants was compared to that of reported HIV cases in LAC by service planning area (SPA). It should be noted that residence for all persons reported with HIV is based on residence at the time of HIV/AIDS diagnosis and does not reflect current residence of persons living with HIV in LAC. The number and percentage of respondents who were aware of services, needed services, received services, or reported service gaps are also presented by individual service category. The ranking of services by those with the largest gaps and the barriers to each of the service categories are also presented. Finally, logistic regression models are presented that include predictors of reporting any service gap for any RW services as well within each service cluster.
Results
The overall response rate for the survey was 94%, with 100% of sampled sites and 94% of clients agreeing to participate. The major reason for participant refusal was insufficient time to complete the survey. A comparison of demographic variables for Los Angeles Coordinated HIV/AIDS Needs Assessment–Care (LACHNA-Care) respondents versus all RW clients in the system during the same surveillance period is shown in Table 1. This was conducted to ensure that the LACHNA sample adequately represented the RW population it was intended to estimate. No statistical differences between proportions of LACHNA-Care participants and RW clients were found for the majority of variables. The major exception is that a higher proportion of LACHNA-Care participants were identified as being currently homeless (12% unweighted and 14% weighted) compared to the RW population (5%; P < .01).
Demographic Characteristics of HIV-Positive Ryan White Clients Residing in Los Angeles County, January to June 2011.
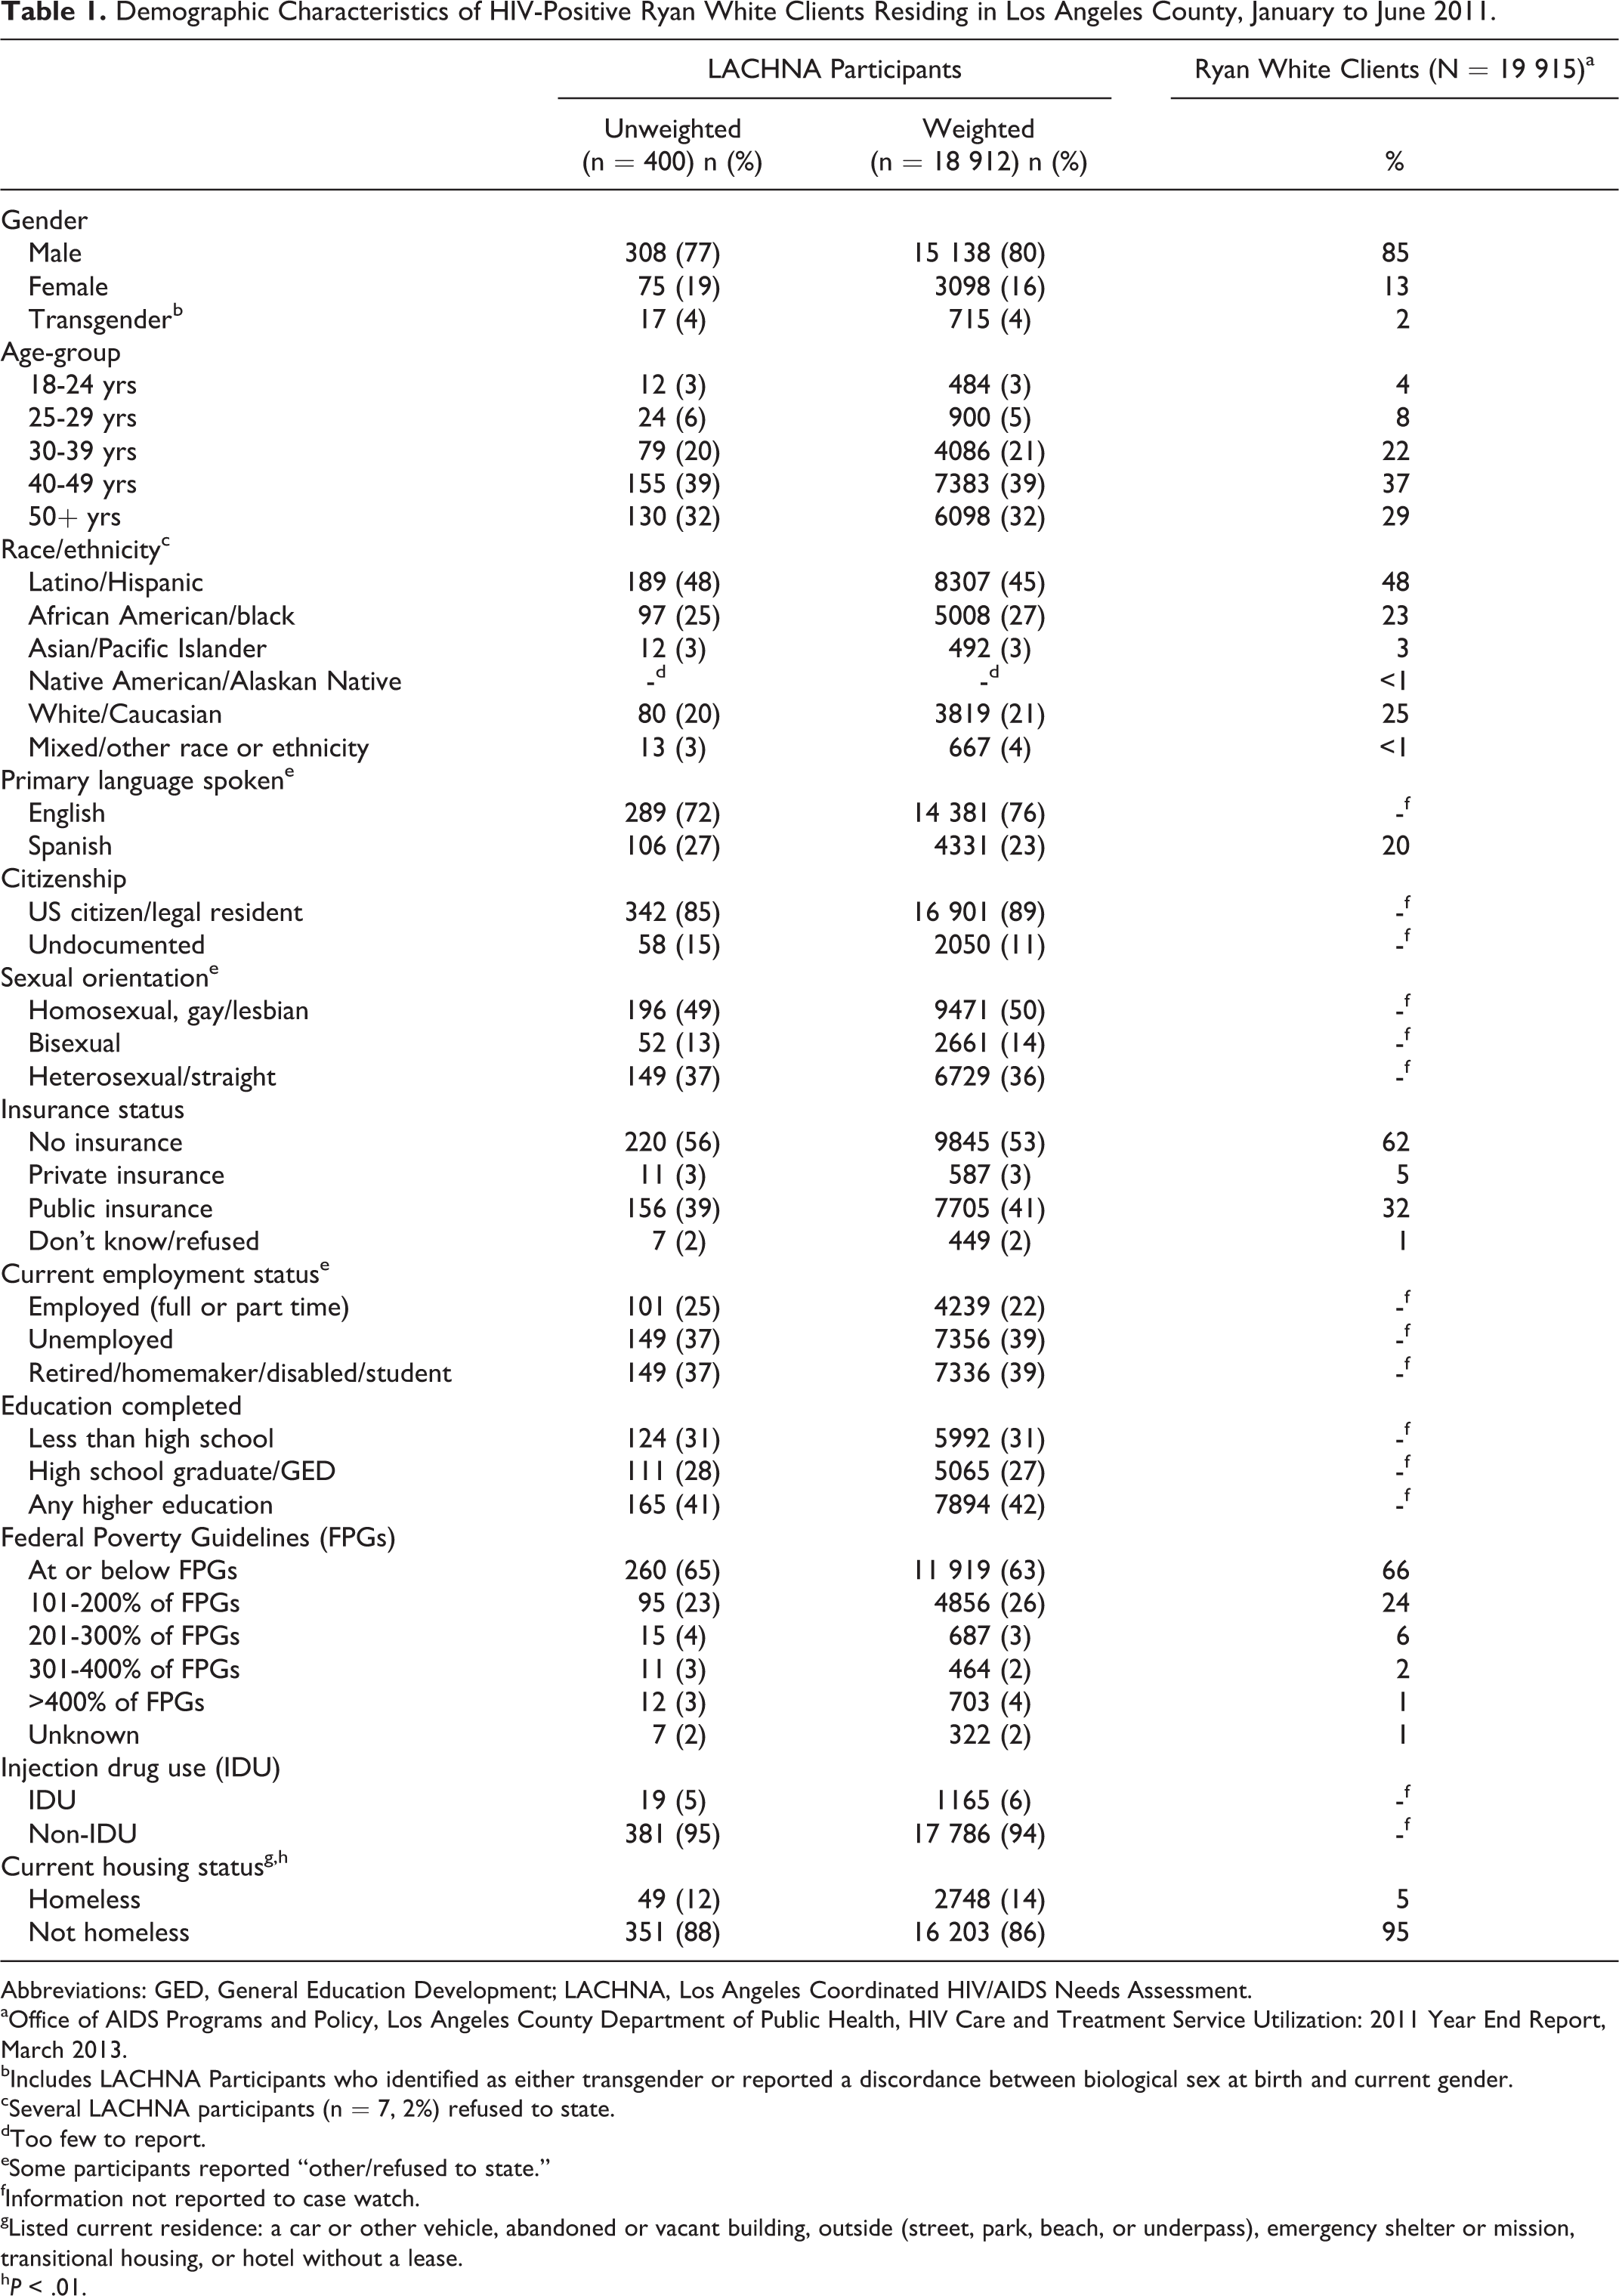
Abbreviations: GED, General Education Development; LACHNA, Los Angeles Coordinated HIV/AIDS Needs Assessment.
aOffice of AIDS Programs and Policy, Los Angeles County Department of Public Health, HIV Care and Treatment Service Utilization: 2011 Year End Report, March 2013.
bIncludes LACHNA Participants who identified as either transgender or reported a discordance between biological sex at birth and current gender.
cSeveral LACHNA participants (n = 7, 2%) refused to state.
dToo few to report.
eSome participants reported “other/refused to state.”
fInformation not reported to case watch.
gListed current residence: a car or other vehicle, abandoned or vacant building, outside (street, park, beach, or underpass), emergency shelter or mission, transitional housing, or hotel without a lease.
h P < .01.
The geographic distribution of sample sites and completed interviews compared to the HIV/AIDS epidemic in LAC is shown in Table 2. The geographic location of the LACHNA-Care sites and participants is very similar to that of the distribution of the HIV/AIDS epidemic, and no differences were observed.
Comparison of Proportions of PLWHA in LAC by SPA (N = 42 295)a to the LACHNA-Care Sample by Service Site Location (n = 49) and Number of Interviews Completed (Unweighted n = 400 and Weighted n = 18 912).
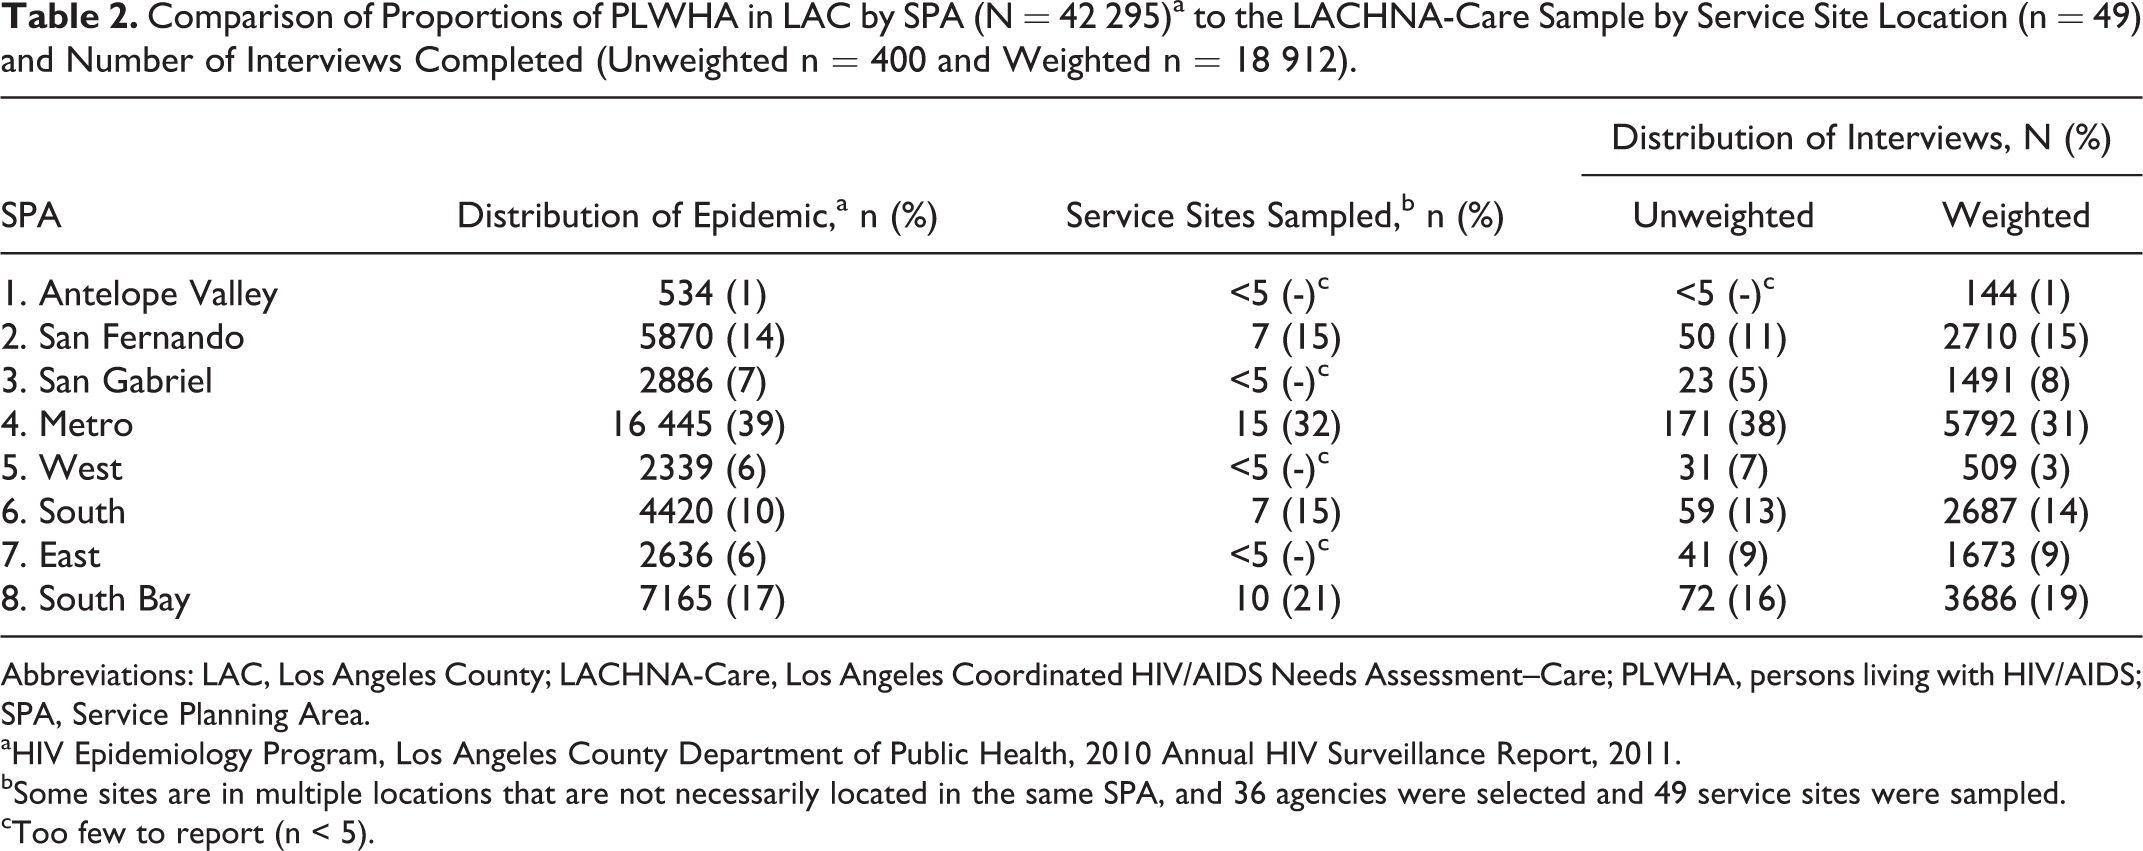
Abbreviations: LAC, Los Angeles County; LACHNA-Care, Los Angeles Coordinated HIV/AIDS Needs Assessment–Care; PLWHA, persons living with HIV/AIDS; SPA, Service Planning Area.
aHIV Epidemiology Program, Los Angeles County Department of Public Health, 2010 Annual HIV Surveillance Report, 2011.
bSome sites are in multiple locations that are not necessarily located in the same SPA, and 36 agencies were selected and 49 service sites were sampled.
cToo few to report (n < 5).
The proportion of respondents (both unweighted and weighted) who were aware of, needed, or utilized services is shown in Table 3 by service category. The gap between those who needed and those who received services is also shown. Awareness of at least 1 service ranged from 17% to 87%, and on average participants were able to identify 21 (45%) services (range 0-47). The highest ranked services by awareness were medical outpatient (87%) and psychosocial case management (84%), while awareness for hospice care (17%) and respite care (19%) were the lowest. Although not shown, analysis by service cluster revealed that awareness of at least 1 service within a cluster was greatest for the health-related services (99%) and least for the transportation services (79%).
Total Number and Proportion of the Awareness, Needs, Receipt, and Gaps in Care for All Ryan White Servcies by Service Clusters for LACHNA–Care Participants 2010 to 2011 (Unweighted n = 400 and Weighted n = 18 912).
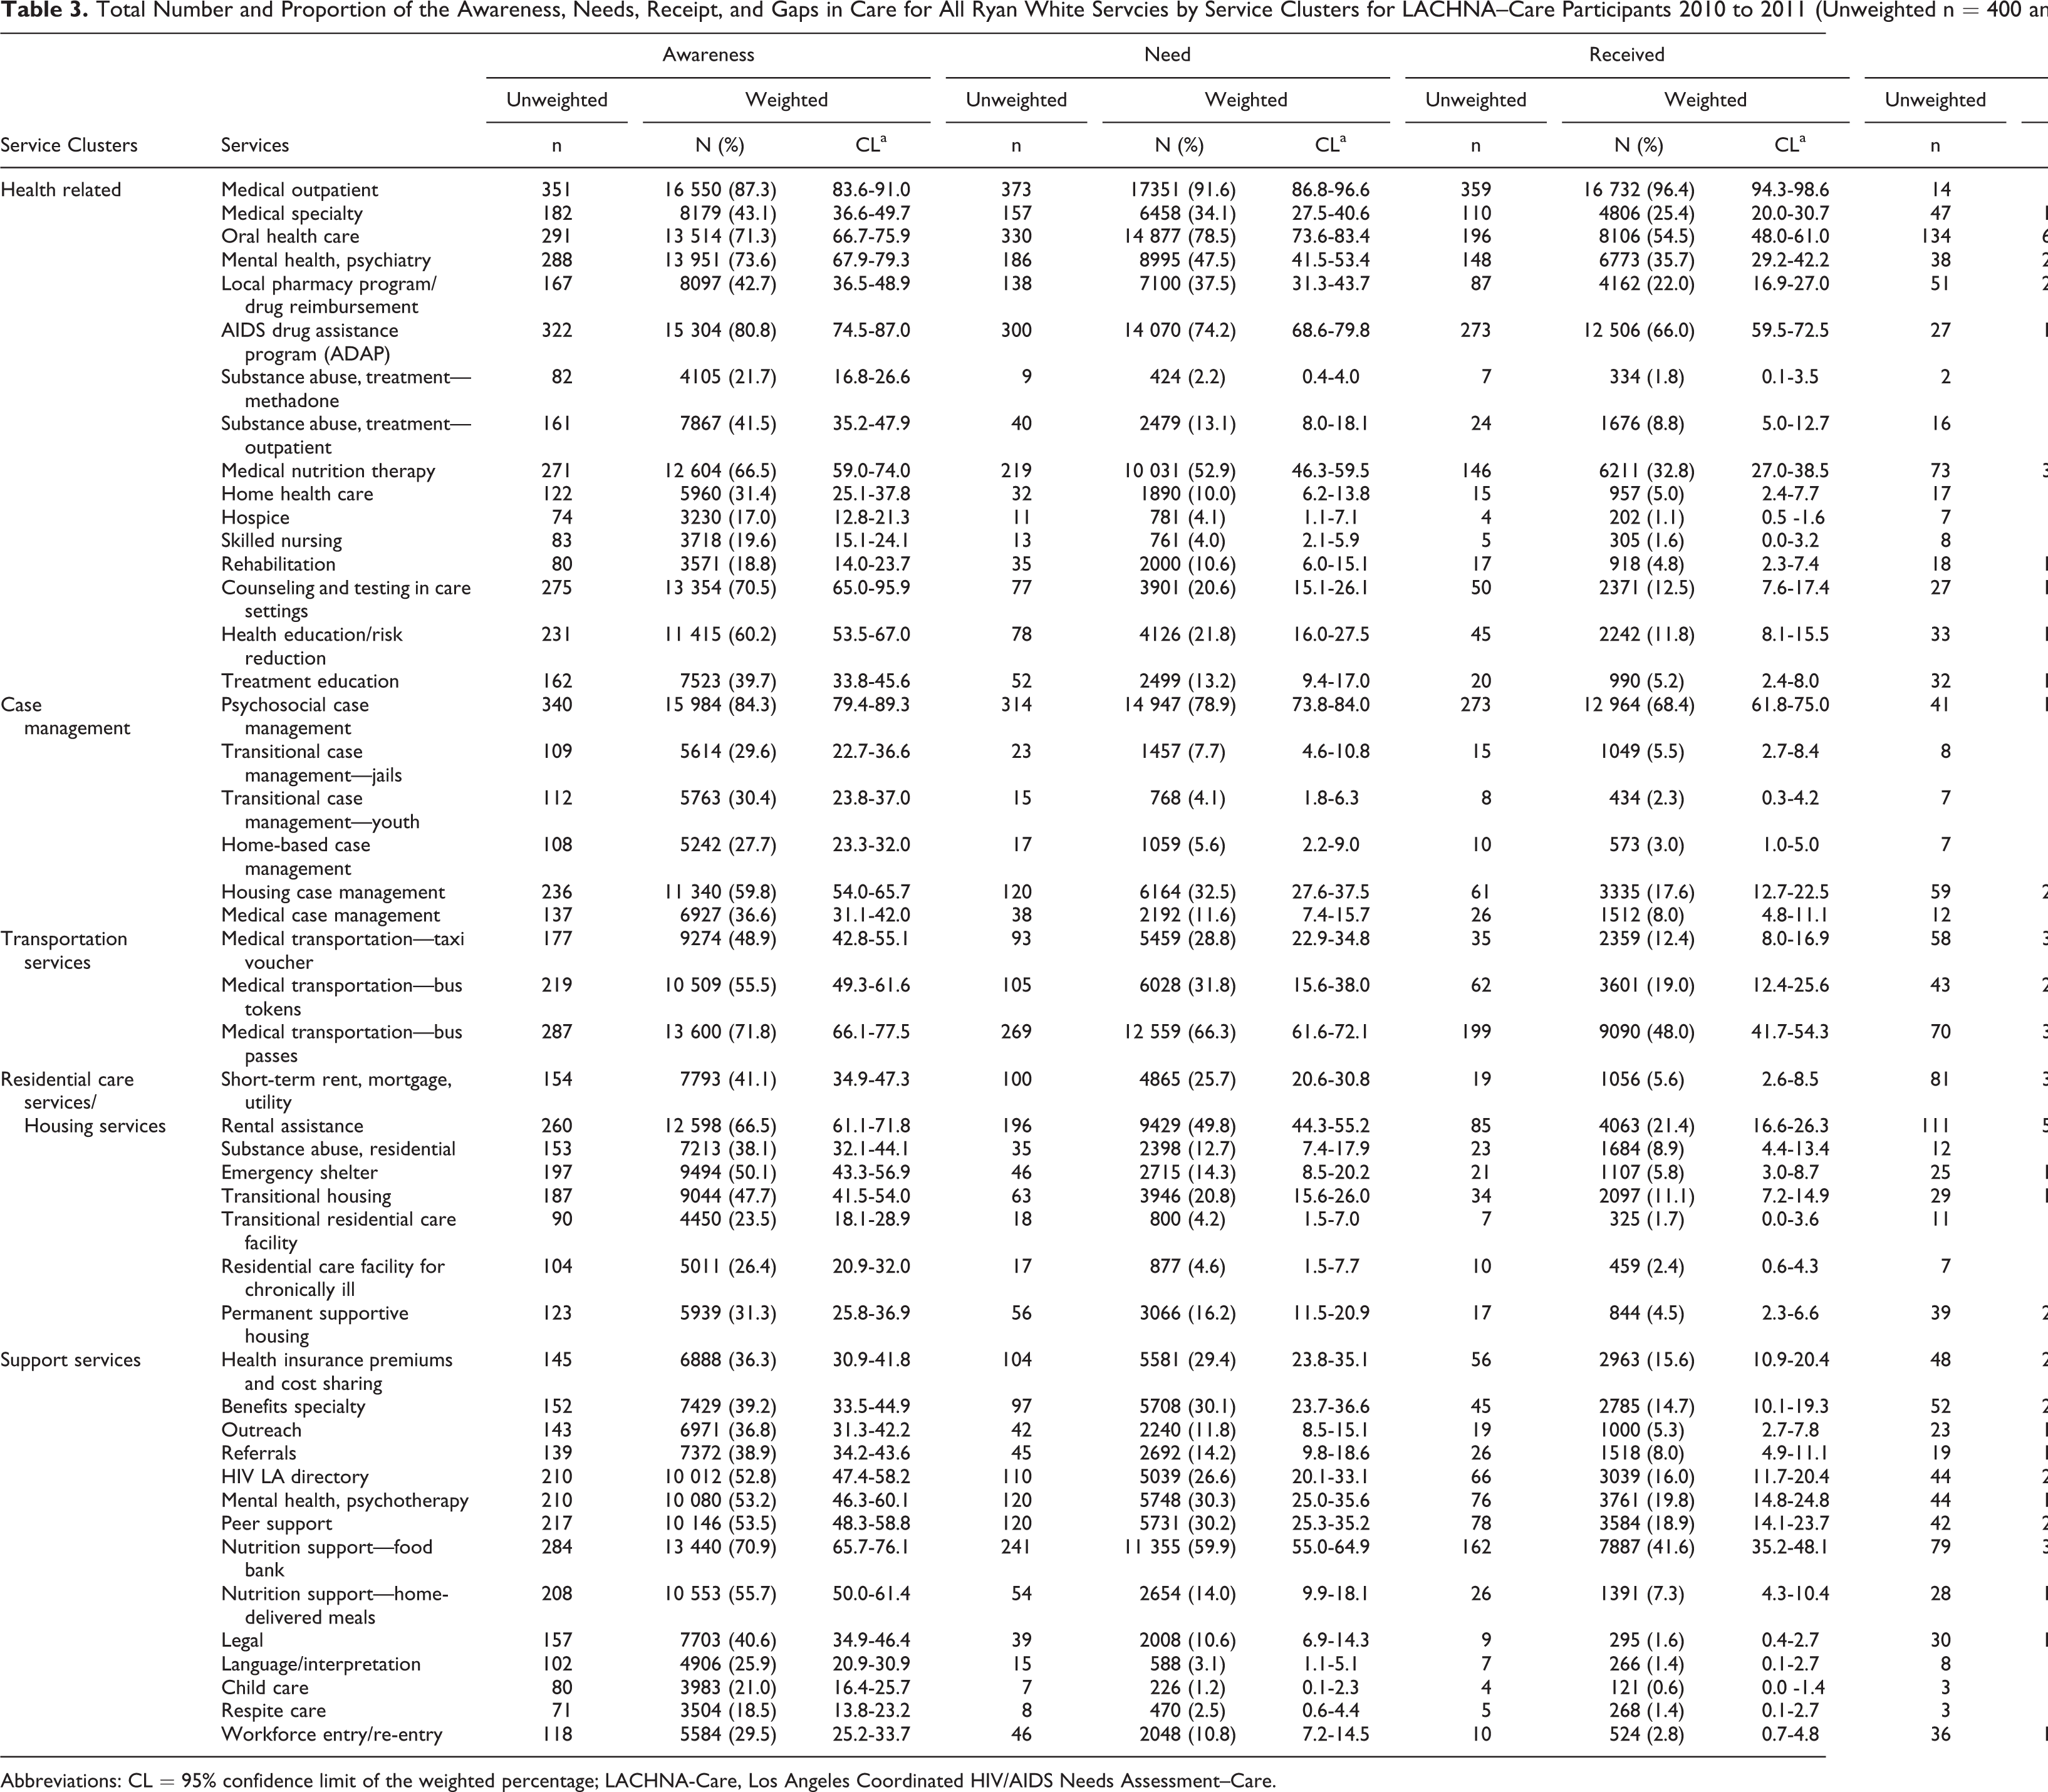
Abbreviations: CL = 95% confidence limit of the weighted percentage; LACHNA-Care, Los Angeles Coordinated HIV/AIDS Needs Assessment–Care.
Recent (past 12 months) service needs were greatest for medical outpatient services (92%) and oral health services (79%), while need was the least for child care (1%) and methadone treatment (2%). The proportion of respondents who needed a service ranged from 1% to 92%, with the average number of needed services being 12 (25%), with a range of 0 to 47. By service cluster, the greatest need was expressed for health-related services (99%) and the least for residential care and housing services (67%).
A wide range of services utilization was reported by respondents in the past 12 months, with hospice and child care services having the lowest utilization (<1%). Both medical outpatient services (96%) and psychosocial case management (68%) had the highest utilization. The average number of services received was 8 (16%) and ranged from 0 to 44. When analyzed by cluster, a high proportion of participants reported receiving health-related services (99%), while only 38% reported receiving residential care and housing services. Among received services, the majority of respondents stated they had no problems accessing services when needed (89%) and were generally satisfied with the services they received (89%).
The top 10 services for which respondents reported experiencing a gap, and the barriers associated with those gaps, are listed in Table 4. The majority of respondents reported at least 1 service gap (81%). The average number of service gaps respondents reported was 4 (8%) and ranged from 0 to 30. With respect to individual services, the largest gaps were found among those seeking either oral health (36%) or section 8 rental assistance (28%). Overall, respondents reported that individual barriers (ie, unawareness of service availability or location) were the major obstacles to accessing needed services. Although not shown, analysis by cluster revealed that service gaps were most common among those seeking residential care and housing services (64%), and least common among persons seeking case management services (30%). As with the individual services, within each service cluster, the majority of respondents reported individual barriers as the major reason they were unable to obtain needed services.
Service Gap Ranking and Barriers to Service Category for HIV-Positive LACHNA-Care Participants, Los Angeles County, January to June 2011 (Unweighted n = 400; Weighted N = 18 912).a

Abbreviations: LACHNA-Care, Los Angeles Coordinated HIV/AIDS Needs Assessment–Care.
aNR = <5 respondents, too few to report.
b% gap is the proportion who stated they needed a particular service minus the proportion who stated they received it.
cMay not add up to 100% due to small proportion of barriers that do not fit into categories or respondents refusing to state.
dToo much paperwork or red tape or too many rules and regulations.
eService provider was insensitive to my concerns, amount of wait time for an appointment or in the waiting room was too long, or the organization provided the wrong referrals.
fI was not aware that a service or treatment was available to me, I was not aware of the location of service(s), or I did not know who to ask for help.
Predictors of Service Gaps
Logistic regression analysis of weighted results identified predictors of gaps for any service. Additionally, separate analyses of reported service gaps for each cluster were also performed. Factors associated with reporting any service gap included being uninsured (RR = 3.0, 95% CI: 1.5-6.2), recent (past 6 months) illicit substance use (RR = 2.9, 95% CI: 1.3-6.4), reporting a past lapse in medical care of a year or longer since testing positive (RR = 2.8, 95% CI: 1.3-5.9), and reporting a recent mental health condition (RR = 2.1, 95% CI: 1.0-4.2).
Although not shown, when stratified by race/ethnicity, no variables were significant with respect to predicting gaps in care among whites. Among Latinos/Latinas, those who were uninsured (RR = 3.2, 95% CI: 1.6-9.2), reported recent substance use (RR = 6.0, 95% CI: 1.2-31.5), and were living at or below the FPGs (RR = 4.8, 95% CI: 1.6-14.7) were more likely to report a service gap. Also, persons interviewed in Spanish were almost 70% less likely to report a service gap compared to Latinos/Latinas interviewed in English (RR = 0.3, 95% CI: 0.1-0.9). Among African Americans specifically, service gaps were associated with recent substance use (RR = 31.0, 95% CI: 2.6-367) and reporting a lapse in care (RR = 32.3, 95% CI: 1.8-570).
Factors associated with reported gaps within an individual service cluster are shown in Table 5. For persons seeking health-related services, no variables were associated with reporting a gap. Among those seeking housing services, persons who had been recently incarcerated (RR = 13.5, 95% CI: 3.5-52.1), were uninsured (RR = 2.7, 95% CI: 1.3-5.6), and reported a recent mental health condition (RR = 3.8, 95% CI: 1.8-8.1) were more likely to report a gap, while women (RR = 0.3, 95% CI: 0.1-0.9), substance users (RR = 0.3, 95% CI: 0.1-0.9), persons who were retired or disabled (RR = 0.4, 95% CI: 0.1-0.7), and those interviewed in Spanish (RR = 0.3, 95% CI: 0.1-0.6) were less likely to report a gap in housing services. Among those seeking transportation services, recent incarceration (RR = 3.2, 95% CI: 1.2-8.4), mental health (RR = 1.8, 95% CI: 1.1-3.1), not currently receiving medical care (RR = 7.4, 95% CI: 1.8-30.6), longer commute times to doctors’ appointments (RR = 2.7, 95% CI: 1.4-5.3), and having less than a high school education (RR = 2.6, 95% CI: 1.2-5.4) were associated with gaps in these services. Among this same group, persons interviewed in Spanish (RR = 0.3, 95% CI: 0.1-0.3), and persons over 50 (compared to persons aged 24-45; RR = 0.5, 95% CI: 0.2-0.9) were less likely to report transportation service gaps.
Logistic Regression for Factors Associated with Reporting a Gaps in Services for LACHNA-Care Participants.

Abbreviations: CL, confidence limit; FPGs, Federal Poverty Guidelines; LACHNA-Care, Los Angeles Coordinated HIV/AIDS Needs Assessment–Care; RR, risk ratio.
a--Not a factor in this model.
b P < .01.
c P < .05.
dIncludes married, living together, and registered domestic partners.
eIncludes separated, divorced, and widowed.
fIncludes amphetamine, methamphetamine, marijuana, heroin, cocaine, crack, hallucinogens, and other nonprescriptions opiates/depressants; not including alcohol drinking.
gIncludes US citizens and legal residents.
hMI = reported mental health condition (past 12 months).
iHad HIV care appointment in the past 6 months.
jReported a lapse in HIV-medical care (of at least 12 months) since testing positive.
kInlcudes retired, homemaker, disabled, and student.
Among those seeking case management services, recent incarceration (RR = 4.0, 95% CI: 1.3-12.2), not currently receiving medical care (RR = 4.5, 95% CI: 1.5-13.1) and reporting longer commute times to doctors’ appointments (RR = 2.3, 95% CI: 1.0-5.1) were associated with an increased risk of reporting service gaps. Undocumented immigrants (RR = 0.3, 95% CI: 0.1-0.9) and persons older than 50 years of age (RR = 0.3, 95% CI: 0.1-0.6) were less likely to report a gap in case management services. Lastly, among those reporting gaps for other support services, persons reporting a recent mental health condition (RR = 2.4, 95% CI: 1.3-4.6) were more than twice as likely to report a gap. It should be noted that female respondents had marginal significance as well (RR = 2.0, 95% CI: 1.0-4.2, P = .053) with respect to an increased likelihood of social service gaps.
Discussion
The goal of the 2010 LACHNA-Care survey was to conduct a needs assessment for clients in the LAC RW system of care, which could be replicated in areas with similar populations. This was accomplished by evaluating clients’ awareness, need, utilization, gaps, accessibility, barriers, and overall satisfaction with available services. Based on local surveillance data, the demographic, behavioral, and geographic characteristics of LACHNA-Care survey participants were consistent with those of clients enrolled in the LAC RW system. When weighted, the sample size was consistent with that of the true RW population during the surveillance period. Additionally, the overall response rate for this study was high among selected clients. Thus, the outcomes of the 2011 LACHNA-Care survey can be considered a representative approximation of patients in the LAC RW system.
The majority of HIV-positive clients who responded to the LACHNA-Care survey reported that the services they received met their needs, with 89% stating that they were both satisfied with the services they received and that they experienced few access barriers. Among those reporting access problems, individual barriers were cited as the primary reason. In addition, services that had the greatest utilization among respondents, like oral health care (55%) and nutritional support (33%), also had some of the greatest access gaps (36% and 20%, respectively). Despite high service utilization by RW clients, there was a subset of HIV-infected LAC residents who were not accessing the full range of needed services. Beginning in 2011, as a result of these and other data, oral health services for HIV-infected low-income individuals have been expanded in LAC.
Although clients reported high satisfaction with the services they received, a majority of patients still reported experiencing at least 1 service gap over the previous year (81%). This proportion is much greater than that reported in a recent analysis of service needs among participants of the LAC MMP (35%), the mid-1990s HCSUS study (27%), a Chicago study of RW patients (47%), and northern California RW patients over a 4-month period (55%). 18,19,25,26 This discrepancy is likely due to the differences in the survey instrument and study aims. While the LACHNA-Care questionnaire inquired about an exhaustive list of available services (n = 47), MMP (n = 11) and HCSUS (n = 5) used a shorter selection. LACHNA-Care also inquired about multiple services within specific categories (eg, 6 types of case management services), while MMP and HCSUS asked questions only about general service categories (eg, case management and mental health services). In addition, LACHNA-Care was intended to capture utilization behavior across an entire system of care, as opposed to a smaller subset of general service categories.
Another possible explanation for the differences in findings across studies is that LACHNA-Care respondents were more socioeconomically disadvantaged compared to HCSUS or MMP. More LACHNA-Care participants either lacked insurance or had public insurance (94%) compared to participants in either MMP (77%) or HCSUS (68%), both populations of general HIV patients. Additionally, the proportion of participants earning over US $40 000 a year was much smaller in LACHNA-Care (7%) compared to either MMP (23%) or HCSUS (16%). It is evident that LACHNA-Care participants, and LAC RW recipients generally, are a uniquely vulnerable population of HIV infected persons, which may explain some of the differences in findings across these groups.
Although RW coverage was intended to fund medical and social service needs of low-income HIV-infected persons in the United States, studies have shown that insurance status continues to affect access to services. HIV Cost and Services Utilization study revealed that those with either public insurance or no insurance reported increased emergency department visits and later access to antiretroviral therapy (ART), compared to those with private insurance. 27 Also, a recent analysis revealed that payer type (eg, medicare, private, etc) continues to impact the timing of ART initiation for RW patients. 28 Still other studies have shown that insurance has no effect on need or use of ancillary services among RW recipients. 29
HIV-infected patients who engage in substance use are more likely to report irregular care, poor ART adherence, and utilize hospital emergency departments to receive care more than patients who do not abuse substances. 30 -32 Bell et al 33 found that among a sample of HIV-infected crack cocaine users, factors associated with reduced care were low income, no history of drug treatment, and not receiving appropriate support services. Factors like housing insecurity, socioeconomics, and mental health status have all been independently linked to poor disease outcomes for HIV-infected individuals. In addition, this investigation found that substance use was associated with reporting a service gap for Latinos/Latinas and African Americans, highlighting an important access disparity that warrants further investigation.
In addition to results for service gaps overall, mental health issues were also associated with service gaps among those seeking housing, transportation, and other social services. Mental health disorders (such as depression, anxiety, schizophrenia, and bipolar disorders) affect up to 50% of HIV-infected individuals at some time during their illness. 34,35 Research on mental illness among HIV-infected populations has consistently shown that depression has a negative effect on ART adherence and is associated with increased mortality. 36 -38 These results support other findings linking mental health to poor HIV care among RW recipients, but this is the first investigation to link mental health with an increased need for ancillary service gaps. 39
When results were stratified by race/ethnicity, Latinos/Latinas reported disparities in service gaps based on both insurance and low socioeconomic (≤FPGs) status. These findings are consistent with national findings from HCSUS in which low income was associated with unmet needs for dental and medical care for all racial/ethnic groups. 40 Also from HCSUS, Morales et al 41 reported that among Latinos/Latinas participants, insurance status was correlated with poor access to care, however, in this sample, monolingual Spanish speakers were less likely to report a service gap, a topic to explore in future evaluations. Among African Americans, a past lapse in care and current homelessness were also associated with reporting a service gap. Associations between homelessness and service gaps are consistent with national findings and highlight the impact of inadequate housing on access to and use of publicly funded HIV services. 42,43
Although factors associated with gaps varied by severity of risk within a specific service, findings were generally consistent across models (eg, recent incarceration, mental health, insurance status, and language of interview). The major exceptions to this were among women and substance users. Women were found to be twice as likely to report a gap in social services, but 70% less likely to report similar gaps for housing. Also, even though substance use was associated with reporting service gaps overall, it was shown to be protective with respect to reporting a gap in housing services and was not significant in any other service category. These findings are inconsistent with previous research showing an association between recent substance use and a gap in health-related services among RW patients in San Francisco. 44
Several results echo national findings related to medical care status and reporting gaps in services. For example, recently incarcerated persons reported an increased gap in housing, transportation, and case management services. These results support other findings that have linked HIV-infected persons with incarceration histories to poor ART adherence as well as suboptimal patterns of HIV care. 45,46 HIV-infected persons recently released from prison have also been shown to have difficulty in obtaining consistent medical care and ART prescriptions. 45,47 In addition to losing insurance benefits, inmates often forfeit important social services like case management or housing services that they were previously receiving. 48,49 A study of social service needs among HIV-infected prisoners revealed that the majority of service needs (such as medical care and housing) often go unmet upon release. 50
This study is not without limitations. First, the sample was limited to individuals receiving at least 1 HIV service and does not attempt to capture information from HIV-positive persons not receiving any RW support. Persons who received services at more than 1 agency, or who visited the same agency several times during the study period, may have been overrepresented in the sample, however, adjustments to the analysis weights attempt to compensate for these potential duplications. While attempts were made to capture information on RW-funded services only, several services have multiple funding streams, making it difficult to provide mutually exclusive results. In addition, overestimations for some services (eg, residential care and housing) may have been reported, as they have strict eligibility requirements, making some clients ineligible. Also, even though standard sample size calculations determined 400 respondents could estimate the population, this limited certain types of subgroup analysis performed.
A final limitation is a potential confounding issue related to co-location of services. Participants reporting gaps in primarily medical care may also have a greater likelihood of reporting other types of social service gaps, as these are oftentimes co-located. Potential examples include persons who reported service gaps for case management and transportation and were more likely to be out of care. It is unknown how substantial this issue may be, as so few persons sampled were truly out of care (n = 24) according to the Health Resources and Services Administration definition. 2
The sampling, weighting, and analytic method presented may serve as an effective template for similar populations conducting generalizable needs assessment to satisfy RW and other funding requirements. As this survey effectively described the current needs of LAC patients within the RW system in 2011, proposed federal changes in how this program will be administered in the future may offer new challenges. 51 These results can serve as an reliable description of the current system, while future research focusing on changes in patient experiences under a different delivery mechanism will be important for improving both HIV service delivery and future RW-funded service assessments.
Footnotes
Acknowledgments
The authors would like to acknowledge the clients and providers who participated in this project; Christopher Moore, Yajaira Gomez, Juli-Ann Carlos, Judith Tejero, Mike Janson, Juhua Wu, Carlos Vega-Matos, Jacqueline Rurangiwa, Jesse Bendetson, Alla Victoroff, and Natasha Ludwig-Barron of the Division of HIV and STD Programs; Dawn P. McClendon of the Los Angeles County Commission on HIV; AJ King of the California STD/HIV Prevention Training Center; and Commissioners of the Los Angeles County Commission on HIV who assisted in evaluating the survey.
Declaration of Conflicting Interests
The author(s) declared no potential conflicts of interest with respect to the research, authorship, and/or publication of this article.
Funding
The author(s) received no financial support for the research, authorship, and/or publication of this article.