
Abstract
This paper examines the determinants of non-COVID excess deaths during the COVID pandemic between January and June 2020. These are the extra deaths occurring during the pandemic which are not directly attributable to COVID. While emerging literature examines the determinants of COVID deaths, few look at non-COVID excess deaths, though early estimates suggest they are enough to be seen as a pandemic in their own count. We investigate the impact of factors including COVID deaths and cases, lockdown stringency, economic support and search intensity for non-COVID conditions on excess deaths, using Fixed Effects and GMM estimations. We also use quantile regression to assess the differential impacts of the variables at different stages of the excess death distribution. First, we find that excess deaths are increasing and concave in COVID deaths, and that the rate of growth, as well as the level, of COVID deaths has a significant and positive impact. Second, we find some evidence that stringency of lockdown increases excess deaths by a maximum of 16 extra per-million population. Third, we find a reduction in search intensity for other conditions significantly increases excess deaths, implying that policymakers should ensure public health messaging for other conditions during a pandemic.
Introduction
The COVID-19 pandemic is estimated to have killed 976,000 people and cost US$8.8 trn worldwide as of September 2020. While much economic literature, including Desmet and Wacziarg (2020), McLaren (2020) and Ciminelli and Garcia-Mandico (2020b), investigates reasons for differences in COVID deaths worldwide, less examines the so-called excess non-COVID deaths, or collateral damage of the pandemic, though these are significant. The ONS argues they numbered 6,000 in the UK in March and April alone, occurring as people avoid healthcare facilities, due to fear of COVID, and as overstretched healthcare facilities delay and cancel treatment for other conditions. Numbering 19 excess per 100 COVID deaths concurrently (Forchini et al.), with more likely following from delayed diagnosis and treatment for other conditions today, the scale of excess non-COVID deaths is large enough for it to be seen as its own pandemic.
Excess non-COVID deaths (hereafter referred to as excess deaths) refers to the total week wise number of deaths above the expected, which are not explained by COVID.
They are defined as:
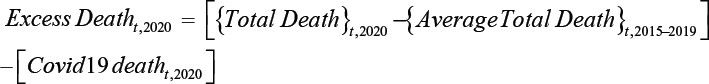
where t is the sample week.
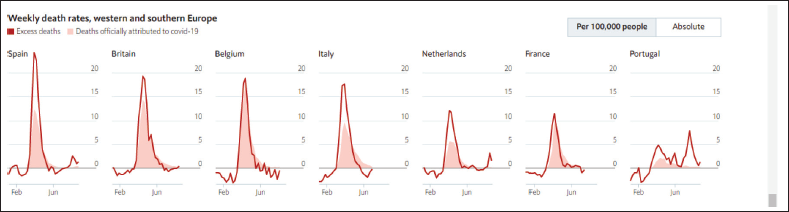
Forchini et al. (2020) place excess death at 19 per 100 COVID deaths, Docherty et al. (2020) at 38 for every 92 COVID death, and Vandoros et al. (2020) at 968 per week in England and Wales. Figure 1 shows that excess deaths from the pandemic exceed reported Covid deaths in every country. These papers cannot distinguish direct excess deaths, accounted for underreporting of COVID on death certificates, from indirect deaths, caused by extra deaths from non-COVID conditions. However, evidence suggests many are the latter. John Chisholm of the BMA medical ethics’ committee writes as hospitals become ‘overwhelmed’, difficult decisions must be made about who receives life-saving treatment. Non-COVID alongside COVID patients are impacted. An American Cancer society survey indicates 1 in 4 patients have had treatment delayed (American Cancer Society Cancer Action Network, 2020), with similar delays in the UK where 35,000 extra cancer deaths are expected from lack of screening and treatment due to COVID-19 (BBC News, 2020). Resources such as doctor time, hospital beds, and blood, have been rationed, leading sometimes to death (Grady, 2020). The Office of National Statistics (ONS), UK notes changes to social care may result in 16,000 excess deaths concurrently, with more following.
Other excess deaths result from patients choosing not to access healthcare, even when available. One poll finds half of cardiologists report a 40–60% reduction in heart attack admissions (Krumholz, 2020). Since it is unlikely lifestyle changes have led to this large a reduction, patients are likely delaying coming in due to COVID fears, leading to permanent damage or death. In March, the excess number of heart attack deaths in Austria exceeded the COVID death toll (Kolata, 2020). Spain has seen a 40% reduction in treatment for myocardial infarction (MI) (Rodríguez-Leor et al., 2020), and Tam et al. (2020) report time from symptom onset to presentation at healthcare facility for ST-segment–elevation myocardial infarction has increased from 82 to 318 hours in Hong Kong. Moreover, excess deaths can result from policies managing the pandemic, such as lockdowns. These have caused GDP to fall 20.4% in the UK and 45% in India, potentially resulting in deprivation and economic anxiety (Fetzer et al., 2020), and poor mental health (Browder et al., 2020). UK depression has risen from 1 in 10 to 1 in 5, alongside rising domestic abuse deaths and alcohol abuse.
However, excess deaths may be pushed down by reduced pollution and fewer traffic and work accidents. In South Africa, an alcohol ban and fewer road accidents have caused negative overall excess deaths, while the ONS estimates 3,000 fewer deaths resulting from stringency measures. ‘Mortality displacement’, occurring when already critically ill patients are killed by COVID rather than other conditions, can also push excess deaths downwards, as current and future deaths from these other conditions decrease. Noymer (2011) found that following the Spanish flu, tuberculosis mortality reduced. There is already some evidence of this: though long-run cancer deaths are expected to increase from the pandemic, Felix-Cardosa et al. (2020) point out that Scottish data shows a reduction in cancer as cause-of-death during the peak, suggesting some critically ill died of COVID. Spiegelhalter (2020) even suggests that the reduction in excess non-COVID mortality could fully offset COVID mortality, making overall excess deaths zero by the end of 2020.
From a policy perspective, knowing the determinants of excess deaths will likely prove vital. The pandemic is far from over, with excess deaths expected to continue for the next few years, and COVID deaths still climbing in Latin America and elsewhere. Rainforest destruction is also creating a ‘perfect storm’ for spread of future pandemics (Gibb et al., 2020). It is vital to know the causes of excess deaths, as not only are they numerous during this pandemic, but they may also occur from the same causes in future pandemics, particularly if similar policy responses are used.
This paper seeks to find the impact of ‘COVID deaths and cases’, ‘lockdown stringency’, ‘economic support’, ‘hospital beds’ and ‘search intensity for other conditions’ on excess-deaths. We use similar tools to Desmet and Wacziarg (2020) who assess the correlates of COVID deaths, applied to the less-researched area of excess-deaths. We first use Pooled OLS. To correct for endogeneity issues, such as COVID and excess deaths being determined simultaneously due to measurement error, we extend to Fixed Effects, GMM and IV. The latter tells us the causal impacts of variables on excess deaths. We also use quantile regression, to find the differential impacts of the explanatory variables on excess deaths at different stages of its distribution. We find a significant positive and concave effect of COVID on excess deaths, while stringency measures increase excess deaths, and search intensity for non-COVID conditions, such as stroke, reduces them. Our paper is one of the first to investigate excess deaths in a systematic way, shedding light on their causes, and provides policy recommendations about how future excess deaths may be reduced. The second section reviews the current literature. The third section describes the data and methodology. The fourth section presents and discusses the results. The fifth section concludes.
Literature Review
Literature Within the Economics Discipline
A large body of literature assesses causes of COVID mortality during the 2019–2020 pandemic. Desmet and Wacziarg (2020) use a cross-country panel to examine factors affecting US COVID deaths. They carry out regressions both at the same point in time and at the same point in the pandemic, finding population, public transportation, nursing home capacity and other factors significantly affect death toll. Beach et al. (2020) conduct similar analysis for Spanish flu. They use differences-in-differences on a sample of 298 US cities, finding poverty, onset timing and pollution affect deaths. McLaren (2020) regresses US cross-county race on mortality, then adds controls, finding that most of the racial disparity in COVID deaths is explained by socioeconomic factors and public transport use. Other studies investigate causal effects; Ciminelli and Garcia-Mandico (2020a) analyse through difference-in-differences lockdown’s effect on mortality. None of these studies specifically examines excess deaths.
Literature also assesses pandemics’ secondary health and economic impacts, especially regarding the Spanish flu. Almond (2006) assesses whether in utero exposure affects disability rates and subsequently excess non-flu deaths. He compares the cohort in utero during late 1918 to the long-run disability rate trend, finding it 20% higher. Much literature has looked at the economic effects of pandemics, with implications for deprivation. Barro et al. (2020) run a panel regression of 1918 Spanish flu deaths on GDP and consumption, finding that it reduced GDP and consumption by 6% and 8% respectively. Basco et al. (2020) found a large, negative effect of flu-related deaths on wages, increasing poverty amongst urban workers. Correia et al. (2020) find flu had a negative effect on employment and output. These all indicate separate channels leading to excess non-virus deaths, but to the best of our knowledge, no economic studies have previously looked at all indirect excess deaths occurring.
Epidemiological Literature
Epidemiological literature provides more insight into excess deaths. Since cause-of-death data, revealing the number of deaths from each condition, has mostly not been released, much literature estimates the scale of excess deaths. Forchini et al. (2020) calculate excess deaths across UK regions and age groups by estimating expected deaths through a time series model. They find 19 excess deaths per 100 COVID, highest among men aged 45–64 and over 75s and in high COVID death regions. This raises questions that some deaths may be underreported COVID, which the authors emphasize they cannot distinguish from true excess deaths.
Docherty et al. (2020) quantify the number of excess deaths by calculating expected deaths as the past three years’ average in five European countries and New York. They further indicate many are genuinely non-COVID. Scottish cause-of-death data shows 10% of overall excess deaths are Alzheimer’s and 7% cardiovascular diseases. The former links to reports of neglect of the elderly, causing numerous excess deaths in care homes (Diamantis et al., 2020; Heneghan & Jefferson 2020). They estimate a greater excess to COVID death ratio, 38 to 92. Vandoros et al. (2020) use differences-in-differences to estimate 968 weekly excess deaths in England and Wales. All papers above suggest some deaths are spillovers from other conditions. Felix-Cardosa et al. (2020), who use homologue periods to estimate expected deaths, point to the lack of ARB treatment for MI as one example.
Literature also examines the impact of stringency on excess deaths. Though lockdowns are likely to contribute to excess deaths by increasing deprivation, causing GDP to fall 20.4% in the UK and 45% in India, Correia et al. (2020) contest this. They argue the pandemic itself, not lockdown, has negative economic impacts. The ONS paper on direct and indirect COVID deaths estimates lockdown will lead to 3,000 fewer deaths from work and traffic accidents, alcohol misuse and childhood infectious diseases. However, lockdown negatively impacts mental health: Browder et al. (2020) use differences-in-differences and find a severe effect, which may increase excess mortality. Fetzer et al. (2020) utilize Google Trends data to find lockdown increases economic anxiety, which could contribute to excess deaths: as Vandoros et al. (2018) show, economic anxiety is linked to short-run suicide increases. However, Ding et al. (2020) indicate lockdown’s positive impacts. They use Google Trends data to show interest in exercise has reached an all-time high, its positive health implications balancing out the negative impacts of increased sedentary activity during lockdown.
This paper firstly contributes to the literature by estimating the relationship between excess and COVID deaths across a much broader range of countries than current literature (England and Wales, as examined by Forchini, Felix-Cardosa and Vandoros, five European countries of Docherty et al.). Second, it uses econometric tools to discuss the impacts of other variables, including stringency, search intensity for other conditions, and hospital beds, on excess deaths, enabling us to provide policy guidance on a topic not explored by much economic literature. Third, we add to the literature on stringency by discussing lockdowns’ impacts on excess deaths. Fourthly we use quantiles to discuss how variables have different impacts depending on the level of excess deaths.
Variables, Data and Identification Strategy
Variables
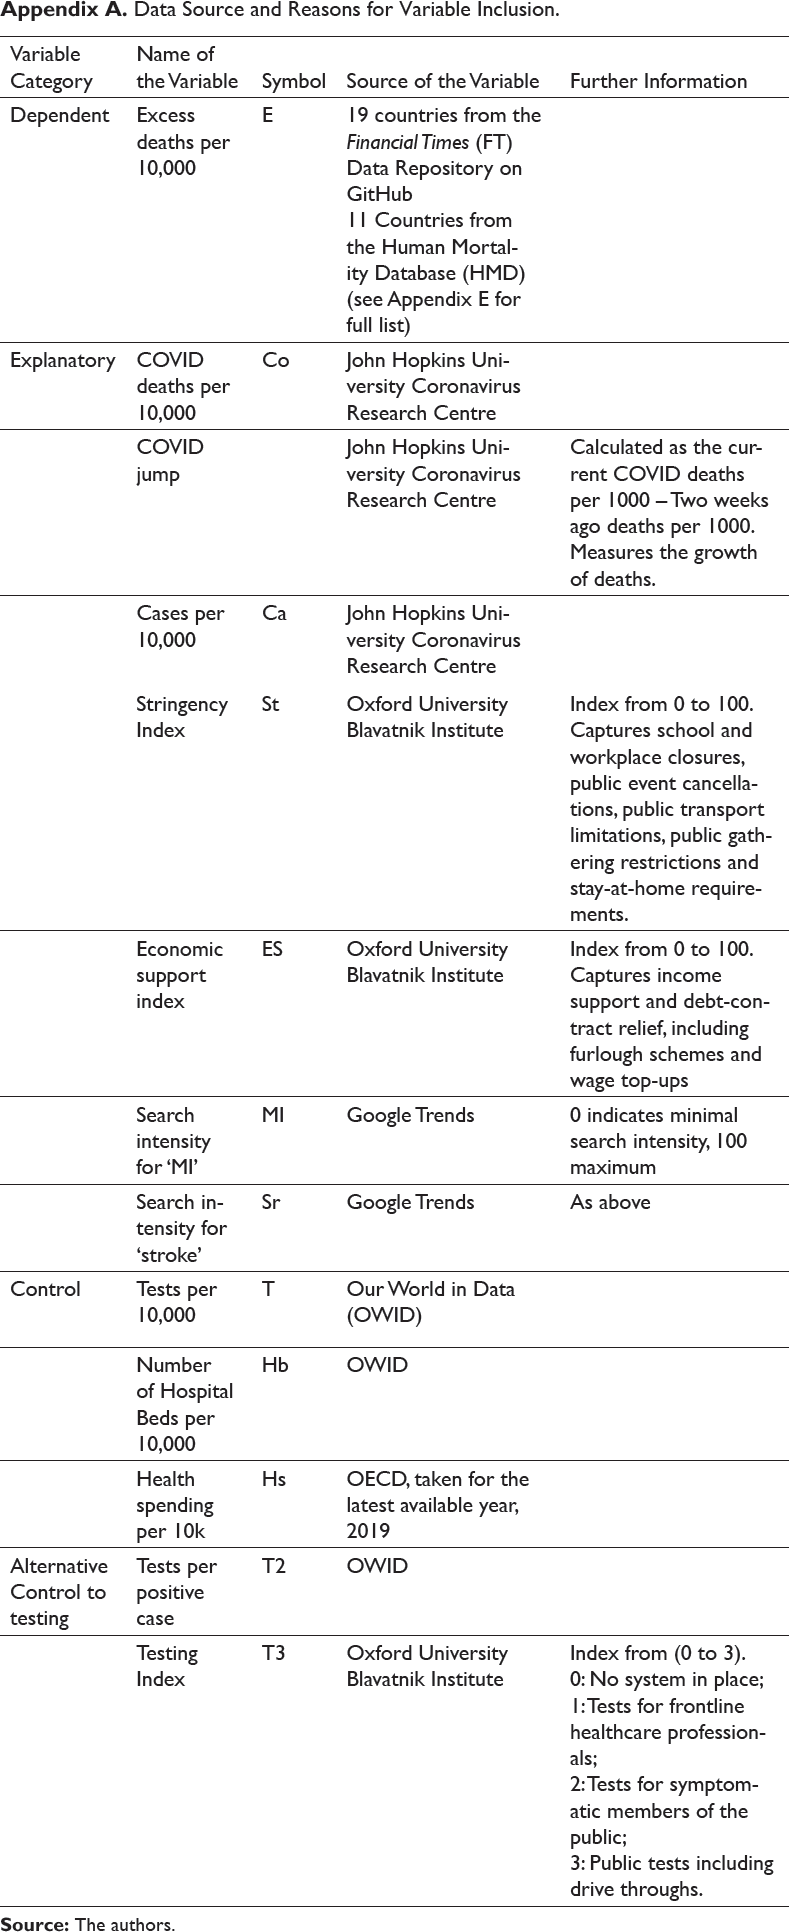
In our analysis, the main dependent variable is ‘weekly excess deaths’ and the main explanatory variables are ‘weekly COVID deaths’, ‘weekly number of cases’, ‘value of stringency index’, ‘economic support index’, Google search results for ‘myocardial infarction (MI)’ and ‘stroke’, with a set of country-level controls. A full table of data sources and reasons for each variable’s inclusion is given in Appendix A. The unit of study is country, hence our cross-section dimension is country, and our time series dimension is week. We have 30 countries for 7–22 weeks, hence are working with an unbalanced panel with n = 642 total observations.
Data
Data on excess and COVID deaths and cases are taken per 10,000 to normalise and make them comparable with other countries. This was chosen over the P-score, as developed by Oxford (Giattino et al., 2021), as it was available for a broader range of countries in the Financial Times (FT) data set and Human Mortality Database (HMD).
Testing data from Our World in Data (OWID) was collected from individual countries’ databases so was only available for the period in which countries were actively carrying out testing. As a result, our number of observations with testing included is reduced from 642 to 380. There are potential limitations to both the excess deaths and COVID deaths figures:
Cross-country heterogeneity: COVID deaths in the FT data set and John Hopkins University are collected from countries’ databases and reflect their individual recording policies. Some countries require a COVID test before death while others need a doctors’ diagnosis. Some include all deaths, whereas others such as the UK initially included only those occurring in hospitals though many occur at home (Howdon & Heneghan, 2020). This introduces a source of cross-country heterogeneity discussed in Subsection ‘Methodology’.
Measurement error: In both the FT data set and countries added from the HMD, excess deaths are calculated by subtracting COVID deaths from overall excess deaths, introducing measurement and correlation error. For the same total excess deaths level, an extra registered COVID death leads to one fewer registered excess non-COVID death, introducing negative correlation between the two variables. Our coefficient may be downward biased. COVID deaths, and therefore excess deaths, are also highly correlated with testing policy (Felix-Cardosa et al.). Methods used to reduce this problem are discussed in Subsection ‘Methodology’.
Methodology
This paper seeks to estimate the impact of explanatory variables including COVID deaths and cases, stringency, economic support, search results for ‘MI’ and ‘stroke’, hospital beds and health spending on excess deaths. In estimating this, there are three main econometric issues leading to endogeneity. This is when explanatory variables have a non-zero correlation with the error term, breaking the orthogonality assumption and making their coefficients biased and inconsistent. These problems must be solved before causal impact can be inferred.
First, omitted variable bias occurs when a third variable is correlated with one or more explanatory variables and the error term. If omitted, the third variable impacts excess deaths and the explanatory variable simultaneously, and some of its effect is captured by the explanatory variable, biasing its coefficient. Omitted relevant variables can be time-invariant, meaning unchanging within countries over the sample period. Diabetes incidence, for example, which varies from 10.4% in the US to 4.8% in Sweden, increases both COVID deaths (Apicella et al., 2020) and excess deaths, as diabetic episodes untreated due to healthcare system strain can be fatal. When omitted, some of diabetes’ positive effect on excess deaths is captured by the COVID coefficient, biasing it upwards. Other health conditions, unobserved health system differences, poverty, inequality and air pollution are other likely sources of omitted variable bias. Resultingly, explanatory variable coefficient significance may occur due to unobserved differences between countries rather than causal effect.
Omitted variable bias also results from time-varying factors. A sudden change, such as the WHO’s declaration of the virus as a pandemic on 11th March, may plausibly have led to both a reduction in COVID cases and deaths, as governments and the public take the virus more seriously, and an increase in excess deaths through increased anxiety, as was observed when the UK entered lockdown (Bentall et al., 2020). Here we expect bias of the COVID coefficient towards zero. However, the 30–40% nitrogen oxide decrease in UK cities (University of York, 2020) likely decreased both COVID and non-COVID deaths, being a risk factor for COVID (Fattorini, 2020; Frontera et al., 2020; Zhu et al., 2020) and MI and COPD, biasing the COVID deaths coefficient upwards. Hospital capacity expansions and care improvements also likely decreased COVID and excess deaths simultaneously.
Measurement error, particularly affecting COVID cases and deaths and excess deaths, can also cause endogeneity. Due to testing systems’ low coverage, Aspelund et al. (2020) estimate 80–90% of Icelandic cases are undetected, and this varies between countries. COVID deaths are also underreported (Hortacsu et al., 2020; Nishiura et al., 2020). Where measurement error does not affect the means of variables, this may not bias coefficients. In this case, however, for the same overall excess deaths, an extra registered COVID death leads to one fewer registered excess death, introducing negative correlation between the two variables. The COVID coefficient may be downward biased.
Lastly, reverse causality occurs when excess deaths cause changes in explanatory variables rather than the opposite. This is unlikely: excess non-COVID death figures are not widely known, and estimates of their scale vary between experts. Forchini et al. place them at 19 per 100 COVID, Vandoros et al. at 968 per week. It is unlikely that governments and individuals, whose choices affect COVID cases, deaths and stringency decisions, base their choices on these little-known figures. Nonetheless, it is possible noticeably high excess deaths in some areas change behaviours, affecting COVID. For all of these reasons, endogeneity is present and particularly affects the COVID coefficient.
Model 1: Pooled OLS
Initially, to estimate conditional correlation of the explanatory variables on excess deaths, we carry out Pooled OLS. The model regresses explanatory variables on excess deaths, minimizing the residual sum of squared deviations (RSS) from the mean. The results tell us conditional correlation, but multiple endogeneity issues prevent causal interpretation:
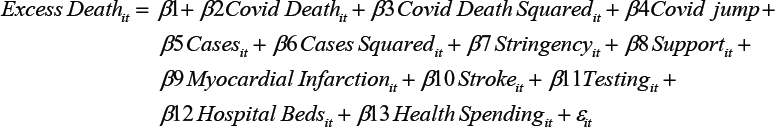
where i is country and t is week.
Model 2: Fixed Effects
The Fixed Effects model is an improvement on Pooled OLS, as it removes endogeneity caused by time-invariant omitted relevant variables. Cross-country differences that do not change over time, including prevalence of health conditions, are removed by demeaning, so no longer cause bias. To prevent the time-invariant variables hospital beds and health spending being omitted, we interact them with the week dummy:
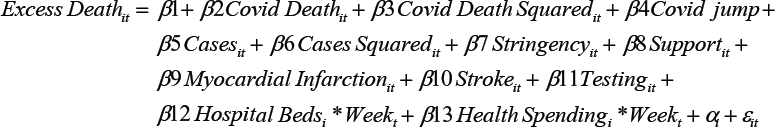
Here i is country and t is week, and αi is the country fixed effect. We also add interaction terms. Stringency*cases tests the joint effect of these two variables, which is possible if high cases affect the attention paid to stringency measures, impacting excess deaths. Stringency*tests is included, as there may be an interaction effect here. Fetzer et al. (2020) suggest stringency itself does not affect COVID or excess deaths, but correlates with testing which impacts them. We also trial a two-week lag of cases, as these typically take two weeks to get to hospital. If cases increase excess deaths by overstretching healthcare facilities, we expect lagged cases to be more significant than concurrent cases.
Although the Fixed Effects model reduces endogeneity problems, it cannot correct for endogeneity caused by time-varying omitted relevant variables, measurement error and reverse causality, the former two of which are likely to still be present. Robustness checks must be used, in the form of GMM and IV.
Model 3: GMM
Generalized Method of Moments (GMMs), requiring fewer assumptions than OLS, deals with endogenous regressors, such as COVID deaths. It also tackles autocorrelation, potentially useful as excess and COVID deaths follow a strong time trend, and may be determined by their previous values. GMM uses moment conditions as internal instruments to tackle endogeneity. These must be relevant (correlated to the endogenous regressor) and valid (uncorrelated with the error term) (Holtz-Eakin et al., 1988). In the first stage regression, instruments are regressed on the endogenous regressor, COVID deaths. If these are relevant, significant p-values and F-statistic should be produced. In the second, instruments are regressed on the dependent variable, excess deaths. Since these instruments are uncorrelated with the error term of the second stage equation, the orthogonality assumption is satisfied and endogeneity removed. The second stage is then scaled up by the first stage to indicate the effect of COVID deaths on excess deaths.
Difference GMM generates valid and relevant instruments by transforming the regressors through differencing, then instruments the endogenous regressor with its level value (Arellano & Bond, 1991). In our model, the change in COVID deaths is instrumented with the COVID death level, which is correlated with the COVID death change but uncorrelated with the change in error term. System GMM uses both the differenced equation with the level as instrument, and the level equation with the first difference as instrument (Arellano–Bover, Blundell–Bond). Both methods are carried out. We use the rule of thumb discussed by Bond et al. (2001) to ascertain which is best. As the Difference GMM coefficient on COVID is close to the fixed effects coefficient, we conclude it is downwardly biased, so System GMM is chosen, which is also advantageous in minimizing data loss given the unbalanced panel. We further use two-step GMM, increasing robustness to heteroscedasticity and autocorrelation (Roodman, 2009). All results are reported in Appendix C.
GMM requires that endogenous and exogenous regressors be stated. COVID deaths are treated as endogenous for reasons argued above. Not all variables can be treated as endogenous as the number of instruments must be kept small relative to the number of groups (Roodman, 2009). Overly numerous instruments can overfit the endogenous variables, biasing coefficients towards OLS results (Roodman, 2009; Tauchen, 1986; Windmeijer, 2005). This is important given our small number of countries. We argue cases can be treated as exogenous. Policies affecting excess deaths do not necessarily affect cases simultaneously, as is the case with COVID deaths. For instance, as of late August, care improvements have contributed to falling COVID and excess deaths, leading to upward bias of the COVID coefficient, but cases remain high (Stabe et al., 2020). Stringency is also treated as exogenous, as stringency decisions are likely based on COVID cases and deaths, which are controlled for, rather than excess deaths.
As an additional robustness check, we also use IV, which similarly solves the endogeneity problem by using instruments for the endogenous regressor COVID deaths. The instruments are correlated with COVID deaths (relevant) but uncorrelated with the error term (valid). Whereas GMM uses internal instruments from within the data set, IV requires that external instruments are selected. However, we are not reporting the IV results in this paper but if needed we would be happy to provide this.
Model 4: Quantile Regression
As a further extension, this study aims to find out how the explanatory variables, such as COVID deaths, stringency, and searches for other conditions, affect excess deaths at different stages of the excess death distribution. It tells us whether variables including COVID deaths and stringency have different impacts when excess deaths are high compared to when they are low.
Pooled OLS, Fixed Effects and GMM tell us the effect of the explanatory variables on excess deaths at its mean value, minimizing the residual sum of squared deviations (RSS) from the mean of the excess death distribution. Quantile regression instead minimizes the RSS from the median. When other percentiles are specified, for instance, the 25th, 50th and 75th, quantile regression divides the distribution into four and minimizes the RSS from these. This has two main advantages over OLS. First, using the median rather than the mean, quantile regression is less affected by extreme values. Second, using percentiles tells us the differential effects of the explanatory variables at different levels of excess deaths. For instance, a larger coefficient on stringency at the 75th percentile than at the 25th would tell us that stringency increases excess deaths more when excess deaths are already high, during the pandemic’s peak, than when they are low. We aim not only to find the explanatory variables’ impact, but to see whether they have the same impact throughout the pandemic, or whether it varies depending on the excess death level.
Results and Discussion
Exploratory Analysis
The next section presents exploratory analysis. Exploratory analysis shows mostly expected correlations between explanatory variables and excess deaths. Excess deaths peak simultaneously with COVID deaths, around mid-April. This is interesting, as we expect some to occur with a lag, such as extra cancer deaths from reduced treatment. This may indicate that the majority of excess deaths appearing in the figures are people dying straight away from non-COVID conditions normally receiving immediate treatment, such as MI and stroke. Alternatively, excess deaths appear to occur simultaneously with COVID deaths as some represent misdiagnosed COVID.
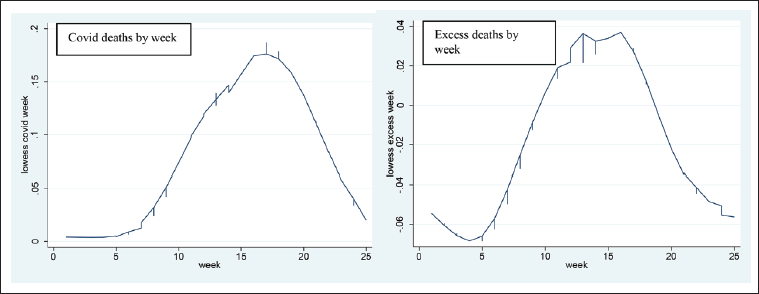
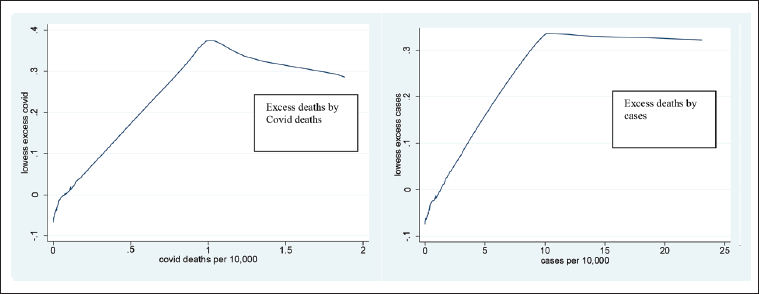
As expected, COVID deaths and cases both correlate with excess deaths. They appear to have a non-linear relationship, excess deaths plateauing around 100 COVID deaths or 1,000 COVID cases per million. As observations are pooled, we do not know whether this plateau occurs within each country or is driven by cross-country differences, that is specific countries having high excess deaths and medium COVID deaths causing this pattern. It motivates us to include squared terms for COVID and cases in our fixed effects regression to test whether the non-linearity occurs within countries.
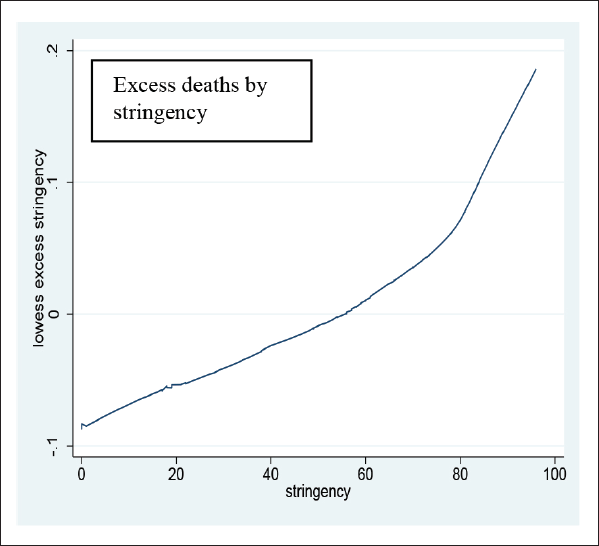
Stringency interestingly correlates positively with excess deaths, as shown in Figure B1. It lends some initial evidence to the theory that lockdowns increase excess deaths by providing a barrier to healthcare, worsening mental health and increasing domestic abuse and alcohol consumption. However, this is only a univariate analysis without controls, so currently, we do not know whether correlation is caused by omitted variables. Notably a high stringency index results from high COVID cases and deaths, which also increase excess deaths, so the correlation may be spurious.
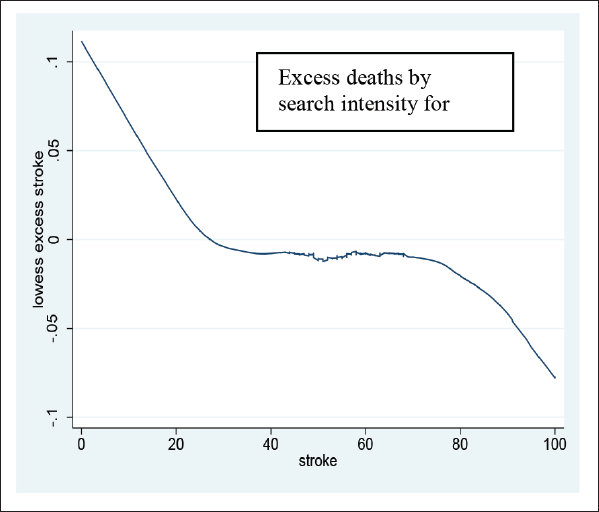
A negative correlation between search intensity for ‘stroke’ and excess deaths in Figure B2 shows fewer searches for ‘stroke’ are linked to higher excess deaths, though again we do not know if an omitted relevant variable, such as presence of COVID, is causing both a reduction in searches for stroke and increased excess deaths.
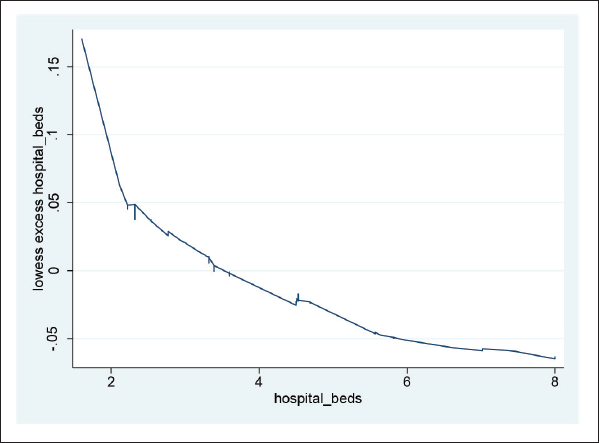
As shown in Figure B3, hospital beds are also negatively correlated with excess deaths. This backs up the theory that increasing these reduces the need for healthcare rationing, so other treatments can continue. Notably, as all observations are pooled, we do not know whether this result is driven by unobserved cross-country heterogeneity. For Figures B1–B3, see Appendix B.
As all are simply univariate analyses without controls, we cannot derive causal effect. There may be omitted relevant variables. This motivates a multivariate analysis with controls.
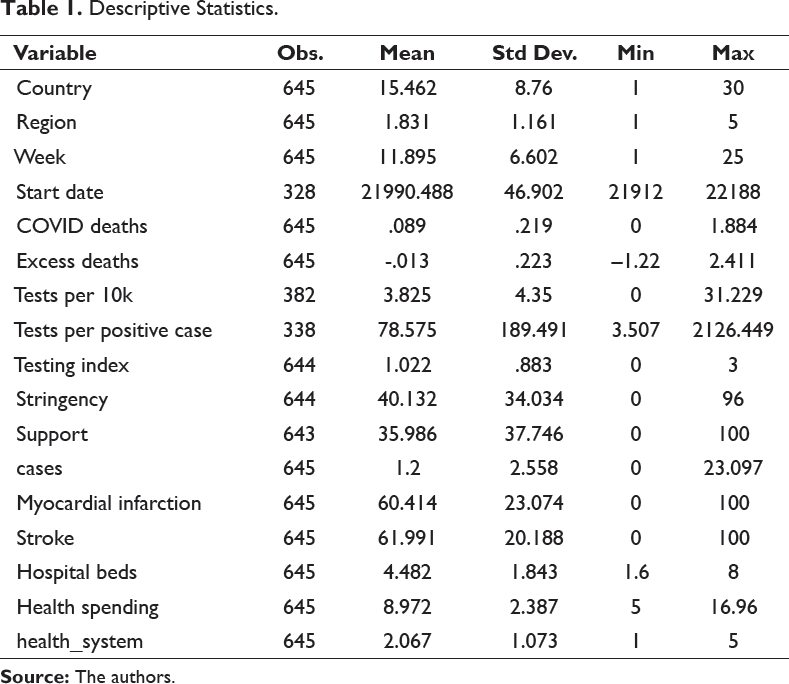
Descriptive Statistics.
Confirmatory Analysis
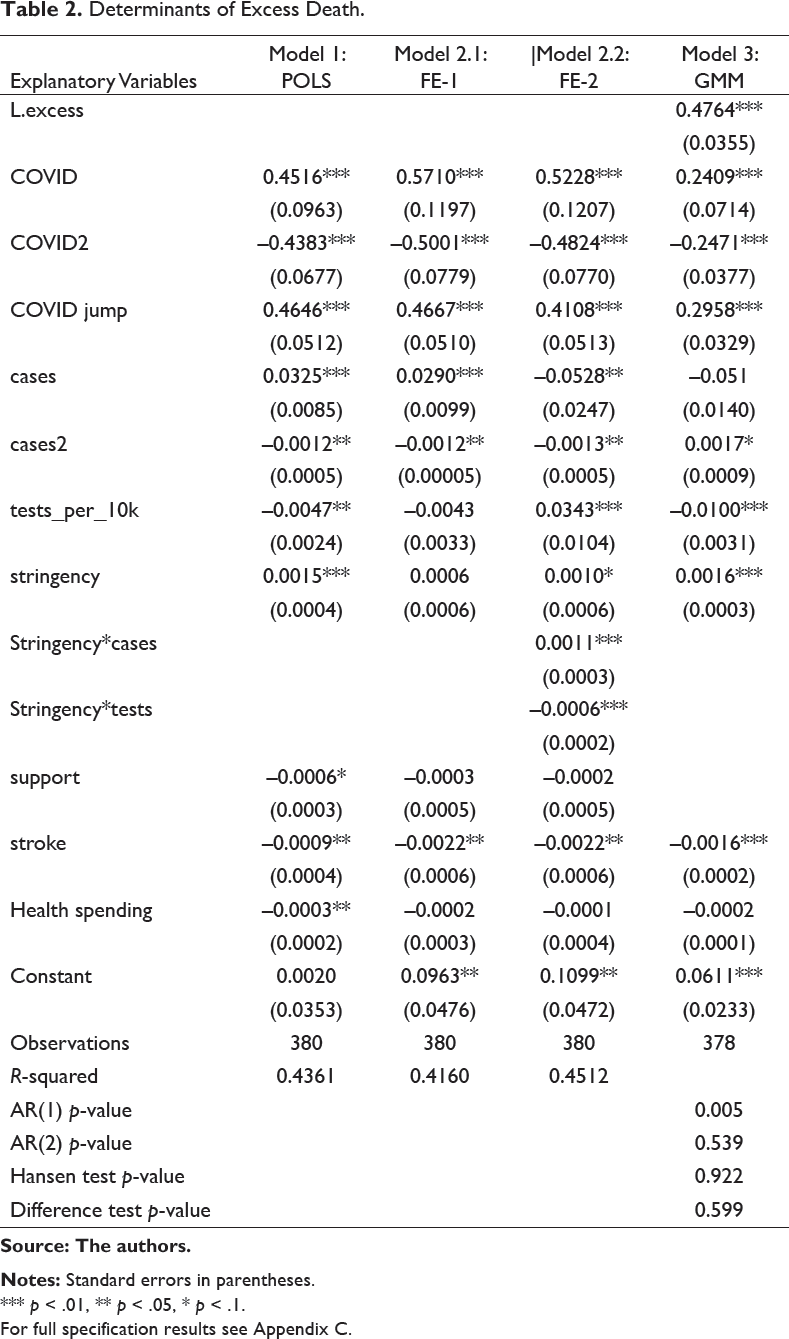
In this section, the regression-based results are presented and discussed. Table 2 presents Pooled OLS, Fixed Effects, System GMM and Table 3 Quantile regression. Pooled OLS results including a full specification are shown in Appendix C. Excess deaths are increasing and concave in COVID deaths, which is highly significant. The maximum effect of COVID on excess deaths is 11.5 extra excess deaths for every 100 extra COVID, occurring at 47 excess deaths per million. This is only slightly lower than Forchini et al.’s estimate of 19 excess deaths for every 100 COVID. It makes sense that extra COVID deaths lead to extra excess deaths. As suggested in the first section, a high COVID toll overstretches healthcare facilities so they cannot provide normal treatment to non-COVID patients, while also discouraging non-COVID patients from seeking healthcare through fear. Excess deaths are also increasing and concave in COVID cases, potentially explained by similar reasoning. At present, Pooled OLS provides only a crude measure of conditional correlation, so we cannot say that COVID deaths are causing excess deaths. This will be determined through checks in the form of Fixed Effects, GMM.
The concave relationship between COVID and excess deaths is interesting. After 94 excess deaths per million, COVID deaths no longer increase excess deaths. Possible explanations could be that hospital delays and cancelled treatments occur only up to a point, beyond which a minimum level of care ensures excess deaths do not increase further. Patients themselves may only be discouraged from seeking healthcare up to a point. Alternatively, there is the theory of ‘harvesting’ or mortality displacement, as discussed by Noymer (2011) in relation to Spanish flu and Spiegelhalter (2020) in relation to COVID. After a certain number of COVID deaths, which kill the most ill patients in a society, a healthier population is left, so deaths from other conditions decrease. Some evidence for this is seen in our descriptive statistics, where excess becomes negative in week 18, though COVID deaths still occur.
Fixed Effects Results Discussion
Determinants of Excess Death.
Source: The authors.
Notes: Standard errors in parentheses.
*** p < .01, ** p < .05, * p < .1.
For full specification results see Appendix C.
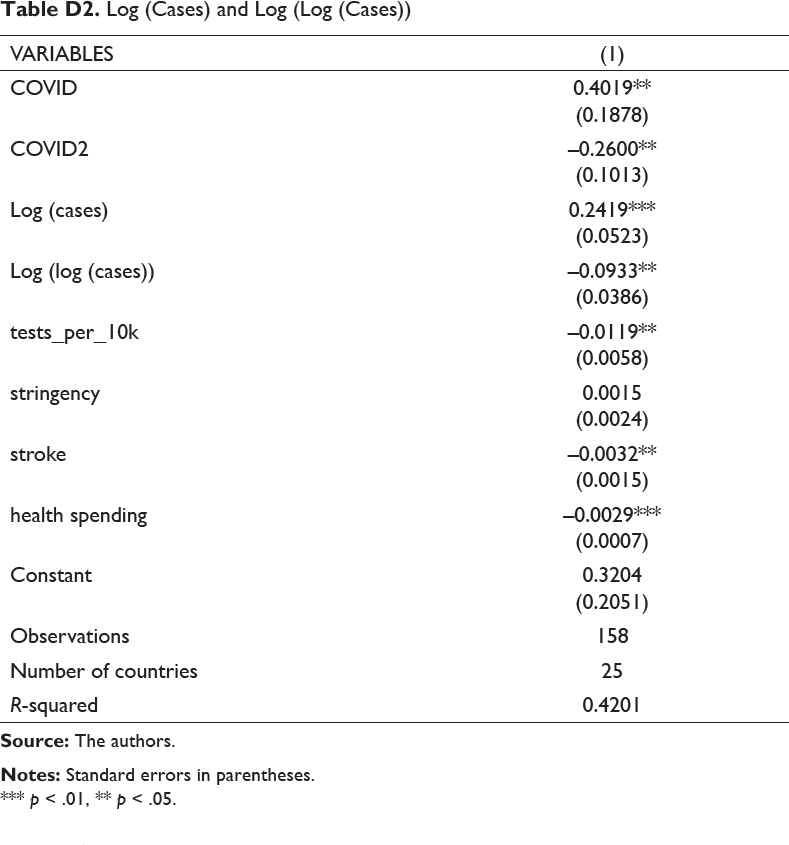
The results are robust to replacing cases and squared cases with log cases, capturing change in cases, and log cases, capturing rate of change (Table D2). The first is significant positive and the second significant negative, indicating an increasing and concave relationship between cases and excess deaths. This specification has two main advantages. It smooths the influence of large jumps in cases. Large jumps in COVID deaths are less likely to be found as deaths may be underreported and increases smoothed for political reasons.
GMM Results Discussion
GMM is even more robust than Fixed Effects, correcting for endogeneity from time-varying omitted relevant variables, measurement error and reverse causality. The Sargen and Difference-in-Hansen tests, for which the null states that instruments are valid, are not rejected. Likewise the AR(2) test for serial correlation of the dependent variable is not rejected, indicating lags can be viably used as instruments. COVID is treated as our endogenous regressor due to time-varying omitted variable bias and measurement error. If we assume other variables are exogenous, the coefficients can be interpreted as causal.
In the GMM, COVID, stringency, stroke and hospital beds coefficients are of the same sign and significance as POLS and FE, indicating our results are robust to endogeneity. Excess deaths are still increasing and concave in COVID deaths, though the maximum effect is smaller, at 6 extra excess deaths for every 100 extra COVID deaths. This implies GMM has removed some upward bias, including from increases in hospital capacity and care improvements which impact COVID and excess deaths simultaneously. Stroke has a larger effect in this model. Applying the same reasoning as above, we conclude a 35-point decrease in Google searches for stroke leads to 5.6 more excess deaths per million, or 375 extra stroke deaths across the UK per week, a 25% increase, resulting from COVID concern displacing concern for this other condition. This links to the findings of Woolf et al. (2020) who observed a 35% increase in stroke deaths in the most affected US states. Similar consequences are likely for other non-COVID conditions which can cause immediate death, though they are not tested in this model. Hospital cause-of-death data when released is likely to shed further light on our conclusions.
Quantile Regression.
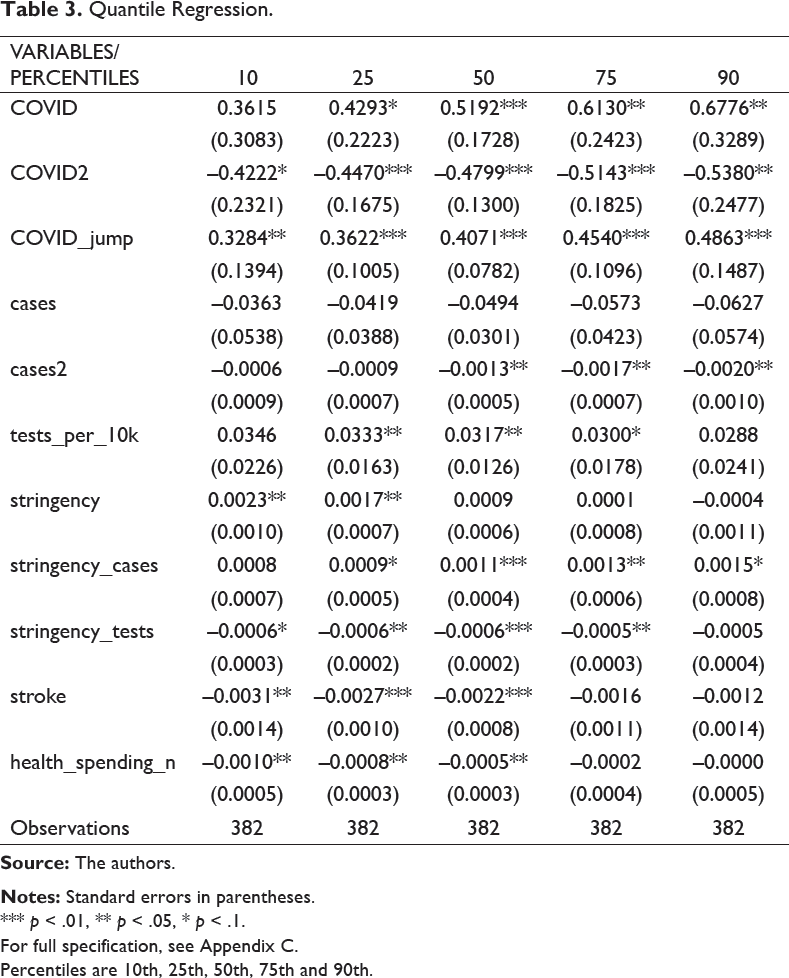
*** p < .01, ** p < .05, * p < .1.
For full specification, see Appendix C.
Percentiles are 10th, 25th, 50th, 75th and 90th.
Quantile Regression Results Discussion
The quantile regression results indicate the differential impacts of the explanatory variables at different stages of the excess death distribution. All regressions include fixed effects, so are robust to cross-country heterogeneity. Column (1) is at the 10th percentile, (2) the 25th, (3) the median, (4) the 75th percentile and (5) the 90th. Two interesting insights emerge. First, the coefficient on COVID deaths becomes increasingly large and significant at higher percentiles of excess deaths, implying COVID deaths affect excess deaths more as excess deaths increase. The median excess deaths, –0.028, is likely to occur when COVID deaths are also around their median of 0.0, as COVID and excess deaths largely move together (Figure 2). When excess and COVID deaths are high, at the 75th and 90th percentiles, COVID deaths have a greater effect on excess deaths. Our previous models, estimating the impact of COVID on excess deaths at its mean of –0.13, may have underestimated the impact COVID deaths when they are positive. The same is true for COVID jump, which has a greater effect as excess deaths increase.
By contrast, stringency, which appears to increase excess deaths in the Fixed Effects and GMM regressions, is only found to be significant at the 25th percentile, with its coefficient decreasing as we move up the distribution. This suggests stringency only increases excess deaths when they are low. This is likely when COVID deaths are also low, when the pandemic is less severe. This has important policy implications. Previous models, showing stringency increases excess deaths, imply a trade-off between COVID and non-COVID deaths, as suggested by right-wing news sources including the Daily Mail. However, the quantile regression suggests lockdown only increases excess deaths at less severe stages of the pandemic, when lockdowns are less vital. When the pandemic is severe, stringency measures do not increase excess deaths, while they massively reduce COVID deaths by decreasing R–0; without lockdown, 510,000 UK deaths were predicted (Ferguson et al., 2020). Indeed, when the pandemic is severe, lockdowns may indirectly reduce excess deaths, by reducing COVID deaths and potentially improving the economy in the long run (Correia et al., 2020).
Conclusion
This paper has investigated the determinants and causes of excess deaths during the COVID-19 pandemic. It is one of the first to use econometric tools to investigate this subject, which is both under-researched and vital for creating policies to reduce overall excess mortality, both during the COVID-19 pandemic and in future pandemics. It has used Pooled OLS, Fixed Effects, and GMM to find the impacts of COVID deaths, cases and other variables on excess deaths. First, we consistently find that COVID deaths have an increasing and concave relationship to excess deaths, whereas cases have a smaller and more ambiguous impact. Second, we find that stringency may have a positive impact on excess deaths, increasing them by up to 16 million per week, though this only occurs at the lower end of the excess death distribution. Third, we find that reductions in searches for medical conditions, particularly stroke, are consistently linked to higher excess deaths. Reduced search intensity for stroke increases excess deaths by up to 5.6 million per week. We suggest that a causal channel is less awareness and concern about non-COVID conditions during the pandemic. Fourthly we use quantile analysis to find the differential impacts of these variables at different stages of the excess non-COVID death distribution, highlighting that COVID deaths have the greatest result when excess deaths are high, and stringency when excess deaths are low.
We highlight three key policy implications for the future. First, as we find reduction in search for stroke is linked to higher excess deaths, we recommend that more public information is given out about other conditions during a pandemic. Second, we find that stringency increases excess deaths when excess deaths are low. We recommend firstly that further research into how lockdowns cause excess deaths is carried out, second, that mitigation measures against excess deaths are put in place during lockdown, and thirdly that trade-offs of lockdown are considered. The third recommendation only applies when excess deaths are low, as during periods of high excess deaths, lockdown has negligible impact while reducing COVID deaths significantly. Third, as the jump in COVID deaths increases excess deaths, we suggest that minimizing excess deaths is an extra incentive for policymakers to flatten the coronavirus curve.
Appendices
Data Source and Reasons for Variable Inclusion.
Appendix C. Full Specification Results.
Pooled OLS.
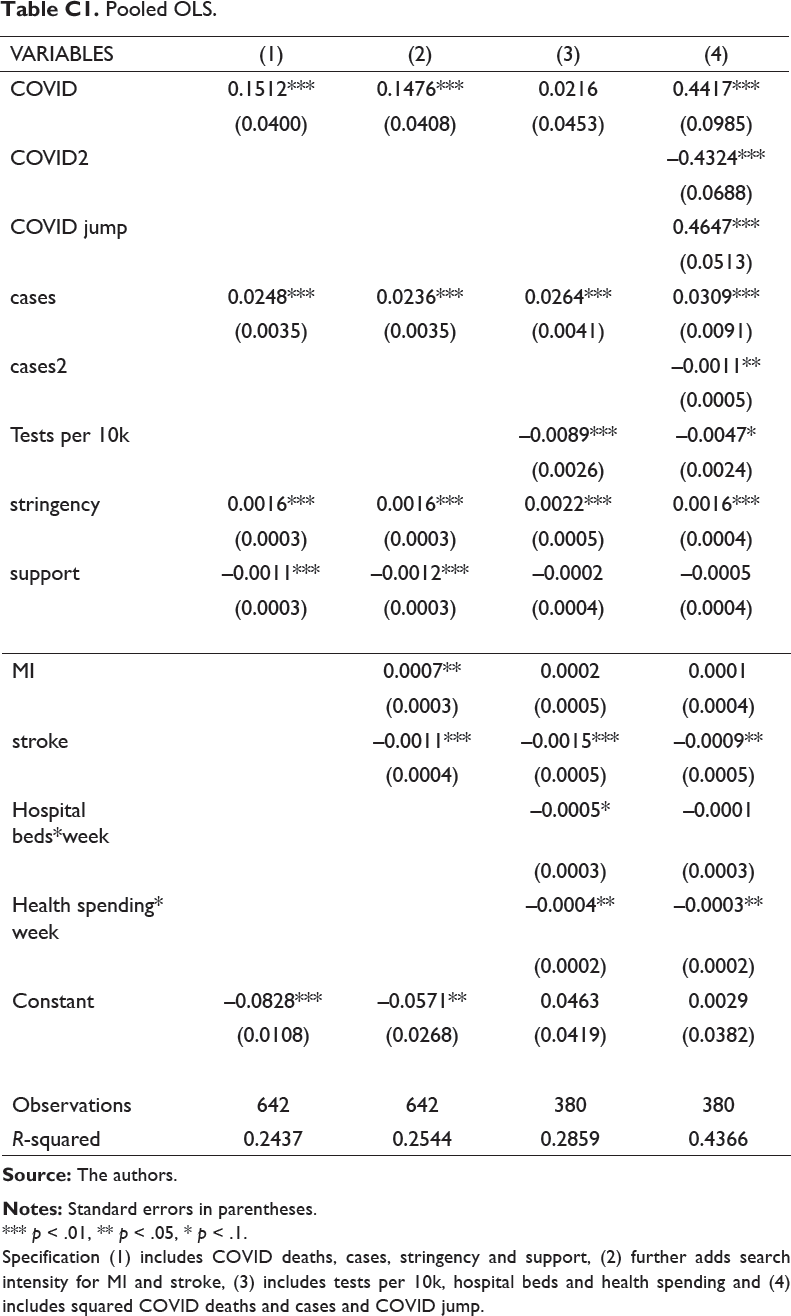
*** p < .01, ** p < .05, * p < .1.
Specification (1) includes COVID deaths, cases, stringency and support, (2) further adds search intensity for MI and stroke, (3) includes tests per 10k, hospital beds and health spending and (4) includes squared COVID deaths and cases and COVID jump.
Fixed Effects.
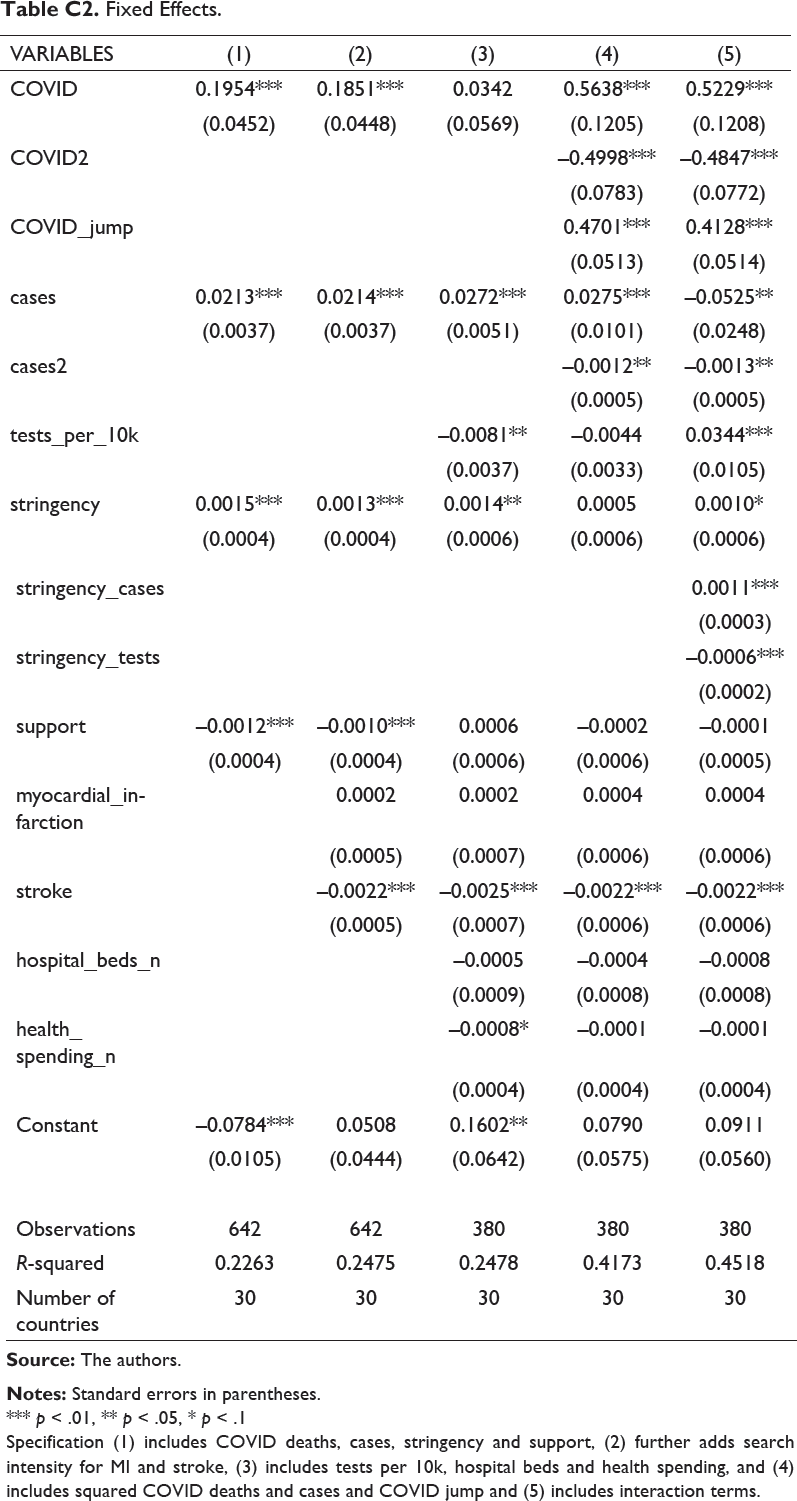
*** p < .01, ** p < .05, * p < .1
Specification (1) includes COVID deaths, cases, stringency and support, (2) further adds search intensity for MI and stroke, (3) includes tests per 10k, hospital beds and health spending, and (4) includes squared COVID deaths and cases and COVID jump and (5) includes interaction terms.
GMM.
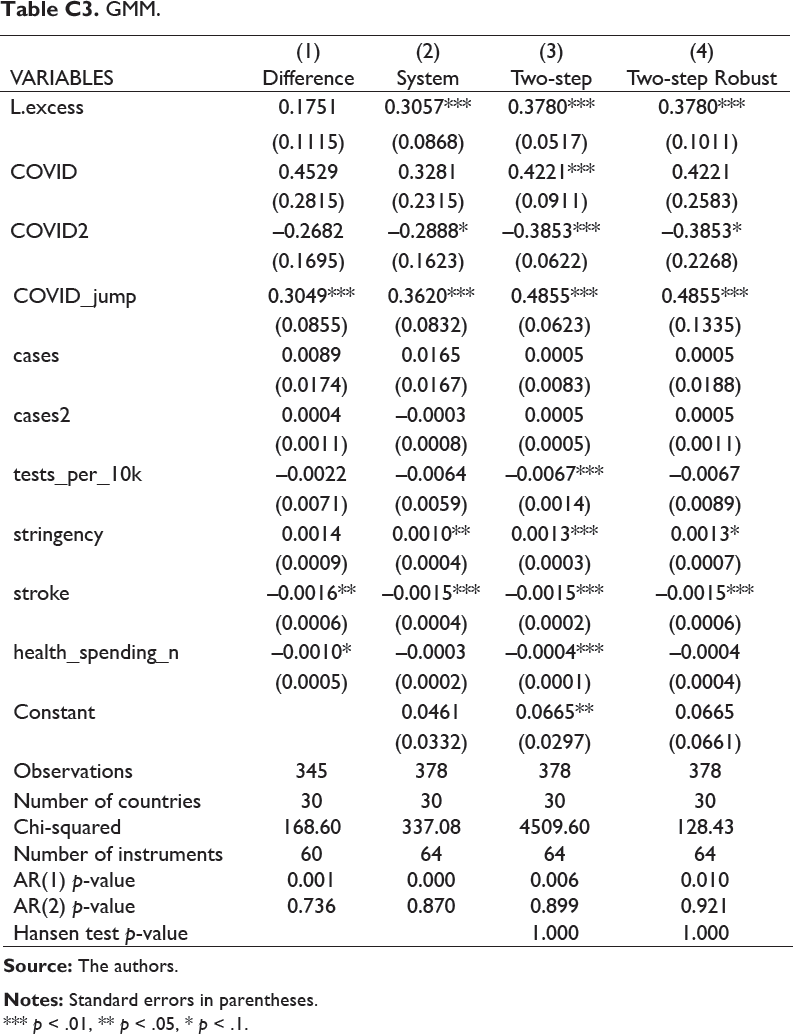
*** p < .01, ** p < .05, * p < .1.
POLS, FE, RE, GMM, IV and Median Quantile.
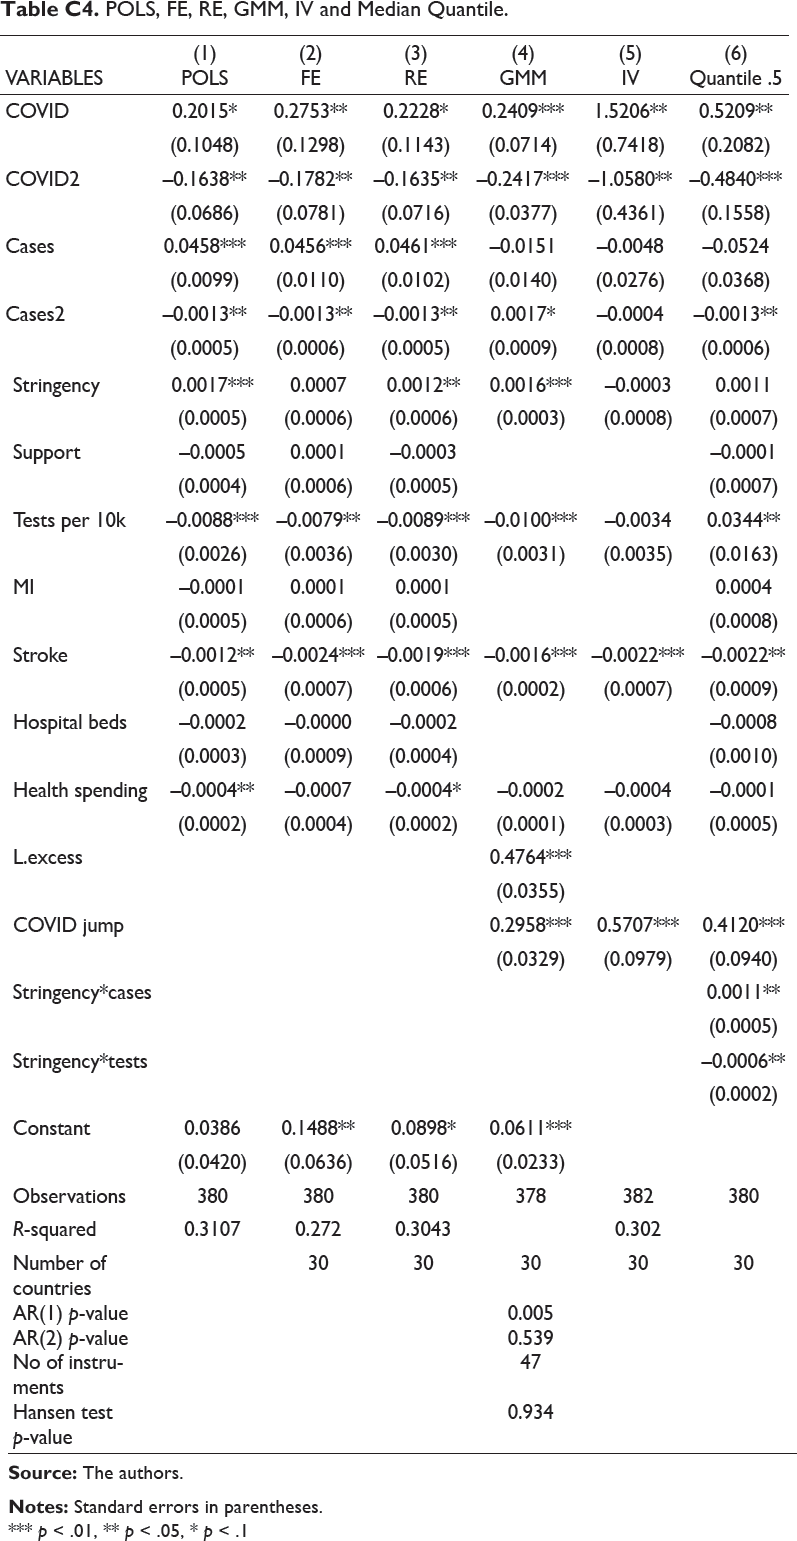
*** p < .01, ** p < .05, * p < .1
Appendix D. Supplementary Figures and Results.
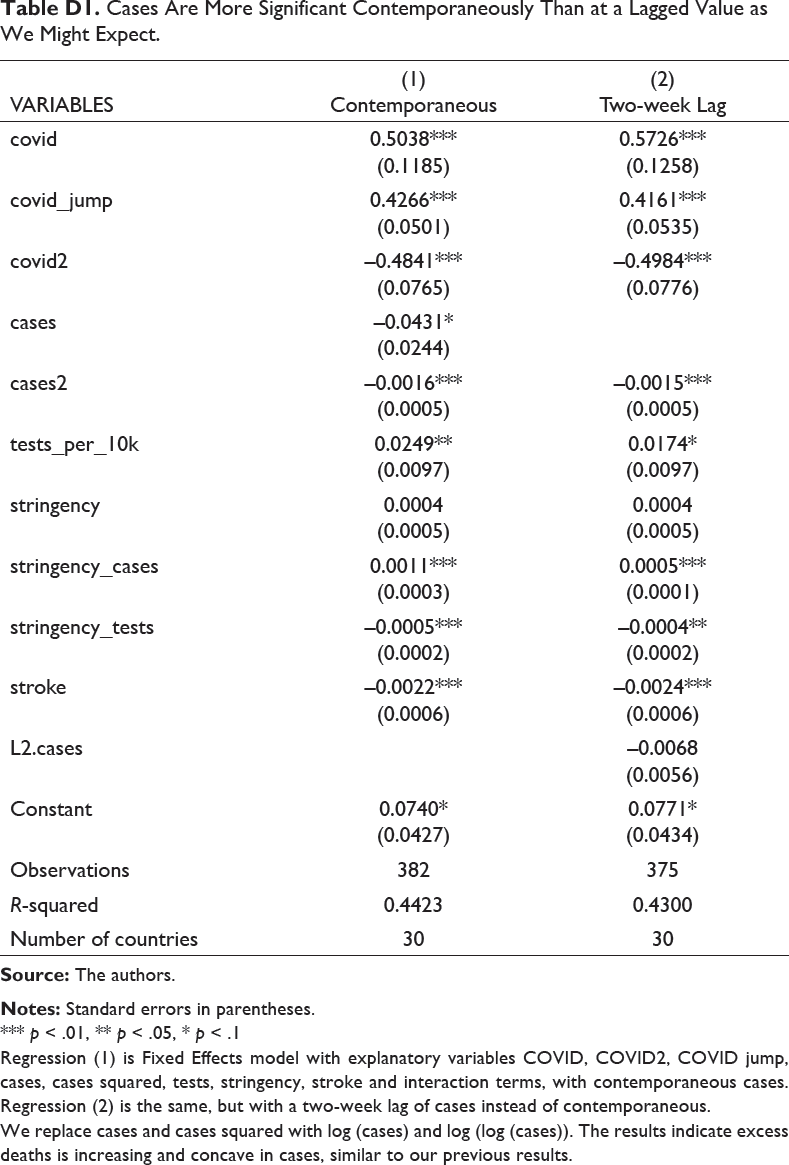
Cases Are More Significant Contemporaneously Than at a Lagged Value as We Might Expect.
*** p < .01, ** p < .05, * p < .1
Regression (1) is Fixed Effects model with explanatory variables COVID, COVID2, COVID jump, cases, cases squared, tests, stringency, stroke and interaction terms, with contemporaneous cases. Regression (2) is the same, but with a two-week lag of cases instead of contemporaneous.
We replace cases and cases squared with log (cases) and log (log (cases)). The results indicate excess deaths is increasing and concave in cases, similar to our previous results.
Log (Cases) and Log (Log (Cases))
*** p < .01, ** p < .05.
Appendix E. Further Information on Data.
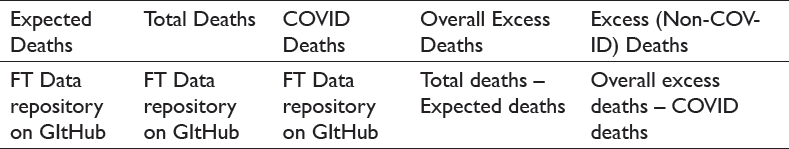
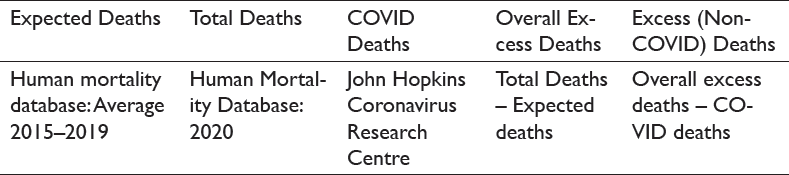
Calculation of Excess Deaths.
To obtain overall excess deaths, expected deaths are subtracted from total deaths. Then, to calculate excess deaths, we subtract COVID deaths from overall excess deaths. The data was collected from the following sources:
Footnotes
Declaration of Conflicting Interests
Funding
The authors received no financial support for the research, authorship and/or publication of this article.