
Abstract
Purpose:
To clarify the causal relationship between quadriceps tendon stiffness and gait speed in patients with severe knee osteoarthritis (OA) using structural equation modeling.
Methods:
Participants were 36 patients with knee OA (median age, 75.0 [interquartile range, 67.3–76.0] years; Kellgren-Lawrence grade 3 or 4). We measured quadriceps tendon stiffness using Young’s modulus by ShearWave Elastography. Gait speed and kinematics parameters were measured using a motion analysis system. Additional data collected for each patient included age, sex, height, body weight, body mass index, femorotibial angle, knee range of motion, knee extension torque, and pain. We performed structural equation modeling for interpretation of the causal relationship.
Results:
The comparative fit index of the structural equation modeling was 0.990. Quadriceps tendon Young’s modulus was a predictor of maximum knee flexion angle during the swing phase (standardized partial regression coefficients [β] = –0.67, P < 0.001). Maximum knee flexion angle during the swing phase was a predictor of cadence and step length (β values 0.35 and 0.55, P = 0.035 and <0.001, respectively). Cadence and step length were predictors of gait speed
Conclusion:
Our results showed a causal relationship between quadriceps tendon stiffness and gait speed in patients with severe knee OA. Quadriceps tendon Young’s modulus can affect gait speed through the maximum knee flexion angle during the swing phase, cadence, and step length. Adding therapeutic intervention to decrease the quadriceps tendon Young’s modulus may lead to increased gait speed.
Keywords
Introduction
Knee osteoarthritis (OA) is an age-related disease, and management is a challenge in aging global societies. 1,2 Knee OA has a complex pathogenesis that leads to joint destruction. 3 As a result, gait speed decreases. 4 Gait speed is associated with the physical activity level in patients with knee OA. 5 Moreover, gait speed is associated with incident disability, survival rate, cognitive impairment, and institutionalization in older adults. 6 –8 Therefore, improving gait speed should be emphasized in patients with knee OA.
Several factors have been reported to affect gait speed. Gait speed is related to physical characteristics and symptoms such as age, height, sex, body mass index (BMI), knee pain, knee extension strength, and knee range of motion (ROM) during gait. 9 –14 Moreover, a recent study reported a negative correlation between quadriceps tendon stiffness and gait speed in patients with severe knee OA. 15 However, the causal relationship between quadriceps tendon stiffness and gait speed in patients with severe knee OA is unknown.
The purpose of this study was to clarify the causal relationship between quadriceps tendon stiffness and gait speed in patients with severe knee OA using structural equation modeling. We hypothesized that there is a causal relationship between quadriceps tendon stiffness and gait speed because it was reported that a stiff quadriceps tendon can restrict knee joint motion during gait. 15 Clinically, if quadriceps tendon stiffness affects gait speed, activities to decrease quadriceps tendon stiffness may need to be incorporated in rehabilitation programs to improve slow gait in patients with knee OA.
Materials and methods
Participants
This study was conducted from August 2018 to May 2020. Screened patients were outpatients or those admitted for knee OA surgery. The inclusion criteria were knee OA severity of Kellgren-Lawrence (KL) grade 3 or 4 and the ability to walk independently. An orthopaedic surgeon classified the severity of knee OA according to the KL grade by reviewing radiographs. 16 The exclusion criteria were medical history of dementia and central nervous system disease. In addition, we excluded cases in which osteophytes were compressing the quadriceps tendon because it has been reported that accurate measurement of stiffness is not possible in such cases. 15 Osteophytes were confirmed by X-ray imaging findings and the compressed statue of quadriceps tendon was confirmed by ultrasound imaging. We used the symptomatic knee of patients for all measurements. In cases of bilateral symptomatic knees, we used the knee with the greatest restrictions during the swing phase for all measurements.
Thirty-six patients were evaluated. We obtained data on the participants’ age, sex, height, body weight, BMI, and femorotibial angle. Body weight was measured in kilograms (kg) using a digital scale, and other data were obtained from medical records.
This study was approved by ethics committees and was conducted in accordance with the Declaration of Helsinki. Each participant provided written informed consent.
Quadriceps tendon stiffness
Quadriceps tendon stiffness was measured by ShearWave Elastography (SWE) using the Aixplorer ultrasound unit in conjunction with a 2–10-MHz linear transducer (Supersonic Imaging, Aix-en-Provence, France). SWE provides Young’s modulus as the value of stiffness, 17 with a minimum value of 0.1 kPa. We selected a preset musculoskeletal and knee setting and set the SWE Opt to the penetration mode. The same physical therapist performed all measurement procedures. The therapist had 2 years’ experience of SWE measurement.
The measurement procedures were based on that described in a previous study which showed good intra-rater reliability. 18 We used the following procedures: first, the participants laid down on their back with the knee bent at 60° because it was reported that Young’s modulus of knee flexion of 60° is related to gait speed. 15 Then we instructed the participants to relax. Second, we placed the transducer between the muscle-tendon transition region of the rectus femoris muscle and the center of the base of the patella. Moreover, based on a study that evaluated the repeatability of SWE, 19 we placed the transducer just above the quadriceps tendon 2 cm proximal to the bony insertion onto the patella. Finally, we set the measurement range size as large as possible within the quadriceps tendon and recorded the mean Young’s modulus. It is preferable to report mean values when using different measurement range sizes. 20
Knee ROM
The participants laid down on their back on a firm treatment bed. We measured passive knee extension and flexion ROM using goniometry, with a minimum value of 1°. The measurer moved the knee passively as much as possible within the patient’s pain tolerance. We recorded the intersection angle of the thigh and lower leg axes. The landmarks used in the measurements were the greater trochanter of the femur, lateral epicondyle of the femur, fibular head, and lateral malleolus of the fibula.
Knee extension strength
We measured knee extension strength using a Biodex System 3C dynamometer (Biodex Medical Systems, New York, USA). Participants sat on the machine seat. The angle of the backrest of the seat was set to 85°. The lower trunk and thigh used for measurement were secured to the seat with straps. The strap at the distal end of the lever arm of the dynamometer was tied to the lower leg directly above the medial malleolus. We measured isometric knee extension torque at 70° of knee flexion. Participants performed 5 s of maximal voluntary isometric contraction with verbal encouragement to reach maximal effort. 21 We obtained the peak torque, with a minimum value of 0.1 Nm. According to a previous study, the peak torque was divided by body weight, and the values were recorded. 12
Gait parameters
Gait parameters were obtained at 100 Hz using a 10-camera motion analysis system MA-3000 (Anima, Tokyo, Japan) and four floor-mounted force plates MG-1060 (Anima, Tokyo, Japan). Participants were barefoot. We put reflective markers on the following anatomical landmarks: the acromion, anterior superior iliac spine, greater trochanter, lateral femoral epicondyle, lateral malleolus, and bone head of the fifth metatarsal bone. The diameter of the markers was 20 mm. The marker position data and ground reaction forces were low-pass filtered at 10 Hz and 20 Hz, respectively.
The participants walked along a 6-m level walkway. We instructed patients to walk at a normal speed, because a normal gait speed is related to various clinical risks. 6 –8 If the participants normally used one or two canes, they were allowed to use them during the assessment. The average gait parameters of the four gait trials were calculated by the software built into the three-dimensional motion analysis system. We recorded gait speed, cadence, step length, knee flexion angle during initial contact, maximum knee flexion angle during loading response, and maximum knee flexion angle during the swing phase.
Pain during gait
We used the visual analog scale to evaluate pain during gait. 22 Participants marked their pain level on a 100-mm linear scale immediately after the measurement of gait parameters. The markings were converted to a score between 0 and 100 by reading of each mark. We recorded the pain score (no pain, 0 points; maximum pain, 100 points).
Statistical analysis
Shapiro-Wilk’s test assessed the distribution of data in this study. Normally distributed data were calculated as mean and standard deviation values; otherwise, median and interquartile range values were calculated.
Correlation analysis between gait speed and other values was performed. When the values were normally distributed, Pearson’s product moment correlation coefficients were calculated; otherwise, Spearman’s rank correlation coefficient was calculated. In addition, a polyserial correlation coefficient was calculated between the nominal scale and the ratio scale. Specifically, Pearson’s product moment correlation coefficients were determined between gait speed and height, knee flexion ROM, knee extension torque, knee flexion angle during the initial contact, maximum knee flexion angle during the loading response, cadence, and step length. Spearman’s rank correlation coefficients were determined between gait speed and age, weight, BMI, knee extension ROM, quadriceps tendon Young’s modulus, maximum knee flexion angle during the swing phase, and pain during gait. The nominal scales were converted to dummy variables. We assigned “1” to men and “0” to women. After nominal scale conversion and sex assignment, the polyserial correlation coefficient was determined between gait speed and sex.
Structural equation modeling was performed for interpretation of the causal relationship between quadriceps tendon Young’s modulus and gait speed. The model was employed to quantify the relationship between gait speed and other values that were significantly correlated with gait speed, including knee flexion ROM, quadriceps tendon Young’s modulus, maximum knee flexion angle during the swing phase, knee extension torque, cadence, and step length. We created the model using the following criteria: the goodness of fit index (GFI) and comparative fit index (CFI) are as large as possible and the root mean square error of approximation (RMSEA), Akaike’s information criterion (AIC), and Bayesian information criterion (BIC) are as small as possible.
P-values < 0.05 were considered statistically significant. SPSS statistics version 26.0 (IBM Corp., New York, USA) was used to perform Shapiro-Wilk’s test and determine Pearson’s product moment correlation coefficient and Spearman’s rank correlation coefficient. The polyserial correlation coefficient was calculated using Base SAS 9.4 (SAS Institute, North Carolina, USA). Structural equation modeling was performed using SPSS Amos 5.0 (IBM Corp., New York, USA).
Results
Physical characteristics and measured values
The physical characteristics and measured values of the participants are summarized in Tables 1 and 2, respectively. The median age was 75.0 (interquartile range, 67.3–76.0) years. Quadriceps tendon Young’s modulus was 278.0 (209.6–369.8) kPa. Gait speed was 0.84 ± 0.26 m/s (mean ± standard deviation).
Physical characteristics.

a Values are presented as mean ± standard deviation.
b Values are presented as median (interquartile range).
BMI, body mass index; FTA, femorotibial angle; KL, Kellgren-Lawrence; OA, osteoarthritis.
Measured values.

a Values are presented as mean ± standard deviation.
b Values are presented as median (interquartile range).
OA, osteoarthritis; ROM, range of motion.
Correlation coefficient
The correlation results between gait speed and other variables are shown in Table 3. There were positive correlations between gait speed and knee flexion ROM (P = 0.009), knee extension torque (P = 0.002), maximum knee flexion angle during the swing phase (P < 0.001), cadence (P < 0.001), and step length (P < 0.001). There was a negative correlation between gait speed and quadriceps tendon Young’s modulus (P = 0.003). There were no significant correlations between gait speed and other values (P > 0.05).
The correlation results between gait speed and other values.

a Pearson’s product moment correlation coefficient.
b Spearman’s rank correlation coefficients.
c Polyserial correlation coefficient.
*P < 0.05.
BMI, body mass index; ROM, range of motion.
Structural equation modeling
The model is shown in Figure 1. The values of the model for goodness of fit were GFI 0.899, CFI 0.990, and RMSEA 0.074 (90% confidence interval was < 0.001–0.195); AIC was 46.297 and BIC was 71.633. The CMIN of the model was 14.297 (P = 0.282). Knee flexion ROM had a statistically significant negative impact on quadriceps tendon Young’s modulus (standardized partial regression coefficients [β] = –0.50, P < 0.001) and quadriceps tendon Young’s modulus had a statistically significant negative influence on maximum knee flexion angle during the swing phase (β = –0.67, P < 0.001). The maximum knee flexion angle during the swing phase had a statistically significant positive impact on cadence (β = 0.35, P = 0.035) and step length (β = 0.55, P < 0.001). Cadence and step length had a statistically significant positive impact on gait speed (β = 0.50 and 0.63, P < 0.001 and < 0.001, respectively).
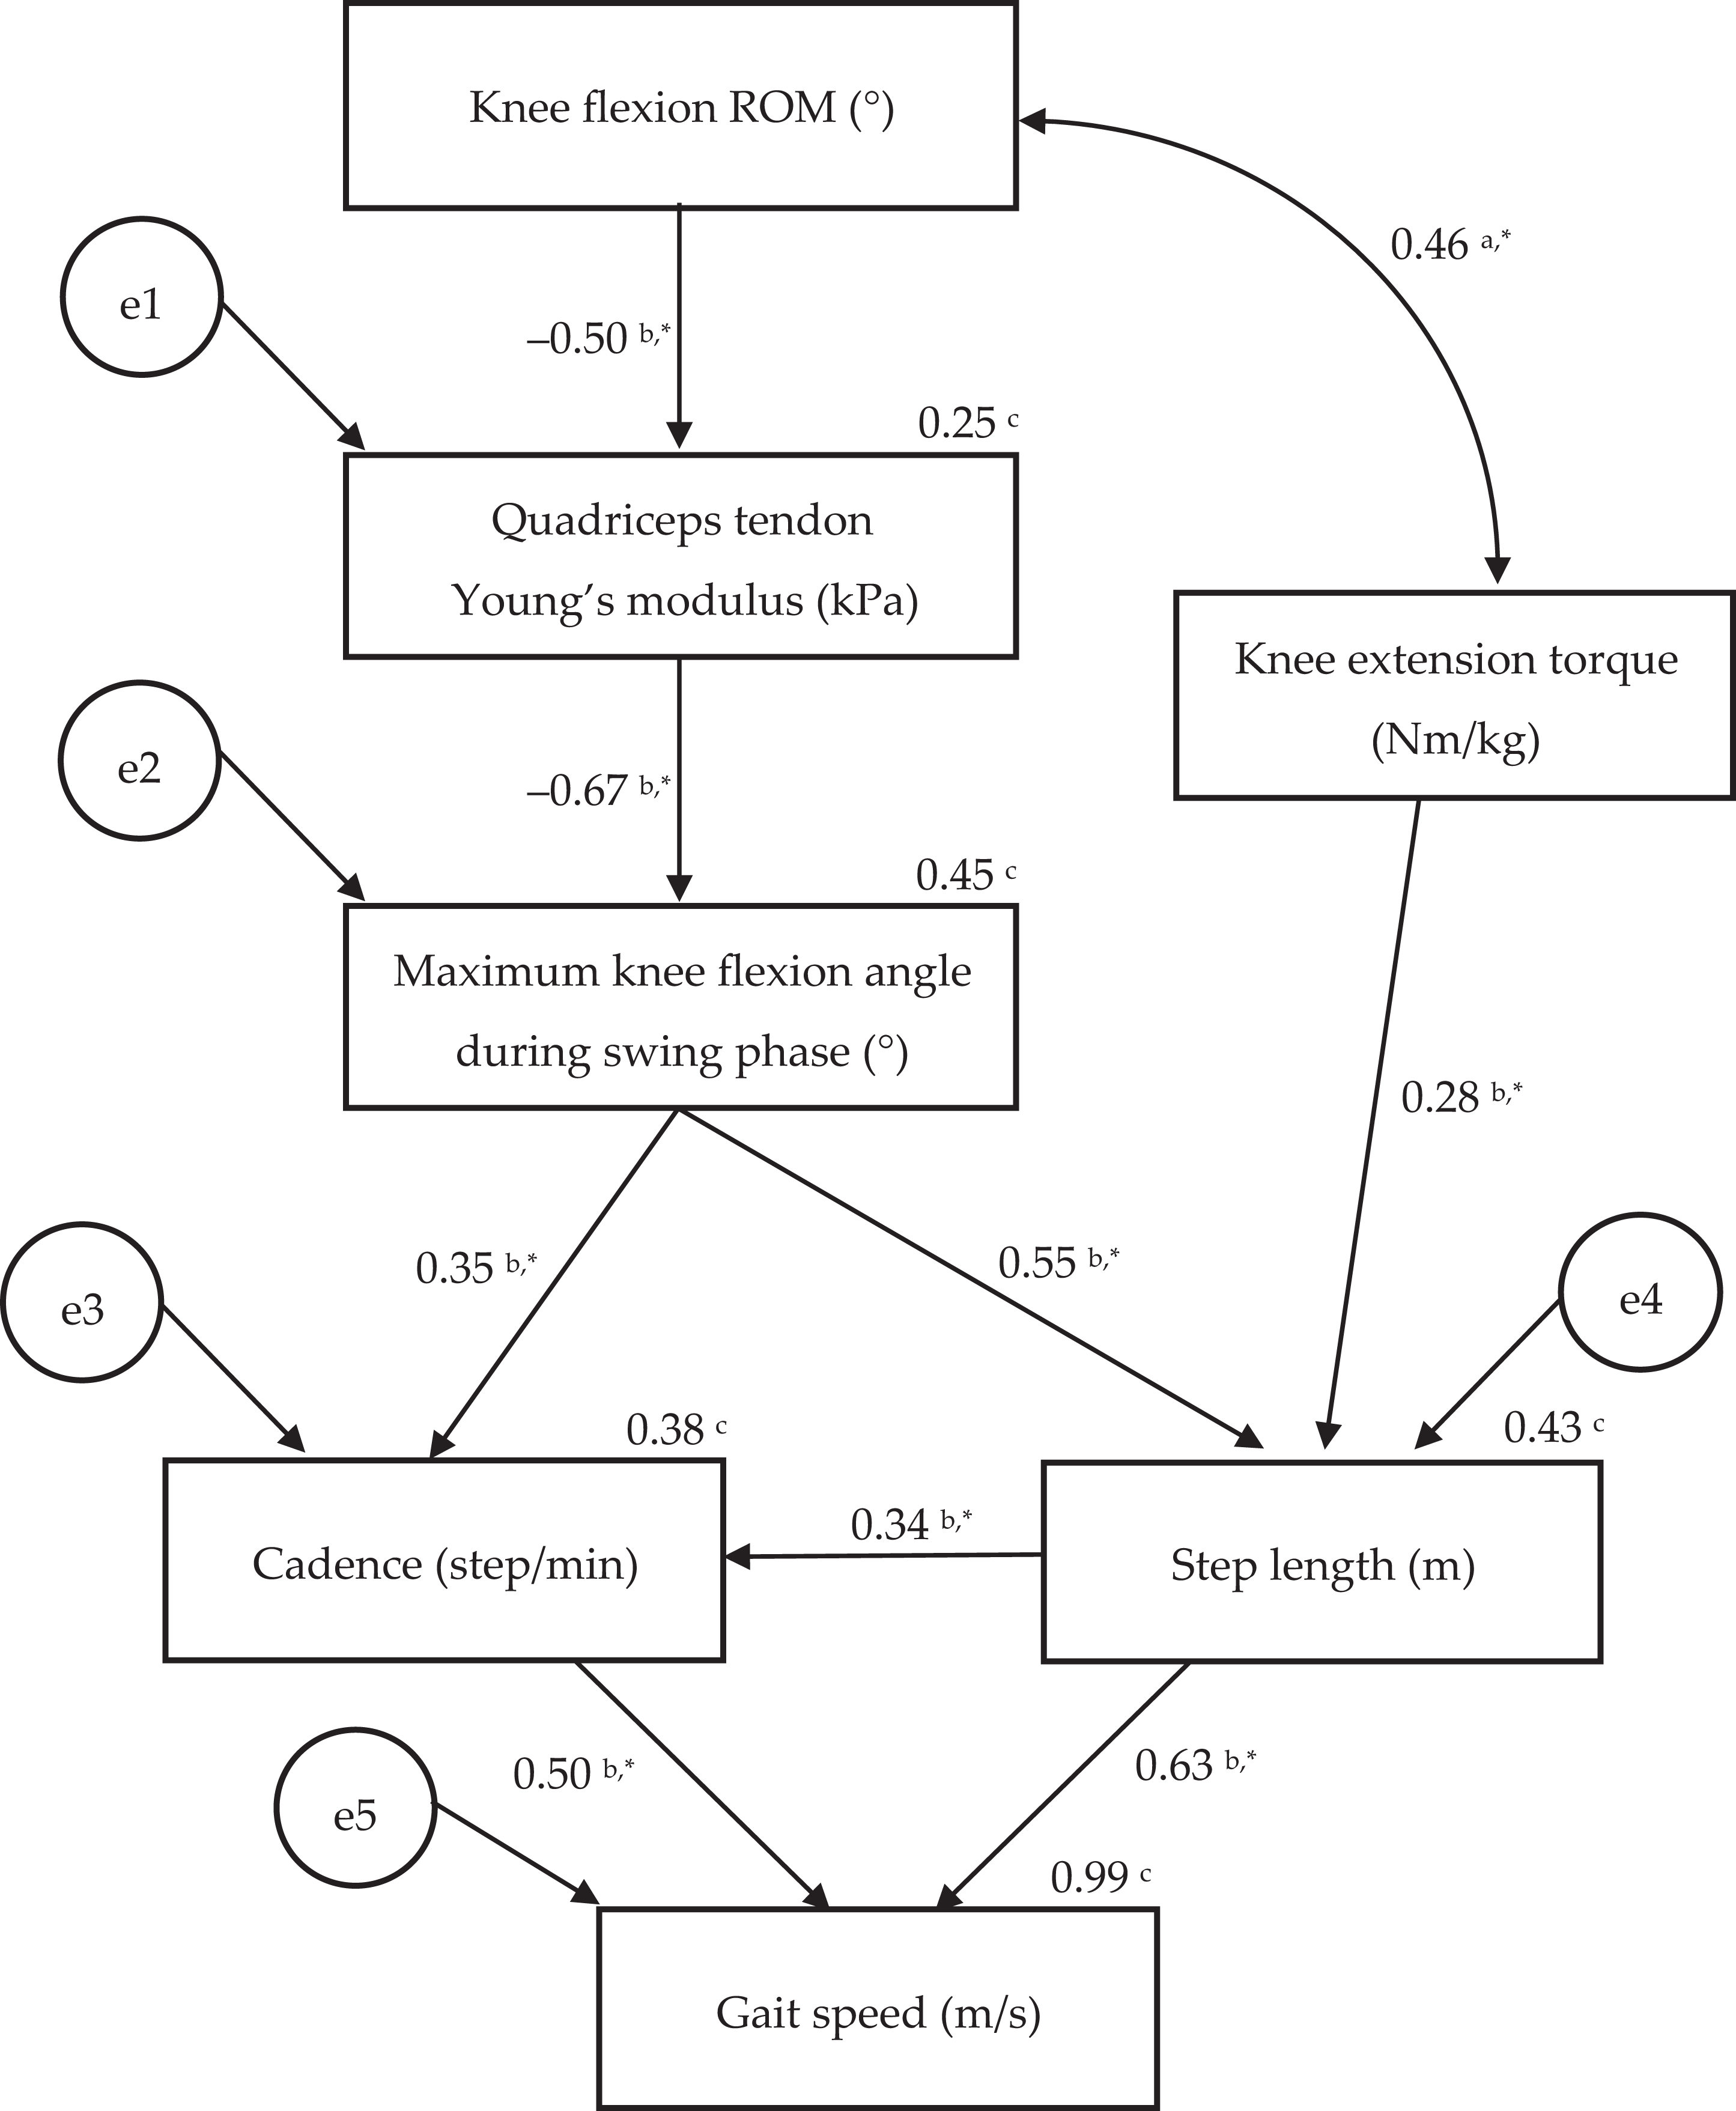
Figure showing structural equation modeling. The model goodness of the fit and the comparative fit index was 0.899 and 0.990, respectively, and the root mean square error of approximation was 0.074. aCorrelation coefficient. bStandardized partial regression coefficient. cCoefficient of determination. *P < 0.05. The e1, e2, e3, e4, and e5 indicate error variable. ROM, range of motion.
Discussion
The model shown in Figure 1 which is based on our analysis supported our hypothesis. The Young’s modulus of the quadriceps tendon affected gait speed through the maximum knee flexion angle during the swing phase, cadence, and step length in patients with severe knee OA in this study.
Cadence and step length increase as gait speed increases. 23 Increased quadriceps tendon Young’s modulus, that is, quadriceps tendon stiffness, can restrict the knee flexion angle during the swing phase. 15 Reduced knee flexion angle during the swing phase can decrease step length because the speed to swing out the lower limb slows down. 24 Moreover, the knee flexion angle during the swing phase increases, 14 and the knee flexion-extension cycles during gait shorten as the gait speed increases. 25 Therefore, smooth knee movement is required to increase the gait speed. However, a stiff knee with limited knee flexion would not be able to achieve smooth movement. As a result, cadence would be low. Quadriceps tendon Young’s modulus can affect gait speed due to the chaining of the above mechanisms.
Knee flexion ROM was a predictor of the quadriceps tendon Young’s modulus. Stretching is a therapeutic intervention for improving decreased ROM and can reduce tendon stiffness. 26,27 Quadriceps stretching may be an important intervention to reduce quadriceps tendon Young’s modulus and may lead to improved slow walking speed. The participants in this study were outpatients or those admitted for knee OA surgery. For outpatients, quadriceps tendon stretching may be a conservative therapy to improve gait speed. For those admitted for knee OA surgery, preoperative quadriceps tendon stretching may help improve postoperative gait speed. However, the effect of stretching on quadriceps tendon Young’s modulus is still unclear in practice. Intervention trials are needed to determine the effects of stretching on Young’s modulus.
There are limitations in this study. First, we did not measure the parameters of kinetics. The soleus and iliopsoas muscles affect forward center of mass progression during the late stance phase in knee OA. 28 The effects of these muscles were not analyzed. Second, the method of measuring knee extension strength was different from that in other studies. 9,12 If the methods for measuring knee extension strength are changed, the degree of the β would fluctuate. Third, the coefficient of determination of the quadriceps tendon Young’s modulus was low. Explanatory variables other than knee flexion ROM also need to be identified for accurate prediction of the quadriceps tendon Young’s modulus. Fourth, there were some unmeasured outcomes related to the knee OA in this study, such as the functional scores and pain other than the walking pain. The relationships between these values and the quadriceps tendon Young’s modulus remain unknown. Further studies are needed to address these limitations.
Conclusions
Our results showed a causal relationship between quadriceps tendon stiffness and gait speed in patients with severe knee OA. The Young’s modulus of the quadriceps tendon can affect gait speed through the maximum knee flexion angle during the swing phase, cadence, and step length. Clinically, decreasing the quadriceps tendon Young’s modulus may be important to add to therapeutic intervention programs for increasing gait speed in patients with severe knee OA.
Footnotes
Data availability statement
The datasets used and/or analyzed during the current study are available from the corresponding author on reasonable request.
Declaration of conflicting interests
The author(s) declared no potential conflicts of interest with respect to the research, authorship, and/or publication of this article.
Funding
The author(s) received no financial support for the research, authorship, and/or publication of this article.