
Abstract
Purpose:
This cross-sectional study aimed to investigate the effects of foot arch deformities on physical characteristics, muscular strength, and motor function in older women depending on the presence or absence of pain.
Methods:
Overall, 145 community-dwelling women aged 65 to 90 years were included in this study. We measured the foot arch height ratio (AHR, dorsal height/truncated foot length) and classified participants with AHR values above, below, or within 1.5 standard deviations into the high-arched group (HAG), Low-Arched Group (LAG), or normal-arched group (NAG), respectively. We also compared body characteristics (age, height, weight, body mass index (BMI), and skeletal mass index), muscle strength (handgrip strength and intrinsic foot strength (IFS)), and locomotive function (two-step value and gait speed) among the three groups.
Results:
Locomotive examination and muscle strength showed significant differences among the three groups only in the presence of pain; in the two-step test, HAG, NAG, and LAG values were 0.98 cm/cm, 1.19 cm/cm, and 1.18 cm/cm, respectively. The IFS measured 19.2 N, 24.2 N, 31.0 N, respectively, in the HAG, NAG, and LAG.
Conclusion:
This study suggests that decreased IFS affects the mobility function of high-arched feet in older women. Although there was no significant difference in the evaluation of pain, HAG showed the highest average value, which is considered to contribute to the decreased two-step value. It has been suggested that a high-arched foot in the presence of pain is associated with IFS weakness and may affect the decline of mobility function in older women.
Introduction
The foot has arch structures that play a functional role in stabilizing walking and posture. Older people have many foot problems, including deformity, neuropathy, and pain. Foot issues can cause walking difficulty and postural problems in all age groups and lead to more serious health problems in older people. 1,2 Reportedly, 30% of the foot deformities in community-dwelling older people 3,4 are associated with reduced walking speed, 1 difficulty in daily living activities, and an increased risk of falls. 5 Recent studies have emphasized the link between increased health risks, such as frailty syndrome and falls in older people, and foot problems. 6 –8
The medial longitudinal arch (MLA) of the foot can serve as a shock absorber during upright walking, as well as aid in the attenuation of forces transmitted during standing. 9 A very low MLA is considered a flatfoot deformity, while an excessive elevation is a high-arch deformity. An increased incidence of injuries has been noted in people with both low and high-arch deformities. 10 –12 Flatfoot and high-arch foot deformity have been reported to have a prevalence of 10 to 25%, 13 –15 and flatfoot 16 or high-arch foot 17 can impair the standing balance in healthy young people. In addition, previous studies have shown that the laceration stress associated with foot arch deformation is greater in the soft tissue of the female foot. Therefore, women are at higher risk of soft tissue damage, such as fasciitis, than men. 18
In particular, foot pain is very common and has been reported to be associated with falls in older people. 19,20 Awale et al. reported that higher odds of recurrent falls were observed in individuals with severe foot pain, as well as in individuals with planus foot posture. 21
Therefore, is it important to investigate the relationship between abnormal foot arch morphology and motor function in older people depending on the presence or absence of pain. This cross-sectional study mainly aimed to investigate the effects of low-arch and high-arch deformities on physical characteristics, muscular strength, and motor function in older women.
Materials and methods
Participants
This cross-sectional study was conducted in the city of Kaizuka, Japan from August 17 to September 12, 2019. We published a brochure for a community health check-up program and placed it in the local newspapers and public offices, such as the city hall. This cross-sectional study was approved by the Osaka Kawasaki Rehabilitation University Research Ethics Review Board (approval number: OKRU-A019), and written informed consent was obtained from each participant prior to study inclusion. Community-dwelling elderly participants who underwent health examination in Kaizuka City, Osaka, and who provided informed consent were included in the study. The participants were 145 community-dwelling older women, aged 65 to 85 years. Participants who (1) required a cane or walker to perform the gait test, (2) had received certified support or nursing care, or (3) had developed dementia were excluded from the study.
Evaluation method and reliability of foot measurements
The dorsal height (DH), foot length (FL), truncated foot length (TFL), and DH/TFL ratio were assessed in this study. The methods of MLA measurement were based on the bony landmarks described by Williams and McClay. 22 Herein, DH/TFL was defined as the AHR.
Williams and McClay reported that intra-class correlations showed a high reliability of >0.9 for all foot measurements. In the study by McPoil et al. using the arch height index, the intra-correlation coefficients were highly reliable, with a heel to toe length of 0.99 and a dorsal arch height of 0.98. 23
During the measurement process, participants placed their leg on a 15-cm table, while in the standing position. They also gripped a side-cane to stabilize themselves while the measurements were being taken. Measurements were taken according to the load borne by participant, with the load up to 10% of their body weight.
FL was measured using a plastic device, and the DH was calculated as the height of the top from the floor at 50% of FL and was measured using a digital Vernier caliper (Shinwa, Niigata, Japan). While measuring DH, one examiner fixed a ruler at the dorsum of the foot, and another examiner measured the height of the ruler with a digital caliper (Figure 1).

Direct Measurement of the foot length (a) and dorsal height (b).
The TFL value was measured using a digital photographic image and Adobe Photoshop (version 21.0). Two digital cameras (RX-0, SONY, Tokyo, Japan) were used to record the medial sagittal aspect and upper horizontal plane of the foot in the standing position. The digital image of the upper horizontal plane was used to confirm that the foot was in the neutral position, and the medial sagittal aspect was used to calculate the TFL (Figure 2). TFL was calculated by measuring the FL from the digital image of the medial sagittal aspect of the foot using the grading function of the image editing Adobe Photoshop software. The Hallux Length (HL) was then calculated using the measured FL value in the following formula “HL(Photo Shop) × FL/FL(Photo shop).” The TFL was derived from the FL and HL with the following formula: FL-HL. Several investigators have previously measured the foot using similar digital photographic images. 24 –26

Method of calculating the truncated foot length (TFL) using digital images.
The participants were classified into three groups according to the foot AHR: normal-arched group (NAG), high-arched group (HAG), and low-arched group (LAG). Thus, the DH and FL were directly measured using the foot measurement method, and digital photography was used for the TFL.
Assessment of body characteristics
Physiological parameters measured using bioelectrical impedance analysis (Inbody270; Inbody, Tokyo, Japan) with 20 and 1000 kHz frequencies were obtained from the participants’ electronic medical records. 27,28 Participants were instructed to grasp the handles of the analyzer and stand on electrodes in contact with the lower surface of their feet while they wore normal indoor clothing without socks or shoes. The surface of the hand electrode was placed in contact with all five fingers, while the participants’ heels and forefoot were placed on the circular foot electrode. They were asked to perform fast and avoid vigorous exercise for at least 1 hour before the assessment. The body mass index (BMI) was calculated by dividing the body weight (kg) by the height squared (m2). The appendicular skeletal muscle mass index (SMI) was derived from the appendicular muscle mass (kg) divided by the height squared (m2).
Muscle strength
Handgrip strength is a well-known measure of muscle strength and is significantly associated with whole body muscle strength. 29 The maximum voluntary isometric strength of the handgrip of the dominant hand was measured while in a standing position, using a hand dynamometer Grip-D (Takei, Niigata, Japan). Other bodily movements were not permitted during measurement.
Intrinsic foot musculature plays an important role in stabilizing the foot. 30 –32 For the intrinsic muscle strength, a handheld dynamometer (Mobie MT-100, SAKAImed, Tokyo, Japan) was placed distal to the metatarsophalangeal (MTP) joint of the hallux toe while in the sitting position, and the pushing force against the floor surface was measured with the MTP joint extended (Figure 3). When measuring the intrinsic muscle strength, the midfoot was fixed with soft band so that the foot would not shift.

Measurement of intrinsic muscle strength of the foot.
Locomotive examination (gait speed and two-step test)
The participants were instructed to walk 6.4 m (divided into two 2.0-m zones at each end and a 2.4 m middle zone) at a speed they found comfortable. 33 The time required (in seconds) to pass the 2.4-m middle zone was measured for the calculation of gait speed (m/s). The average of five gait tests was used for evaluation.
The two-step test is one of the evaluation techniques for Locomotive Syndrome and has a high correlation with various mobility tests. 34 Here, the maximum length of two steps (cm) that could be performed without poor balance was adopted, and a standardized value of the stride length divided by the height (cm) ratio was defined as the two-step value (cm/cm).
Pain measurement
To assess the rate of pain, a questionnaire survey was conducted to determine the current presence or absence of pain. Pain was assessed by documenting each participant’s maximum pain intensity using a numerical rating scale (NRS) from 0 (“no pain”) to 10 (“the worst imaginable pain”).
Statistical analysis
The Shapiro-Wilk test was used to confirm the normality of the distribution of each evaluation item. As a result, normality was not recognized except among the variables of MLA morphology in the three groups.
The foot AHR was used to classify the foot deformities into the three groups (NAG, HAG, and LAG) in all participants. The χ2 test was used to compare presence or absence of pain in the three groups, and if presence of pain, the most painful location was tested.
Three groups of MLA morphology performed the Kruskal-Wallis test to compare body characteristics, muscle strength, and locomotive examination. The Kruskal-Wallis test was performed separately according to the presence or absence of pain. NRS variables were also analyzed only in the presence of pain. The Kruskal-Wallis test was applied and post hoc comparisons made using Mann-Whitney U-test.
The values of the survey data in this study have been summarized as the mean values (± standard deviation).
IBM SPSS Statistics 26 (IBM Corp., Armonk, NY, US) was used for all statistical analyses, with the significance level set at <5%.
Results
Comparison of foot measurements between the sexes and classification based on AHR
There was a significant difference in the evaluation items FL, DH, and TFL. Based on AHR, three groups of foot arches were determined: NAG (<AHR + 1.5 SD∼>AHR + 1.5 SD), HAG (>AHR + 1.5 SD), and LAG (≤AHR − 1.5 SD). This grouping criterion was applied when both sides or one side was HAG or LAG.
Previously, several investigators set the standard by using one-sided foot measurements ±1.5 SD from the mean value. 35,36 Utilizing the results of mean ±1.5 SD based on AHR, LAG was <0.281 on the right foot and <0.279 on the left foot, and HAG was >0.376 on the right foot and >0.365 on the left foot. Table 1 shows the comparison of foot measurements between the three groups by foot arches.
Comparisons of foot measurements between the three groups.
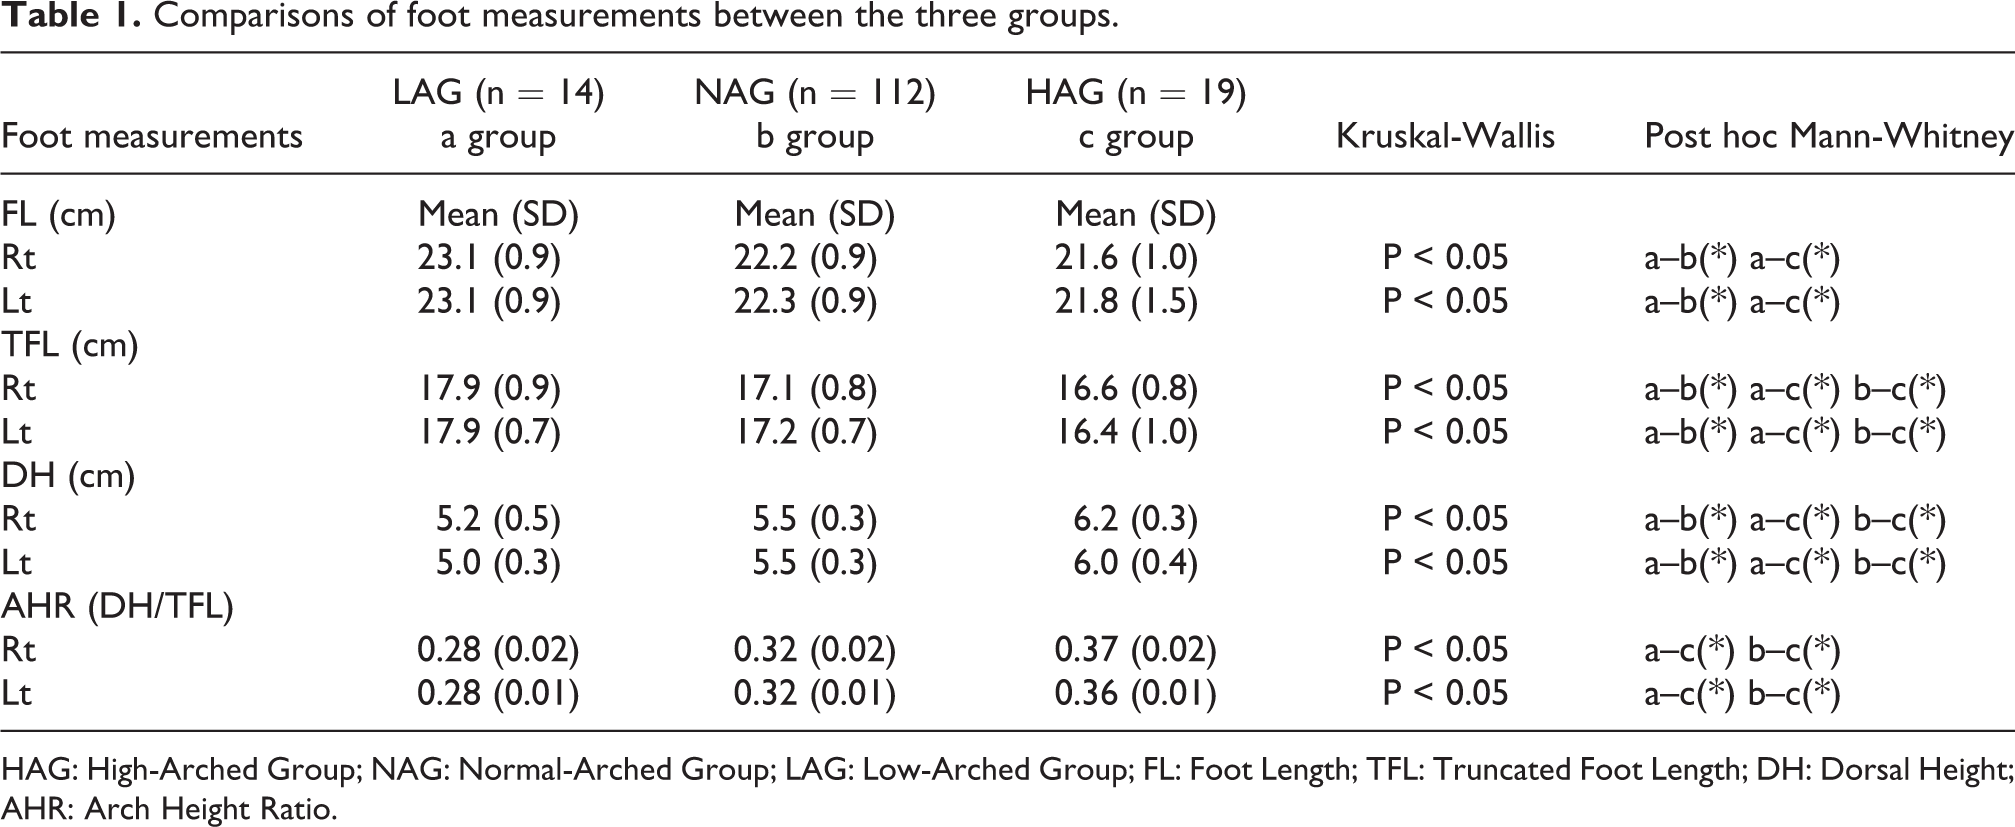
HAG: High-Arched Group; NAG: Normal-Arched Group; LAG: Low-Arched Group; FL: Foot Length; TFL: Truncated Foot Length; DH: Dorsal Height; AHR: Arch Height Ratio.
Comparison of body characteristics, muscle strength, pain measurement and locomotive function
Table 2 shows the results of the comparison of the three groups in terms of body characteristics, muscle strength, NRS, and locomotive function. Locomotive examination and muscle strength showed significant differences among the three groups only in the presence of pain, and in the two-step test where the mean value was the lowest in HAG 0.98 cm/cm, and NAG and LAG were 1.19 cm/cm and 1.18 cm/cm, respectively. Intrinsic foot muscle strength mean value was lost in the HAG at 19.2 N, while NAG and LAG were 24.2 N and 31.0 N, respectively.
Comparison of the three groups by presence or absence of pain based on the characteristics, muscle strength, and locomotive function.

HAG: High-Arched Group; NAG: Normal-Arched Group; LAG: Low-Arched Group; BMI: Body Mass Index; SMI: Skeletal Muscle Mass Index; HS: Handgrip Strength; IFS: Intrinsic Foot Muscle Strength; n.s.: non-significant.
* p < 0.05.
Discussion
This cross-sectional study mainly aimed to clarify the effect of foot arch morphology and the presence of pain on physical characteristics and muscle strength locomotive function in older women. On comparing the foot arches among the three groups in the community-dwelling older people, the bone structure of a high-arched foot may influence the decreased two-step value in the HAG. The average value 0.98 (cm/cm) of the two-step value of HAG with pain corresponds to less than the standard 1.1 (cm/cm), indicating Locomotive Syndrome and a state in which mobility function is deteriorated. 37 As a result, the average value of the intrinsic foot muscle strength in the HAG with pain was 19.2 N, which was lower than the value of 31.0 N in the LAG with pain. In contrast, was no difference in characteristics, muscle strength, or locomotive function by comparison of foot arch morphology in the absence of pain.
Regarding the association between the foot and balance function in older people, Menz et al. reported that foot flexibility, plantar sensation, and plantar flexor strength are important and independent predictors of stable performance. 4 Tanaka et al. revealed that toe muscle function is particularly important for maintaining balance in older people and that older people place greater pressure on their toes than younger people to obtain sensory information to maintain their standing position. 38
In this study, it was suggested that the decrease in IFS affected mobility function in the HAG of the older women. One of the reasons HAG affected the decrease in two-step value, even though there was no difference in SMI and hand grip strength, may be due to the decrease in IFS. Mickle et al. reported that reduced toe flexor strength and the presence of hallux and toe deformities increase the risk of falling in older people. 39 Furthermore, Menz et al. reported that fallers were more likely to fail the paper grip test using the lesser toe. 20 In our study, because we did not investigate toe deformity, we do not know the detail of its association or incidence with foot arch morphology. Previous study stated that the presence of flatfeet and pes cavus is a potential risk factor for the lesser toe due to the formation of muscle imbalance in the foot. 40 According to foot measurements, the shorter FL of the HAG compared to that of the LAG may be related to factors due to lesser toe.
There was no significant difference in the evaluation of pain, but HAG showed the highest mean value. This is considered to be one of the factors of the decrease in two-step value in older people. A high-arched deformity is a common finding in patients with foot pain, 41 and the possibility that pain affects mobility function cannot be ruled out. Although this study did not show a difference in muscle mass among the three groups, Muchna et al. found that foot problems, especially foot pain and peripheral neuropathy, became more prominent as the frailty level worsened. 8 In addition, Imai et al. reported that chronic pain was a risk factor for pre-frailty in older adults, 42 and the presence of knee pain has a negative correlation with quadriceps strength. 43 This finding suggests a link between the presence of pain and decreased IFS.
In the absence of pain, the difference in foot arch morphology did not show a significant difference in locomotive examination, and our results suggest that absence of pain in an abnormal foot arch morphology is not thought to affect the mobility function in older women. However, there are previous reports of the effects of abnormal foot arch morphology on motor function. A high-arched foot is more rigid than the normal foot, reducing the range of motion and lessening shock absorption. 10 Several researchers have reported that the center of gravity shifts laterally during walking because of the effect of a high-arched foot. 44,45 Additionally, Hösl et al. showed that there was no significant difference in gait propulsion between the normal foot and the asymptomatic flatfoot. 46 These reports show the effect of abnormal foot arch morphology on movement, and especially in the presence of pain, attention should be paid to falls; furthermore, it is important to evaluate the strength of the intrinsic muscles of the foot.
There are some limitations to consider in the interpretation of these findings. The first limitation is that the inter-rater reliability of the measured values may be lower than in the previous report using a measurement device. 22,23 The second limitation is that we did not locate the pain, which is a factor related to the decline of mobility function in older people. A high-arched deformity is a common finding in patients with foot pain, 41 and the possibility that the location of the pain affected the two-step test cannot be ruled out. Research should be conducted to evaluate the relationship between pain in the lower back, hip, knee, and foot in older adults.
Conclusions
This cross-sectional study assessed the physical characteristics, muscle strength, pain, and locomotive function in community-dwelling older women with foot deformities by categorizing them into High-Arch, Low-Arch, and Normal-Arch groups. The findings of this study suggest that morphology, especially a high-arched foot, can have a significant negative effect on the two-step value and intrinsic foot muscle strength in older women, only in the presence of pain.
Footnotes
Acknowledgments
We would like to thank the individuals who participated in data collection and data entry, as well as the staff in the Kaizuka Municipal Office for their valuable support and participation.
Declaration of conflicting interests
The author(s) declared no potential conflicts of interest with respect to the research, authorship, and/or publication of this article.
Funding
The author(s) disclosed receipt of the following financial support for the research, authorship, and/or publication of this article: This work was supported by the Osaka Gas Co., Ltd. The sponsors had no control over the interpretation, writing, or publication of this work.