
Abstract
Objective:
This study was designed to investigate the relationship between the laminar slope angle (LSA) and the lumbar disc degenerative grade, the cross-section area (CSA) of multifidus muscle, the muscle-fat index, and the thickness of the ligamentum flavum.
Methods:
Retrospective analysis of 122 patients who were scheduled to undergo a lumbar operation for diagnoses associated with degenerative lumbar disease between January and December 2017. The L4–L5 disc grade was evaluated from preoperative sagittal T2-weighed magnetic resonance imaging of the lumber region; the CSA of the multifidus and muscle-fat index were measured at the L4 level, while the thickness of the ligamentum flavum was measured at the L4–L5 facet level from axis T2-weighed magnetic resonance imaging. The slope of the laminar was evaluated from preoperative three-dimensional computer tomography at the tip level of the facet joints and selected by the axis plane. Independent-sample T-tests were used to assess the association between age and measurement indices.
Results:
Our results showed that age was positively connected with the LSA of L4 and L5 in different patients, although there was no significant difference between age and the difference of the two segment LSA. Partial correlation analysis, excluding the interference of age, revealed a strong negative relationship between the LSA of L4 and the thickness of the ligamentum flavum, irrespective of whether we considered the left or right. However, there was no correlation with lumbar disc degenerative grade, the CSA of the multifidus, and the muscle-fat index.
Conclusion:
The thickness of the ligamentum flavum showed changes with anatomical differences in the LSA, but not the lumbar disc degenerative grade, the CSA of the multifidus, and the muscle-fat index. A small change in LSA may cause large mechanical stress; this may be one of the causative factors responsible for lumbar spinal stenosis.
Keywords
Introduction
Lumbar spinal stenosis (LSS) is a clinical syndrome of low back pain (LBP) and intermittent claudication, which can cause disability and reduce the quality of life. 1,2 Although the precise epidemiology of this condition in China is unknown, it has been reported that approximately 200000 adults suffer from this disease in the USA and represents the most common reason for lumbar surgery in people over 65 years of age. 1 LSS is an age-associated disease caused by degenerative changes of the lumbar discs, ligamentum flavum and facet joints. Bugling of the intervertebral discs, hypertrophy of the facets and thickness of the ligamentum flavum, reduces the space available for neural and vascular elements; these factors underlie the pathological basis of this disease. 3,4
The spine bears the weight of our body under gravity. The functional spine unit (FSU) 5 is a basic building block of the spine and is used to investigate the physical properties and functional biomechanics of the spine. The FSU is composed of two adjacent vertebrae, the intervertebral disc, the facet joints, and the spinal ligaments. Many researchers have investigated the relative relationships between the components of the FSU as these can be measured or calculated easily. Pfirrmann et al. 6 developed a formal classification scheme for discs in 2001 and allowed us to quantify and compare the degeneration of lumbar discs. From then on, an increasing number of researchers and clinicians have investigated the relationship between lumbar disc degenerative grade and the degeneration of other FSU structures.
In 2017, Kalichman et al. 7 described three signs of muscle degeneration on imaging: decreased muscle size, decreased radiographic density, and the increased deposition of fat. Sun et al. 8 further reported that disc degeneration was positively correlated with the atrophy of the multifidus muscles at the L3–L4 disc level. Thus, strengthening the paraspinal muscle helps to prevent muscle atrophy and slowed down the progression of lumbar spinal degeneration.
The laminar slope angle was first proposed by Xu et al. in 1999 9 and defined as the intersection angle of the plane of the lamina and the horizontal plane of the vertebral body, thus representing the tilt of each lamina. This parameter was first used to provide a preference for spinal surgeons to place sublaminar instruments. However, this angle represented an anatomical index that reflected the relative tilt of the lamina. Jun et al. highlighted that a high T1 slope might be a predisposing factor in degenerative cervical spondylolisthesis, 10 while other research stated that the sacral slope was of importance because a reduction in the sagittal balance of the spine could cause chronic low back pain in patients with degenerative lumbar scoliosis. 11 We hypothesize that the extent of the laminar slope angle may affect the vertebral anatomical structure and give rise to lumbar disc degeneration, hypertrophy of the ligamentum flavum, multifidus muscle atrophy, and fatty infiltration. These changes could create LBP and lead to degenerative lumbar disease.
Materials and methods
Study participants
We recruited a total of 687 patients, of all ages, who came to the inpatient department of spinal surgery at Renji Hospital and were scheduled for lumbar surgeries between January and December 2017. We divided these patients into five groups according to age: below 35 years, between 36 and 45 years, between 46 and 55 years, between 56 and 65 years, and above 66 years. Then, we randomly selected 20–30 samples from each group (6:1) and mixed them up to create a final sample group. A total of 122 patients remained in the analysis (Figure 1). We registered the age and sex of all 122 patients, who all underwent MRI and CT scans of the lumbar spine prior to surgery. The inclusion criteria were: (1) no history of spinal surgery; (2) no recent history of severe lumbar trauma; (3) no abnormal radiological findings, such as vertebral fractures, space occupying lesions of the lumbar spine, or apparent spinal deformities (e.g., scoliosis); and (4) no history of systemic diseases (rheumatic diseases of the spine or carcinoma).
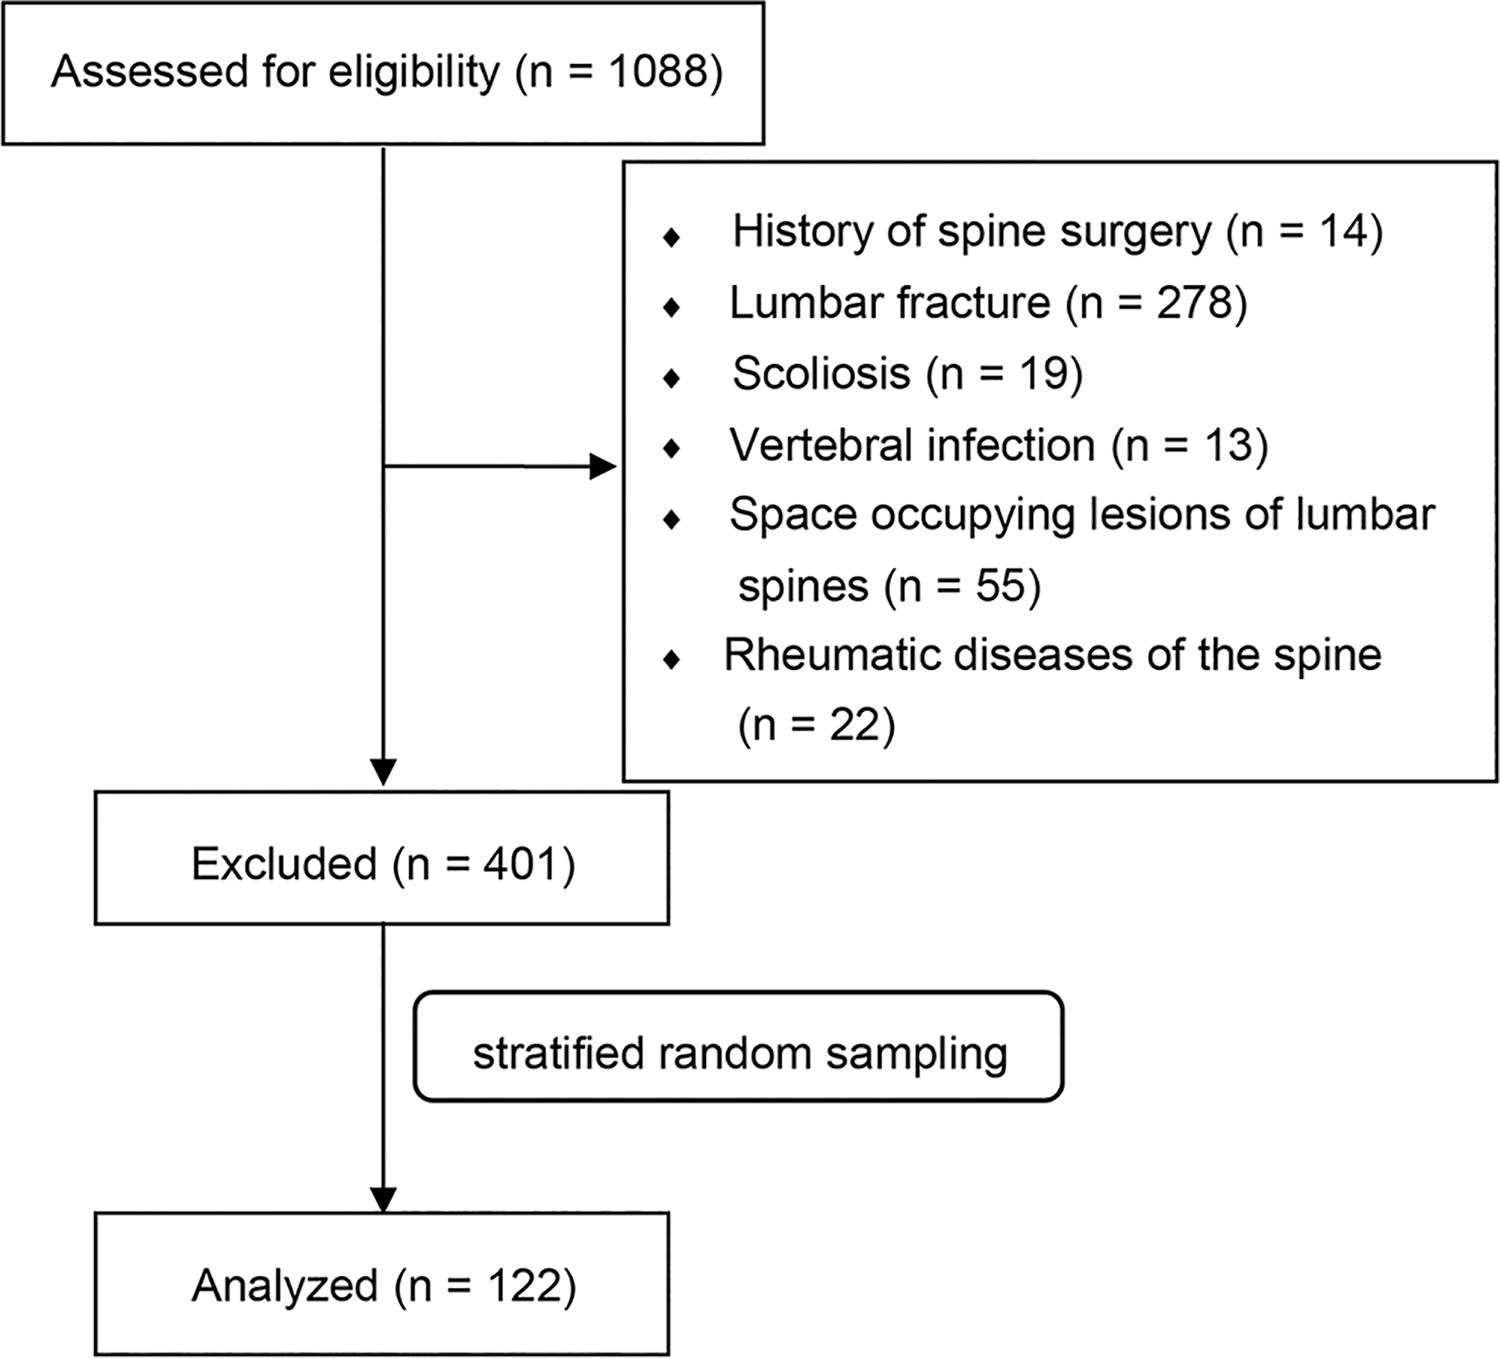
Flow diagram showing participant screening, exclusion, and analysis.
The study protocol was approved by the ethics committee of Renji Hospital, School of Medicine, Shanghai Jiao Tong University. Informed consent was obtained from each patient prior to the imaging examination.
Magnetic resonance imaging protocol
As reported previously by Yu et al., 12 all T2-weighted images were acquired using the same 3.0 T imaging system (Magnetom; Siemens, Erlanger, Germany) with a repetition time of 3220 ms and an echo time of 120 ms. Slice thickness was 4 mm. The acquisition matrix was 512 × 512, and the field of view was 310 mm. We then obtained and evaluated Original Digital Imaging and Communications in Medicine files from transverse oblique MRI images parallel to the superior end plate of L4, L5 and S1.
Computed tomography protocol
Preoperative patients who were eligible for CT underwent imaging with an eight-slice multidetector CT scanner (Lightspeed Ultra; GE, Milwaukee, Wisconsin). Each patient underwent unenhanced lumbar CT performed with a sequential scan protocol with slice collimation of 8 × 2.5 mm (120 kVp, 320/400 mA for 0.220 lb body weight) during a single end-inspiratory breath hold (typical duration, 18 s). For the lumbar scan, 256 contiguous 2.5 mm slices of the lumbar region were acquired, covering a 150 mm area above the level of S1. The evaluation of CT scans was performed with blinding to clinical and personal data. All of the CT scans were evaluated separately by two professional musculoskeletal radiologists who were blinded to patient identifiers. The results showed good intra- and inter-rater reliability.
Disc degeneration assessment
Disc degeneration assessment used the disc degeneration grade described by Pfirrmann et al. in 2001. 6 Observers were provided with Pfirrmann et al.’s original article to confirm the grade at the time of evaluation. Two experienced musculoskeletal radiologists, and two experienced spine surgeons, analyzed the L4–L5 lumbar intervertebral disc from each patient on T2-weight sagittal MRI images using Picture Archiving and Communication Systems (PACS), version 11.4 (Carestream health, Shanghai, China). Independently, more than half of the selected grade was recorded. If there was a dispute, then images were reevaluated until more than half of the observers agreed.
Laminar slope angle measurements
Laminar slope angle was measured with PACS, version 11.4 (Carestream health, Shanghai, China). We reconstructed pre-operation CT in three dimensions. We then proofread the central axis in parallel with the direction of the spinous process on the axis CT image and with the postural tilt of the spine on the coronal image. We then chose the sagittal images at the level of the tip of the unilateral facet joints (Figure 2). Evaluators analyzed the selected sagittal CT images using Chen et al.’s method, although Chen et al. obtained measurements on lateral radiographs. 13 We drew two separate lines connecting the tip of the superior facet with the base of the inferior facet and connecting the midpoints of the anterior and posterior vertebral cortices; we then measured the intersecting angle between the two lines. We selected L4 and L5 axis position on sagittal CT images, measured the corresponding LSA, and calculated the absolute value of the difference between the two adjacent segments of LSA (Figure 3)

The proofreading procedure for measuring the lamina slope angle on a sagittal image from three-dimensional computerized tomography.
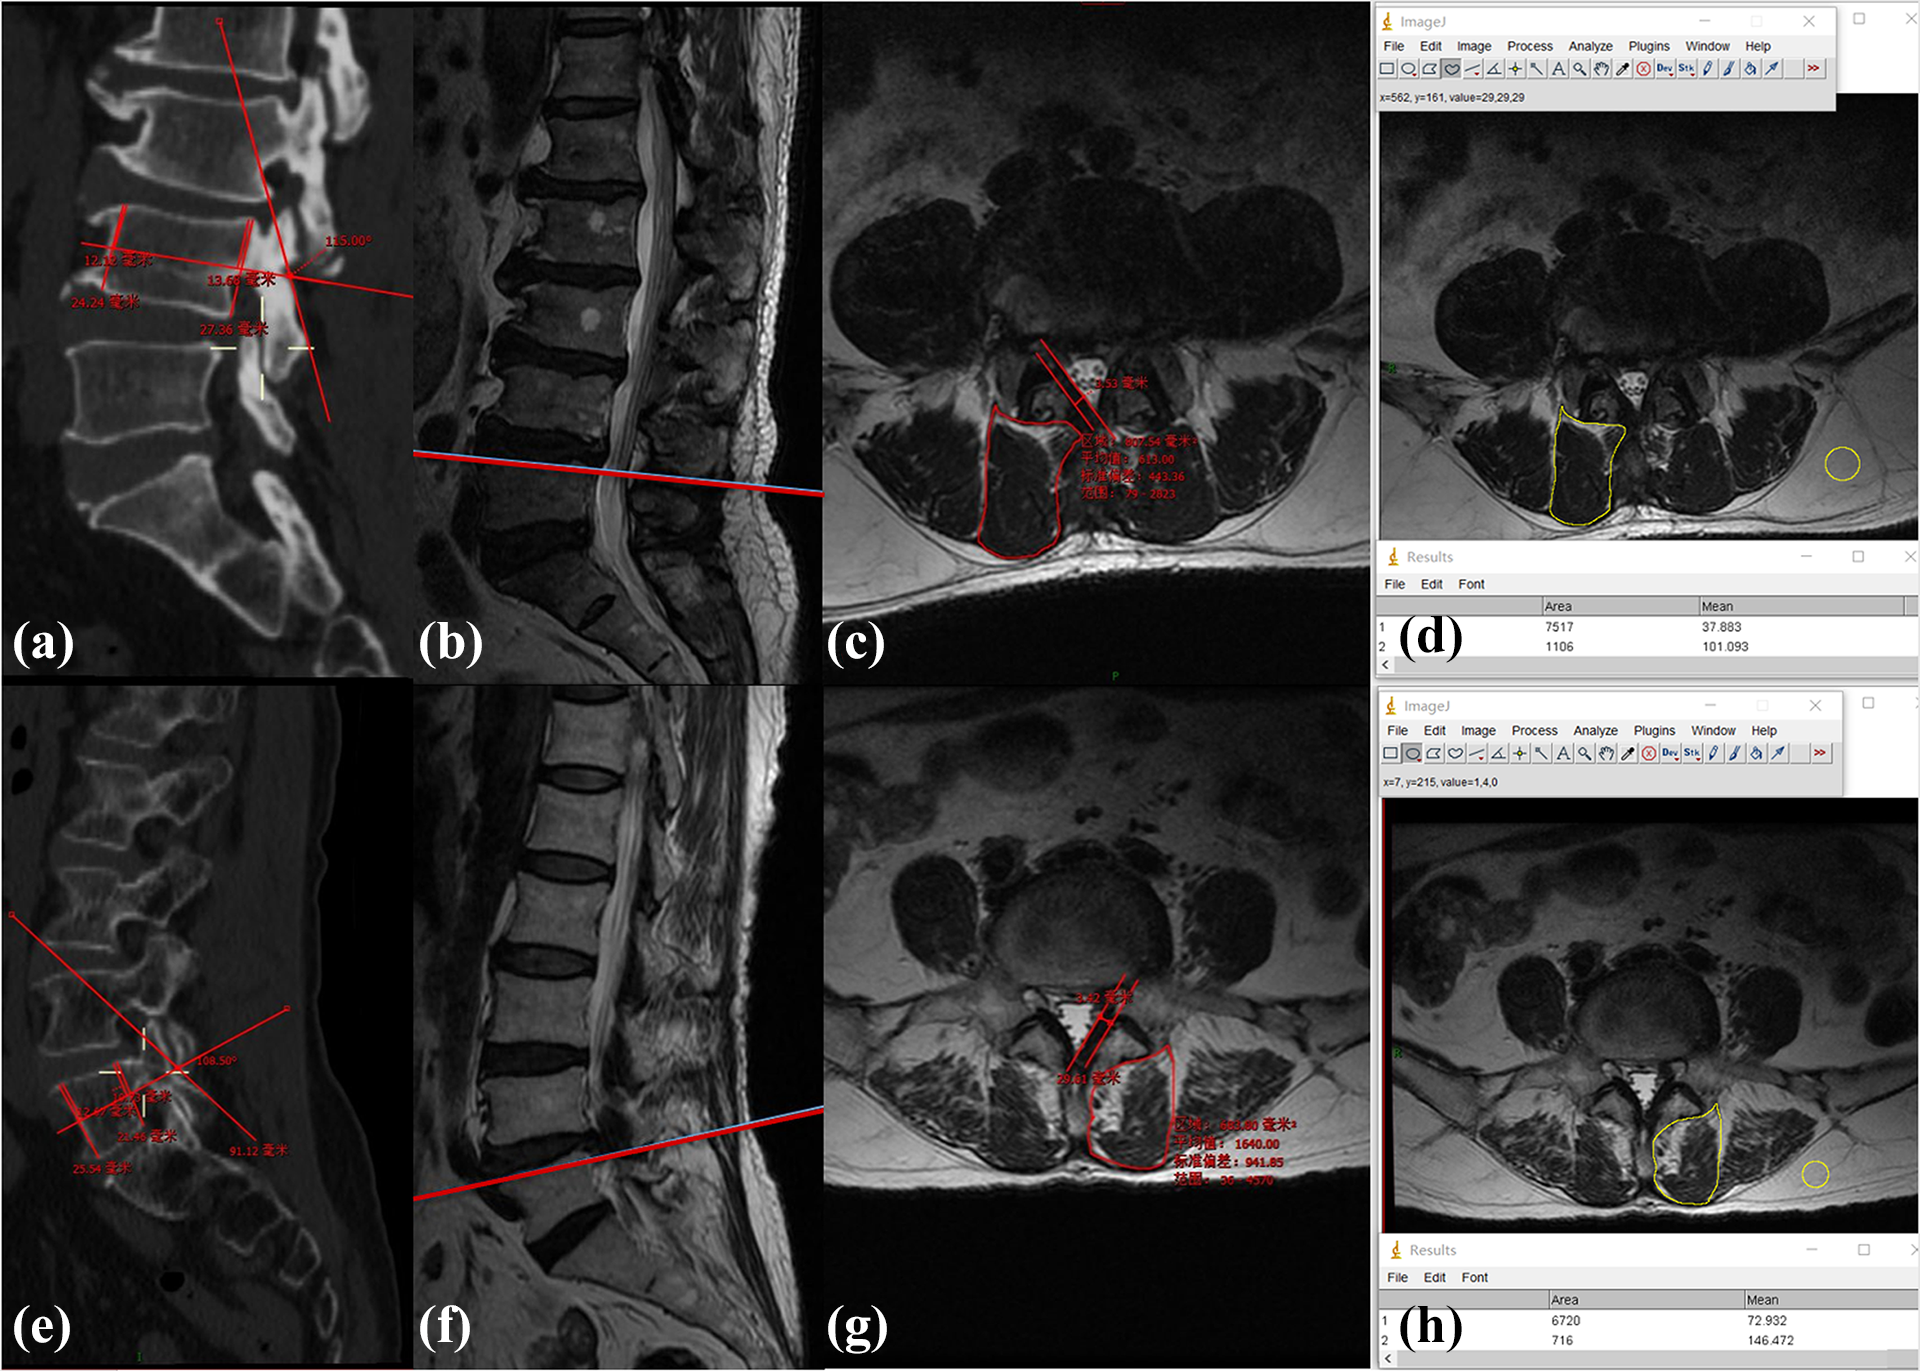
(a to d) are from a 64-year-old male patient, while (e to h) are from a 66-year-old female patient. (a) shows the LSA of L4, while (e) shows the LSA of L5 on a sagittal CT image. (b and f) was chosen as the sagittal MRI image with which to analyze disc degeneration. (c) shows the right CSA of the multifidus, (g) shows the left CSA. (d and h) shows the left and right muscle-fat index, as derived by Image J software.
Muscle measurements and analysis
Muscle measurements and analysis were carried out with Image J software, version 1.42q (National Institutes of Health, Bethesda, Maryland) following the method described in our previous article. 12 Observers then analyzed the selected axial images; all evaluators were blinded to the experiment and to each other. We selected the Axial slice at the level of the L5 vertebral body upper endplate to calculate L4–5 muscle CSA (Figure 3). Measurements were performed separately for the right and left sides at this level. Cross-sectional area, a parameter indicating the general size of the multifidus muscle, was defined by manually outlining the innermost fascial boundary surrounding the muscle. Fat lying between the muscle and lamina, or spinous process, was included in the cross-sectional area; these were all measured separately using the software. Interindividual comparison of intramuscular fatty infiltration was obtained with a widely accepted index, the muscle-fat index, which represents the ratio of mean signal intensity in a region of lean muscle tissue relative to the signal intensity in a homogeneous region of fat (Figure 3).
Thickness of the ligamentum flavum
The thickness of the ligamentum flavum was measured on axis T2-weight MRI images with PACS, version 11.4 (Carestream health, Shanghai, China). We located the spinal level of the L4–5 intervertebral spaces on sagittal T2-weight MRI images and selected the axial slice at the level of the L5 vertebral body upper endplate. 14 –17 We then drew two parallel lines h along the direction of the ligamentum flavum and chose the maximum distance between the dural side and the dorsal side. The maximum thickness of the LF was measured on both the right and left sides (Figure 3).
Reliability tests
To ensure the objectivity of the results, all measurements of muscle, ligamentum flavum, and lamina morphometric parameters were repeated by the radiologists and surgeons 2 weeks after the initial evaluation; this was important for interrater repeatability analysis. To avoid bias, all of the radiologists and surgeons were blinded to the study design; consequently, when measuring the muscle-fat index, they all ignored the laminar slope angle. The mean of the data was then used in the primary analysis.
Statistical analysis
Statistical analyses were performed with SPSS software, version 24.0 (IBM, Armonk, New York). The association between age and measurement indexes were determined by the independent-samples T-test. The association between laminar slope angle and other parameters were determined by Pearson correlation. Partial correlation was used to analyze the correlation of other remaining variables while controlling age variables. The reliability of the measured parameters was evaluated using intraclass correlation coefficients (ICC). Significance was set at p < 0.05 and values represent mean ± standard error (SE).
Results
A total of 122 were selected from the initial group of 687 patients and were included in our study. There were 66 men and 56 women (1.18:1). The mean age was 50.97 ± 14.78 years, ranging from 22 to 86 years. The descriptive anthropometric characteristics of the patients are shown in Table 1. The Cronbach’s alpha was 0.67; thus, the quantity of all measurements had good credibility. The independent-samples T-test showed that there was no significant difference in LSA when compared between the male and female group (Table 2). Males were younger than the females. Women also had a smaller multifidus and more serious fatty infiltration.
Patient demographic characteristics.

Result of independent-samples T-test.
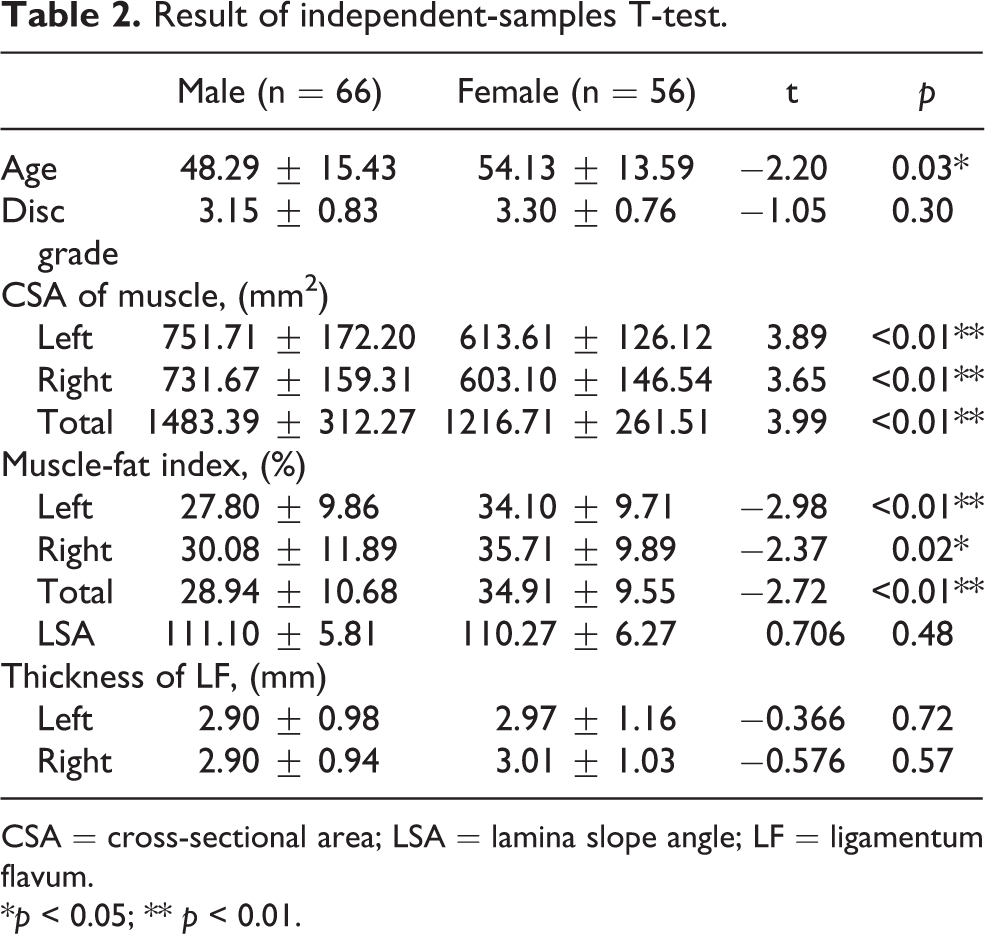
CSA = cross-sectional area; LSA = lamina slope angle; LF = ligamentum flavum.
*p < 0.05; ** p < 0.01.
Correlation analysis
Correlation analysis (Table 3) showed that age was a factor responsible for differences in the LSA of L4 and L5 (L4: r = 0.298, p < 0.05; L5: r = 0.303, p < 0.05), although there was no difference between age and the difference between the two segments of the LSA (r = 0.082, p > 0.05). Also, age was shown to influence the change in paraspinal structure, with the exception of the total CSA of fatty infiltration. With an increase in age, there was a smaller CSA of the multifidus and a smaller CSA of fatty infiltration on the left and right. There was a significant positive relationship between the degeneration of the lumbar disc and age. We also found significant differences when the ligamentum flavum was older and thicker. Next, we observed that the L4–5 disc degeneration was positively associated with the fatty infiltration, irrespective of whether we analyzed the left or the right (Left: r = 0.301, p < 0.05; Right: r = 0.286, p < 0.05). However, different segments showed differing results in terms of the CSA of the multifidus and the LSA. While there was a negative relationship between the LSA of L5 and the CSA of the multifidus (Left: r = −0.375, p < 0.01; Right: r = −0.352, p < 0.01), our research found no correlation between the LSA of L4 and the CSA of the multifidus (Left: r = −0.110, p > 0.05; Right: r = −0.150, p > 0.05). Finally, differences in the LSA did not affect the degeneration of the lumbar disc (r = 0.059, p > 0.05). Only the thickness of the right L4–L5 ligamentum flavum showed a negative relationship with the LSA of L4 (r = −0.227, p < 0.05).
Result of Pearson correlation coefficient.

CSA = cross-sectional area; LSA = lamina slope angle; LF = ligamentum flavum.
*p < 0.05; **p < 0.01.
Partial correlation analysis
Since almost all of the measurement indices were connected with age, we had to consider the impact of age when we explored the correlation between LSA and other measurement indices. Thus, we selected partial correlation analysis to exclude the interference of age. After controlling for age, our results (Table 4) revealed a strong negative relationship between the LSA of L4 and the thickness of the ligamentum flavum, irrespective of whether we considered the left or the right (Left: r = −0.303, p < 0.01; Right: r = −0.340, p < 0.01). There was no correlation with the CSA of the multifidus and fatty infiltration (left multifidus: r = 0.248, p > 0.05; right multifidus: r = 0.225, p > 0.05; left muscle-fat index: r = 0.033, p > 0.05; right muscle-fat index: r = 0.016, p > 0.05). There was no significant relationship between the LSA of L5 and any of these measurement indices. However, the LSA did not affect degeneration of the lumbar disc (L4: r = −0.141, p > 0.05; L5: r = −0.171, p > 0.05).
Result of partial correlation coefficient.

CSA = cross-sectional area; LSA = lamina slope angle; LF = ligamentum flavum.
*p < 0.05; **p < 0.01.
Discussion
Low back pain (LBP) is highly prevalent across the world, affects all ages, and is a the most common reason for patients living with disability. 3,4,18 –21 A previous epidemiological investigation showed that 30.8% of the study cohort struggled with LBP over the course of 1 month, while the mean point prevalence was 18.3%. 4 LBP is common in people aged 60–65 years of age and can become more serious with age as the accumulation of mechanical stress damage increases. 22 Lumbar degeneration arises from a range of pathoanatomical alterations caused by mechanical stress, including lumbar disc degeneration, facet joint osteoarthritis, hypertrophic ligamentum flavum, and paravertebral muscle atrophy. 23 Lumbar spinal stenosis (LSS) is one causative factor for LBP; patients with this condition need to undergo lumbar surgery in order to release pain and intermittent claudication. The pathological changes associated with this condition also results in the degeneration of the lumbar discs, ligaments and facet joints. 24
The laminar slope angle was first proposed by Xu et al. in 1999. 9 As Xu et al. explained, the slope angle varies across different vertebral levels: the maximum angle was 129.0 ± 7.5° at the L3 level while the minimum angle was 97.8 ± 3.0° at the T9 level. Qin et al. 25 further reported that the thoracic laminar slope angle had a negative relationship with tension acting on the ligamentum flavum. Thoracic LSA may also represent an anatomical and biomechanical factor in the lower thoracic spine that could be related to thoracic ossification of the ligamentum flavum. To the best of our knowledge, hypertrophy and ossification are both part of the degenerative progression in the ligamentum flavum. Hypertrophy of the ligamentum flavum is affected by aging, molecular mechanisms, and other factors, and has also been reported to be a causative factor for LSS. 16 Thus, we considered whether the same phenomenon might existed in the lumbar region or whether other structures of the FSU are associated with the LSA. A diverse LSA may lead to different degenerative changes in these structures, ultimately resulting in LSS.
Our study was designed to investigate the relationship between the laminar slope angle and lumbar degenerative disease. Our results were in line with our previous hypothesis, at least to some extent. First, we found that age was an important element which correlated to almost all of the measurement indices except for the difference value of the two segment LSA. The reduction in the CSA of the multifidus, the increased lumbar disc degeneration grade, and the area of fatty infiltration, with increasing age is consistent with existing research. Furthermore, we discovered that LSA was positively related to age. In view of the patients, we included excluded the effect of fracture; this can be explained by the osteoproliferation caused by facet joint osteoarthritis (FJ OA). Age is known to be one of the risk factors of FJ OA; the main group of patients with FJ OA were those of advanced age. If FJ OA occurs repeatedly, it could lead to osteoproliferation in the facet joints. 26
Calculating the angle of the lamina slope, we drew one straight line connecting the tip of the superior facet and the base of inferior facet. As the facet joint protruded, the line lay flatter (as shown in Figure 4); consequently, LSA was larger. This is the opposite of vertebral compression. According to the three column theory, proposed by Dennis in 1983, and modified by Allen in 1984, the vertebra disc is composed of zones: the anterior and middle column, and the posterior column, featuring the ligamentum flavum, facet joints and the paraspinal muscle. 27 Compression changes in the vertebrae tend to be concentrated in the front of the vertebrae body, the anterior column. With a reduction in anterior vertebrae height, the horizontal plane of the vertebral body leans forward and downward; this results in the LSA becoming smaller (Figure 4).

α was the lamina slope angle. α1 represented the bigger LSA with facet joint osteoproliferation. α2 represented the smaller LSA with compression fracture.
The muscle-fat index is a ratio of the mean muscle area signal intensity, and pure fat signal intensity. Therefore, a larger index represents more fatty infiltration. Our results showed that age and disc degeneration was positively related to fatty infiltration; this concurred with Dahlqvist et al.’s opinion, who reported that the paraspinal muscles were more susceptible to fatty infiltration and age-related change, 28 and also Sun et al.’s conclusion 8 in that we need more exercise to slow down the age-related process of muscle atrophy and fatty infiltration.
When considering the effect of aging, we excluded age for partial correlation analysis. We believe that this practice optimized our results. This analysis showed a strong negative relationship between the LSA of L4 and the thickness of the ligamentum flavum, irrespective of whether we considered the left or right. The spine represents the axial bone which carries our upper body weight whenever it is stretched or remains still. 29 The ligamentum flavum, which consists of elastic fibers and collagen fibers, is part of the posterior ligamentous complex (PLC), and maintains the stability of the posterior column of the spine. 30 This was located under the lamina and connected the adjacent two vertebrae; thus, when the lumbar bears the upper body weight, gravity can be decomposed into tension along the lamina and vertical lamina tension (Figure 5). The tension along the lamina could be referred to as an acting force and according to Newton’s third law, the internal tension of the LF would be the reacting force equal to, and working against it. The internal tension of LF can be described as FLF = G*Cosβ, where G represents the upper body gravity, α represents LSA and β∝α (Figure 4). The angle sum of a triangle is 180. Thus, in a right triangle β∈[0, 90°] and the Cosine graph was a descending curve. Using this equation, β was negatively related to Cosβ. G was a constant quantity for an individual; therefore, α was also negatively related to FLF. Therefore, the tension along the lamina was negatively correlated with LSA. Hayashi et al. previously reported that LF, with concentrated mechanical stress, showed degeneration with disruption of the elastic fibers and an increase in the cartilage matrix increase; this is similar to hypertrophied LF from patients with LSS. 17 When LSA was small, the mechanical stress is larger, and the corresponding LF was more likely to be hypertrophied. This explains why the thickness of the ligamentum flavum has a strong negative relationship with the LSA of L4. The reason why we use the L4/5 segment in the spinal functional unit (FSU) is that the ligamentum flavum is located at the L4/5 segment, which connects L4 and L5. During our activities, the lower vertebral body serves as a base. Therefore, traction of the L4/5 ligamentum flavum is related mainly to the L4 lamina. This is why we believe that this process is related to the LSA of L4 but not to L5.
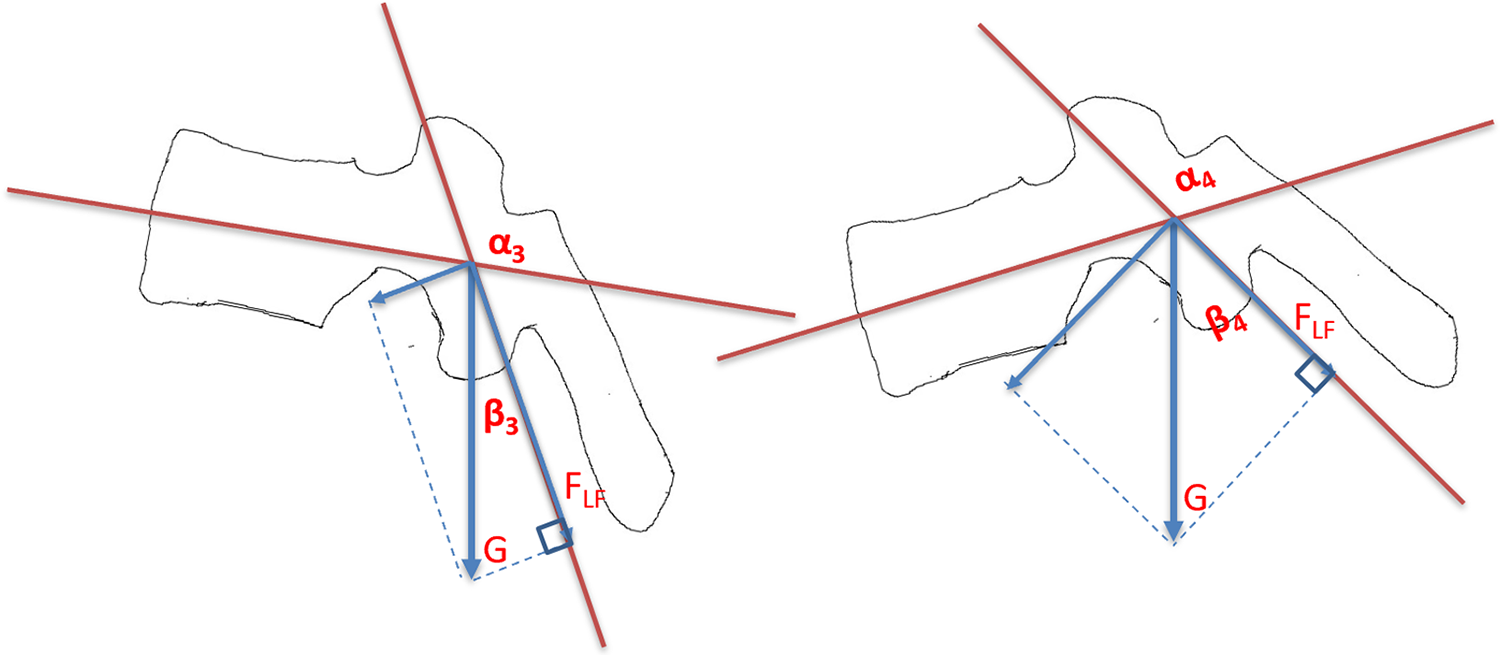
α3 represents the LSA of L4, while α4 represents the LSA of L5. This photograph shows the force analysis for the ligamentum flavum beneath the lamina. “G” represents the gravity of our upper body, while “FLF” represents the internal tension of LF.
There are several limitations in our research that should be taken into consideration. First, this was a study based in a single center; our conclusions therefore need to be verified in future multi-center studies. Second, we did not consider the effect of body mass index (BMI), which can affect fatty infiltration, the size of the multifidus muscle, and cause stress on the ligament flavum. Osteoproliferation appeared to be associated with the LSA, although our results did not consider the grade of osteoproliferation in the facet joints. Further research could explore the relationship between these factors. With our aging society, it is evident that more and more people are suffering from osteoporosis as they grow older; this has been linked to a higher risk of osteoporosis vertebrae compress fracture (OVCF). 31 Furthermore, as age increases, it is evident that the accumulation of mechanical stress damage also increases. Since aging is positively correlated with vertebral compression, older people would have a smaller LS; this could be a reason for the high prevalence of LSS in senior citizens, considering the progression of the disease.
Conclusion
We found that LSA increases with age, and therefore, provides a good index to reflect the morphological differences of the individual lumbar vertebrae. Our results showed that LSA will not affect the degeneration of the intervertebral disc, or the size and quality of the multifidus, but it will have a certain degree of influence on the hypertrophy of the ligamentum flavum. The smaller the LSA, the thicker the corresponding segment of ligamentum flavum, and the higher the risk of lumbar spinal canal stenosis in future. There were also some limitations in our study that need to be considered: (1) the sample size of this study was insufficient; (2) other factors affecting hypertrophy of the ligamentum flavum, such as obesity, were not excluded; and (3) spinal pelvic parameters have previously been confirmed to be significantly related to health-related quality of life (HRQOL). Whether changes in the spinal pelvic parameters will lead to hypertrophy of the ligamentum flavum was not evaluated in this study. Further studies on the influence of LSA on hypertrophy in the ligamentum flavum should aim to exclude or include the influence of relevant factors, so as to produce results that are more credible and based on scientific evidence.
Footnotes
Acknowledgements
Thanks for the support of imaging department of Renji Hospital, Shanghai Jiao Tong University School of Medicine. Thanks for the instruction of Professor Liu and Professor Chen.
Author contributions
Xiaosheng Yu and Junduo Zhao have contributed equally to this work.
Declaration of conflicting interests
The author(s) declared no potential conflicts of interest with respect to the research, authorship, and/or publication of this article.
Funding
The author(s) disclosed receipt of the following financial support for the research, authorship, and/or publication of this article: This work was supported by Medical-Engineering Joint Fund of Shanghai Jiao Tong University (No. YG2015MS50).