
Abstract
Purpose:
We aimed to longitudinally investigate individual thigh muscle changes using magnetic resonance imaging (MRI) during treatment with cast of ankle or foot fracture. Moreover, we aimed to demonstrate whether measurements of muscle cross-sectional area (CSA) are sensitive to muscle changes, contributing to simpler methods in clinical application .
Methods:
Ten patients undergoing treatment with cast of acute ankle or foot fractures were studied. Axial MRI (1.5 T) was conducted around the affected mid-thigh region after the injury (Pre), after maintaining a nonweight-bearing (NWB) period (approximately 28 days), and after finishing rehabilitation (recovery). Regarding individual thigh muscles, the total CSAs corresponding to 40% of the femoral length (FL) and the CSAs at 5% interval of the FL were longitudinally measured. Standardized response means (SRMs) were accessed for sensitivity in the muscle changes.
Results:
The total CSAs at NWB were significantly lower than those at Pre in vastus lateralis (10.9% ± 5.4%), vastus intermedius (8.4% ± 6.7%), and vastus medialis (11.2% ± 6.9%) (p < 0.01 for all). In contrast, at recovery, the only significant muscle atrophy relative to that at Pre was observed in the semitendinosus of the proximal 15% and 10% CSAs (p < 0.01 and p = 0.01, respectively). In all muscles, SRM using a single-slice CSA at or near the muscle belly was high.
Conclusion:
Thigh muscle changes differ according to the variations in individual muscles. CSA measurements at or near the muscle belly are simple methods and sensitive indicators of these muscle changes.
Introduction
Muscle strength measurement and electromyography have been used to evaluate muscle function. Both techniques may be difficult for patients with sustained musculoskeletal injuries or disorders because of the associated pain during these measurements. In contrast, recording muscle volume (MV) or anatomical muscle cross-sectional area (CSA) using magnetic resonance imaging (MRI) or computed tomography (CT) is possible for these patients. Generally, current MV measurements are accurate for estimating muscle strength and function. 1 –5 Blazevich et al. 3 proposed MV measurement as the best predictor of estimating knee extension moment under slow-speed contraction. However, measuring MV by viewing several dozen images is time-consuming. Therefore, CSA measurement facilitates the study of a larger number of patients. However, it remains unclear which part of CSA slices can be used to detect muscle changes in individual thigh muscles.
Many clinical research studies on MV or CSA measurements using MRI or CT have been published. Most of these studies have focused on the total thigh muscles or muscle groups, such as knee extensors and/or flexors. 6 –12 MRI allows us to further divide a muscle group into individual muscles because of its high contrast resolution. However, few studies measuring individual MVs of knee extensors and flexors using MRI have been conducted. 13 It is unclear whether the magnitude of muscle atrophy may differ for individual thigh muscles during the treatment of ankle or foot fracture, requiring ankle immobilization. It is also unclear whether the observed muscle atrophy may persist even after the scheduled rehabilitation. Finding answers to these questions will help us improve the rehabilitation program. By understanding that the individual muscles that might atrophy and that might have difficulty in recovering from muscle atrophy, we can selectively stimulate these individual muscles using neuromuscular electrical stimulation (NMES).
In the present study, we aimed to accurately demonstrate individual thigh muscle changes during treatment of ankle or foot fracture. In addition, we aimed to determine the slice CSAs that may detect individual muscle changes.
Methods
Patients
This study was conducted with the approval of the institutional review board. Informed consent was obtained from all individual participants included in the study. Inclusion criteria applied in this study were the consecutive patients aged 20–70 years who were diagnosed with acute ankle or simple foot fractures by four orthopedic surgeons using radiographic or CT examinations. Exclusion criteria were the patients who had existing musculoskeletal disorders or chronic illnesses requiring a cane before sustaining the injury. Thirteen patients were recruited, three of whom were excluded because they were claustrophobic during MRI. This study included 10 patients (4 men and 6 women; mean age: 59.0 ± 13.2 years, body height: 160.4 ± 8.6 cm, and body weight: 62.0 ± 9.2 kg).
Rehabilitation programs
Immediately after the diagnosis of the fracture, all patients’ ankles were immobilized in ankle casts. They were instructed to walk on crutches maintaining nonweight bearing (NWB) for approximately 4 weeks after the injury. During NWB, patients themselves performed hip adduction and abduction, knee extension and flexion exercises with at least 30 repetitions per day as instructed by the orthopedic surgeon and three physiotherapists.
After the orthopedic surgeon confirmed bony union based on radiographs and physical exam or CT images, the patients were asked to restart their body weight bearing, after removing the ankle cast (mean period required for the NWB: 28.1 ± 5.9 days). Scheduled rehabilitation programs were conducted at the outpatient department by the physiotherapists 1–2 times per week for 4 weeks. The first goal was to improve ankle range of motion using passive and active dorsal and plantar flexion exercises. Patients were also instructed to self-perform active ankle range of motion exercises daily.
After the orthopedic surgeon confirmed complete bone union of the fracture based on the X-ray images, as a final stage in the rehabilitation program, patients were instructed by the physiotherapists to perform daily squat and calf raise exercises (30 repetitions). The rehabilitation program was considered complete when the orthopedic surgeon ascertained no swelling and tenderness in the affected area and the patient was able to walk without a limp and pain (the mean for the programmed rehabilitation is 56.9 ± 16.3 days).
MRI acquisition
MRI of the affected legs was performed using a 1.5 T scanner (Excel ART; Toshiba Corp., Tokyo, Japan). First measurement was performed at baseline (Pre) followed by the examination and diagnosis. The second measurement was performed immediately before restarting body weight bearing after removing the ankle cast. The third measurement was performed after completing the rehabilitation program (recovery). The patients were instructed to avoid rehabilitation 6 h before the performing the third measurement.
A tablet was put as a marker on the midpoint from the trochanter to the proximal fibular head to indicate the mid-thigh. A locator system scout scan (repetition time/echo time (TR/TE): 185/15 ms; field of view: 400 mm; 128 × 256 matrix) of 5-mm-thick coronal slices at 5-mm intervals was performed to determine the coronal and sagittal femoral bone axes (Figure 1). Subjects were required to rest in prone positions for 15 min to avoid fluid shifts, and T1-weighted spin echo with 10-mm-thick axial images (TR/TE: 625/15 ms; field of view: 170 mm; 512 × 512 matrix) was taken around the mid-thigh. During scanning, patients’ ankles were supported by a box to obtain neutral position and to maintain the patellar direction in the right anterior position.
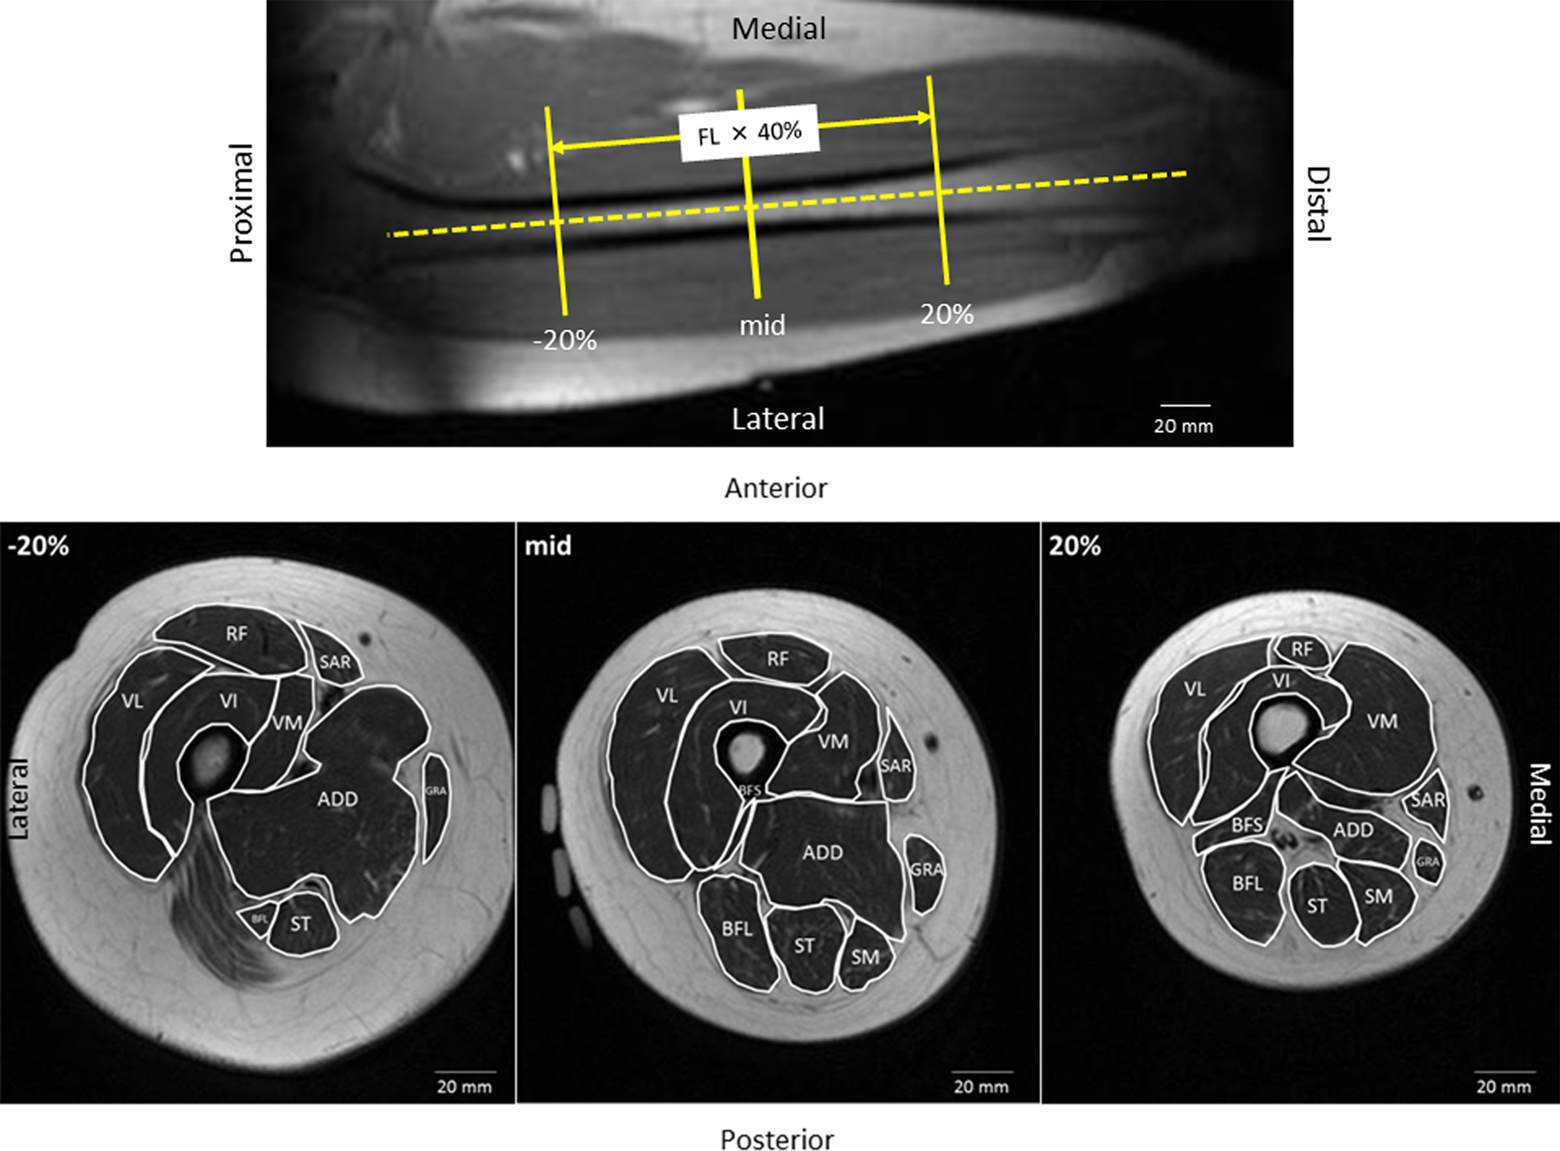
Typical example of a scout scan to determine the coronal femoral bone axis. Segmented axial magnetic resonance images (T1-weighted image) of the right thigh of a 41-year-old woman at the proximal 20% (−20%), mid-thigh, and distal 20% slice (+20%) of the FL. The segmented area shows the CSA of individual muscles. CSA: cross-sectional area; FL: femoral length.
CSAs analysis method
Region of interest (ROI) was defined as the 40% area of the femoral length (FL) around the mid-thigh. The FL was defined as the distance between the femoral trochanteric tip and the proximal fibular head. Inconsistencies were observed in ROI positioning among Pre, NWB, and recovery. To match the slice position among Pre, NWB, and recovery, the shape of visible subcutaneous vessels at Pre was considered to correspond to those of NWB and recovery. The CSAs corresponding to the ROI were measured by manually tracing around the mid-thigh with 10-mm gaps using the Medical Image Processing, Analysis, and Visualization v7.3.0 software (National Institutes of Health, Bethesda, MD, USA). The CSA values at the gaps were calculated as the average of both neighboring CSA values proximal and distal to the gap image. Rectus femoris (RF), vastus lateralis (VL), vastus intermedius (VI), vastus medialis (VM), biceps femoris long head (BFL), biceps femoris short head (BFS), semitendinosus (ST), semimembranosus (SM), adductors (ADD), sartorius (SAR), and gracilis (GRA) muscles were segmented (Figure 1). Visible intermuscular fat, vessels, neurons, and connective tissues were not included. Individual CSA of the thigh muscles was each evaluated at 5% intervals of the FL around the mid-thigh to the proximal and distal 20% of the FL. Proximal CSAs from the mid-thigh were expressed as negative percentage, and the distal CSAs were expressed as positive percentage (Figure 1). All measurements were performed by a trained image analyst.
Reproducibility of the CSA analysis and test–retest
In our pilot study (unpublished), MRI scans of right thigh of five healthy subjects were performed two times with repositioning of the subjects 15 min after the first scan. The trained image analyst measured individual CSAs of three slices scanned around the mid-slice of the ROI. Intraclass correlation coefficient for the test–retest was RF: 0.99; VL: 0.98; VM: 0.97; VI: 0.96; BFS: 0.94; BFL: 1.00; ST: 1.00; SM: 0.98; ADD: 0.97; SAR: 0.96; and GRA: 0.98. Thus, in this study, the reproducibility of the CSA analysis and test–retest is excellent.
Statistics
An a priori power analysis of one-way repeated-measures analysis of variance showed that a sample size of 9 corresponded to effect size of 0.40, a power of 0.8, p value of 0.05, number of measurement of 3, correlation among repeated measures of 0.80, and nonsphericition correction ∊ of 0.5. The power analysis was performed using G*Power v3.1 software (Heinrich-Heine-Universität, Düsseldorf, Germany).
In this study, a nonparametric test was used, because not all values exhibited normal distribution. If the Friedman test exhibited significant values (p < 0.05) between Pre and NWB and recovery, a post hoc test modified by Bonferroni inequality was conducted. In the Bonferroni inequality test, p < 0.025 was regarded as a significant difference. All statistical tests were performed using SPSS v22 statistical software (SPSS, Inc., Chicago, IL, USA). Muscle change rate was calculated as 100 × ((Pre − NWB or recovery)/Pre) (%). Standardized response mean (SRM) was calculated as the rate of mean change between Pre and NWB and recovery divided by standard deviation of the rate of change, which was used to evaluate the change sensitivity. 14
Results
Changes in individual thigh muscles during the treatment of ankle or foot fracture
Table 1 shows decreased rates and SRMs in total CSAs of the ROI between Pre and NWB and recovery. In terms of VL, VI, and VM, the total CSAs measured at NWB were significantly lower than those at Pre. The decreased ratio of the total CSAs between Pre and NWB was 10.9 ± 5.4% for VL, 8.4 ± 6.7% for VI, and 11.2 ± 6.9% for VM (p < 0.01 for all), while no significant differences were observed in the total CSAs of the other muscles between Pre and NWB and recovery.
Decreased rates of total CSAs between Pre and NWB and Pre and recovery.a
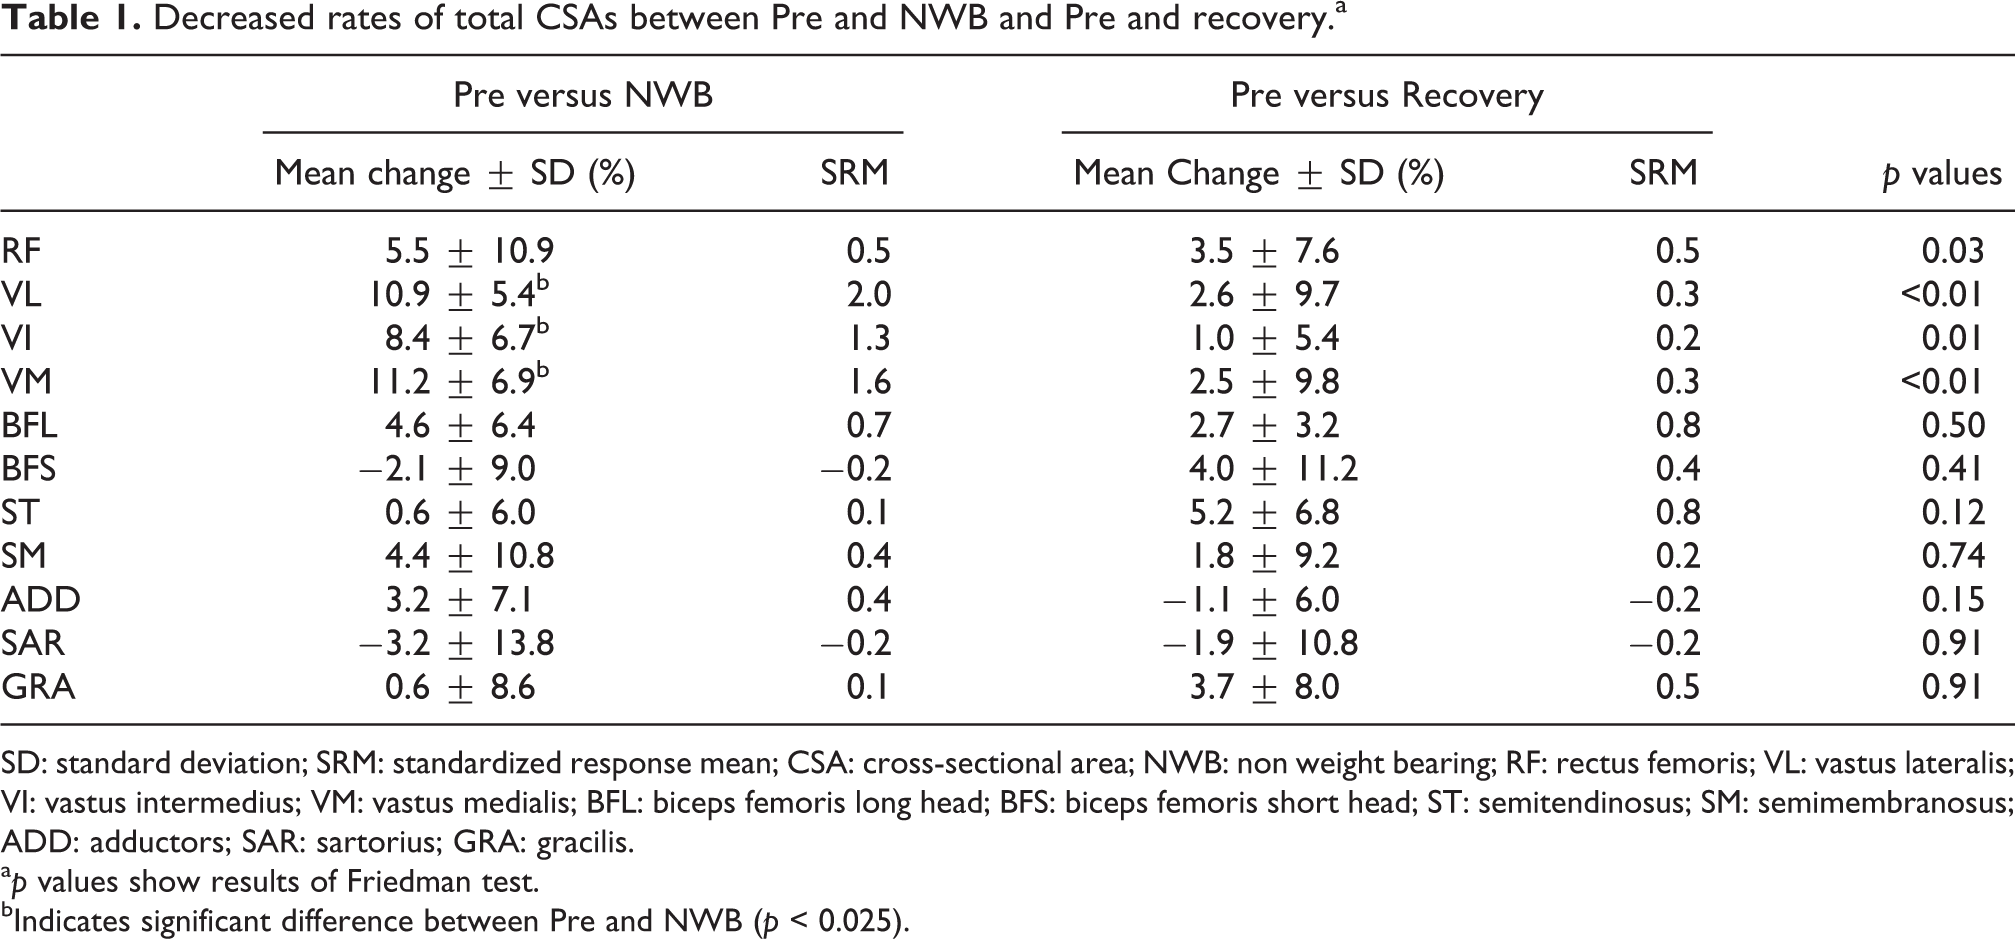
SD: standard deviation; SRM: standardized response mean; CSA: cross-sectional area; NWB: non weight bearing; RF: rectus femoris; VL: vastus lateralis; VI: vastus intermedius; VM: vastus medialis; BFL: biceps femoris long head; BFS: biceps femoris short head; ST: semitendinosus; SM: semimembranosus; ADD: adductors; SAR: sartorius; GRA: gracilis.
a p values show results of Friedman test.
bIndicates significant difference between Pre and NWB (p < 0.025).
Slice CSA detection of individual muscle changes
Figure 2 shows the CSA distributions measured at Pre, NWB, and recovery in the individual thigh muscles. In terms of VL and VM, CSAs at all intervals measured at NWB were significantly lower than those at Pre (p < 0.01 for all). In VI, CSAs measured at NWB from the proximal 10% to distal 20% levels except the proximal 5% and the distal 10% levels were significantly lower than those at Pre (p < 0.01 for all). The VI CSAs of the proximal 5% and the distal 10% levels measured at NWB tended to be lower than those at Pre (p = 0.03 and p = 0.04, respectively). In ADD, the proximal 20% CSA measured at NWB tended to be lower than that at Pre (p = 0.03). In the other muscles and CSAs, no significant differences were observed between Pre and NWB. In contrast, only ST CSAs of the proximal 15% and 10% levels measured at recovery were significantly lower than those at Pre (p < 0.01 and p = 0.01, respectively), and no significant differences were observed between Pre and recovery in the other muscles and CSAs.

Distribution of (a) individual knee extensor muscle CSAs, (b) individual knee flexor muscle CSAs, and (c) ADD, SAR, and GRA CSAs. Black circles show the distribution of mean CSAs at 5% intervals of the FL pre-NWB (Pre), black triangles show that post NWB, and white circles show that at recovery. Error bar shows the standard errors of Pre and NWB. * indicates significant difference between Pre and NWB. † indicates significant difference between Pre and recovery. CSA: cross-sectional area; NWB: nonweight bearing; FL: femoral length; ADD: adductors; SAR: sartorius; GRA: gracilis.
SRMs in each CSA at the interval level between Pre and NWB and recovery are represented in Figure 3(a) for individual knee extensors; in Figure 3(b) for individual knee flexors; and in Figure 3(c) for ADD, SAR, and GRA. When considering sensitivity to muscle size changes based on SRM, in terms of VL at NWB, the SRM from the proximal 5% to distal 15% levels except mid-thigh was relatively high (1.8–2.1), similar to the case of the total CSAs (2.0). In VI at NWB, the SRM of the distal 5% and 15% levels was relatively high (1.4 and 1.5, respectively), similar to the case for the total CSAs (1.3). In VM at NWB, the SRM of the proximal 5% level was greatest (2.1) and the SRM from the proximal 15% to distal 20% levels, except the proximal 5% level, was almost the same (1.2–1.4), similar to the case for the total CSAs (1.6). In ADD at NWB, the SRM of the proximal 20% level was low (0.6), similar to the case for the total CSAs (0.4). In ST at recovery, the SRM of the proximal 15% level was relatively high (1.6); however, the SRM of the proximal 10% was low (0.9), similar to the case for the total CSAs (0.8). Although there were no significant differences between Pre and NWB and recovery in BFL and GRA CSAs and in BFL at NWB, the SRM of the distal 5% and 10% levels was relatively high (0.8 and 1.0, respectively). In BFL at recovery, the SRM of the distal 10% level was relatively high (0.7). In GRA at Recovery, the SRM from the proximal 15% level to mid-thigh except the proximal 10% level was relatively high (0.7–1.0).
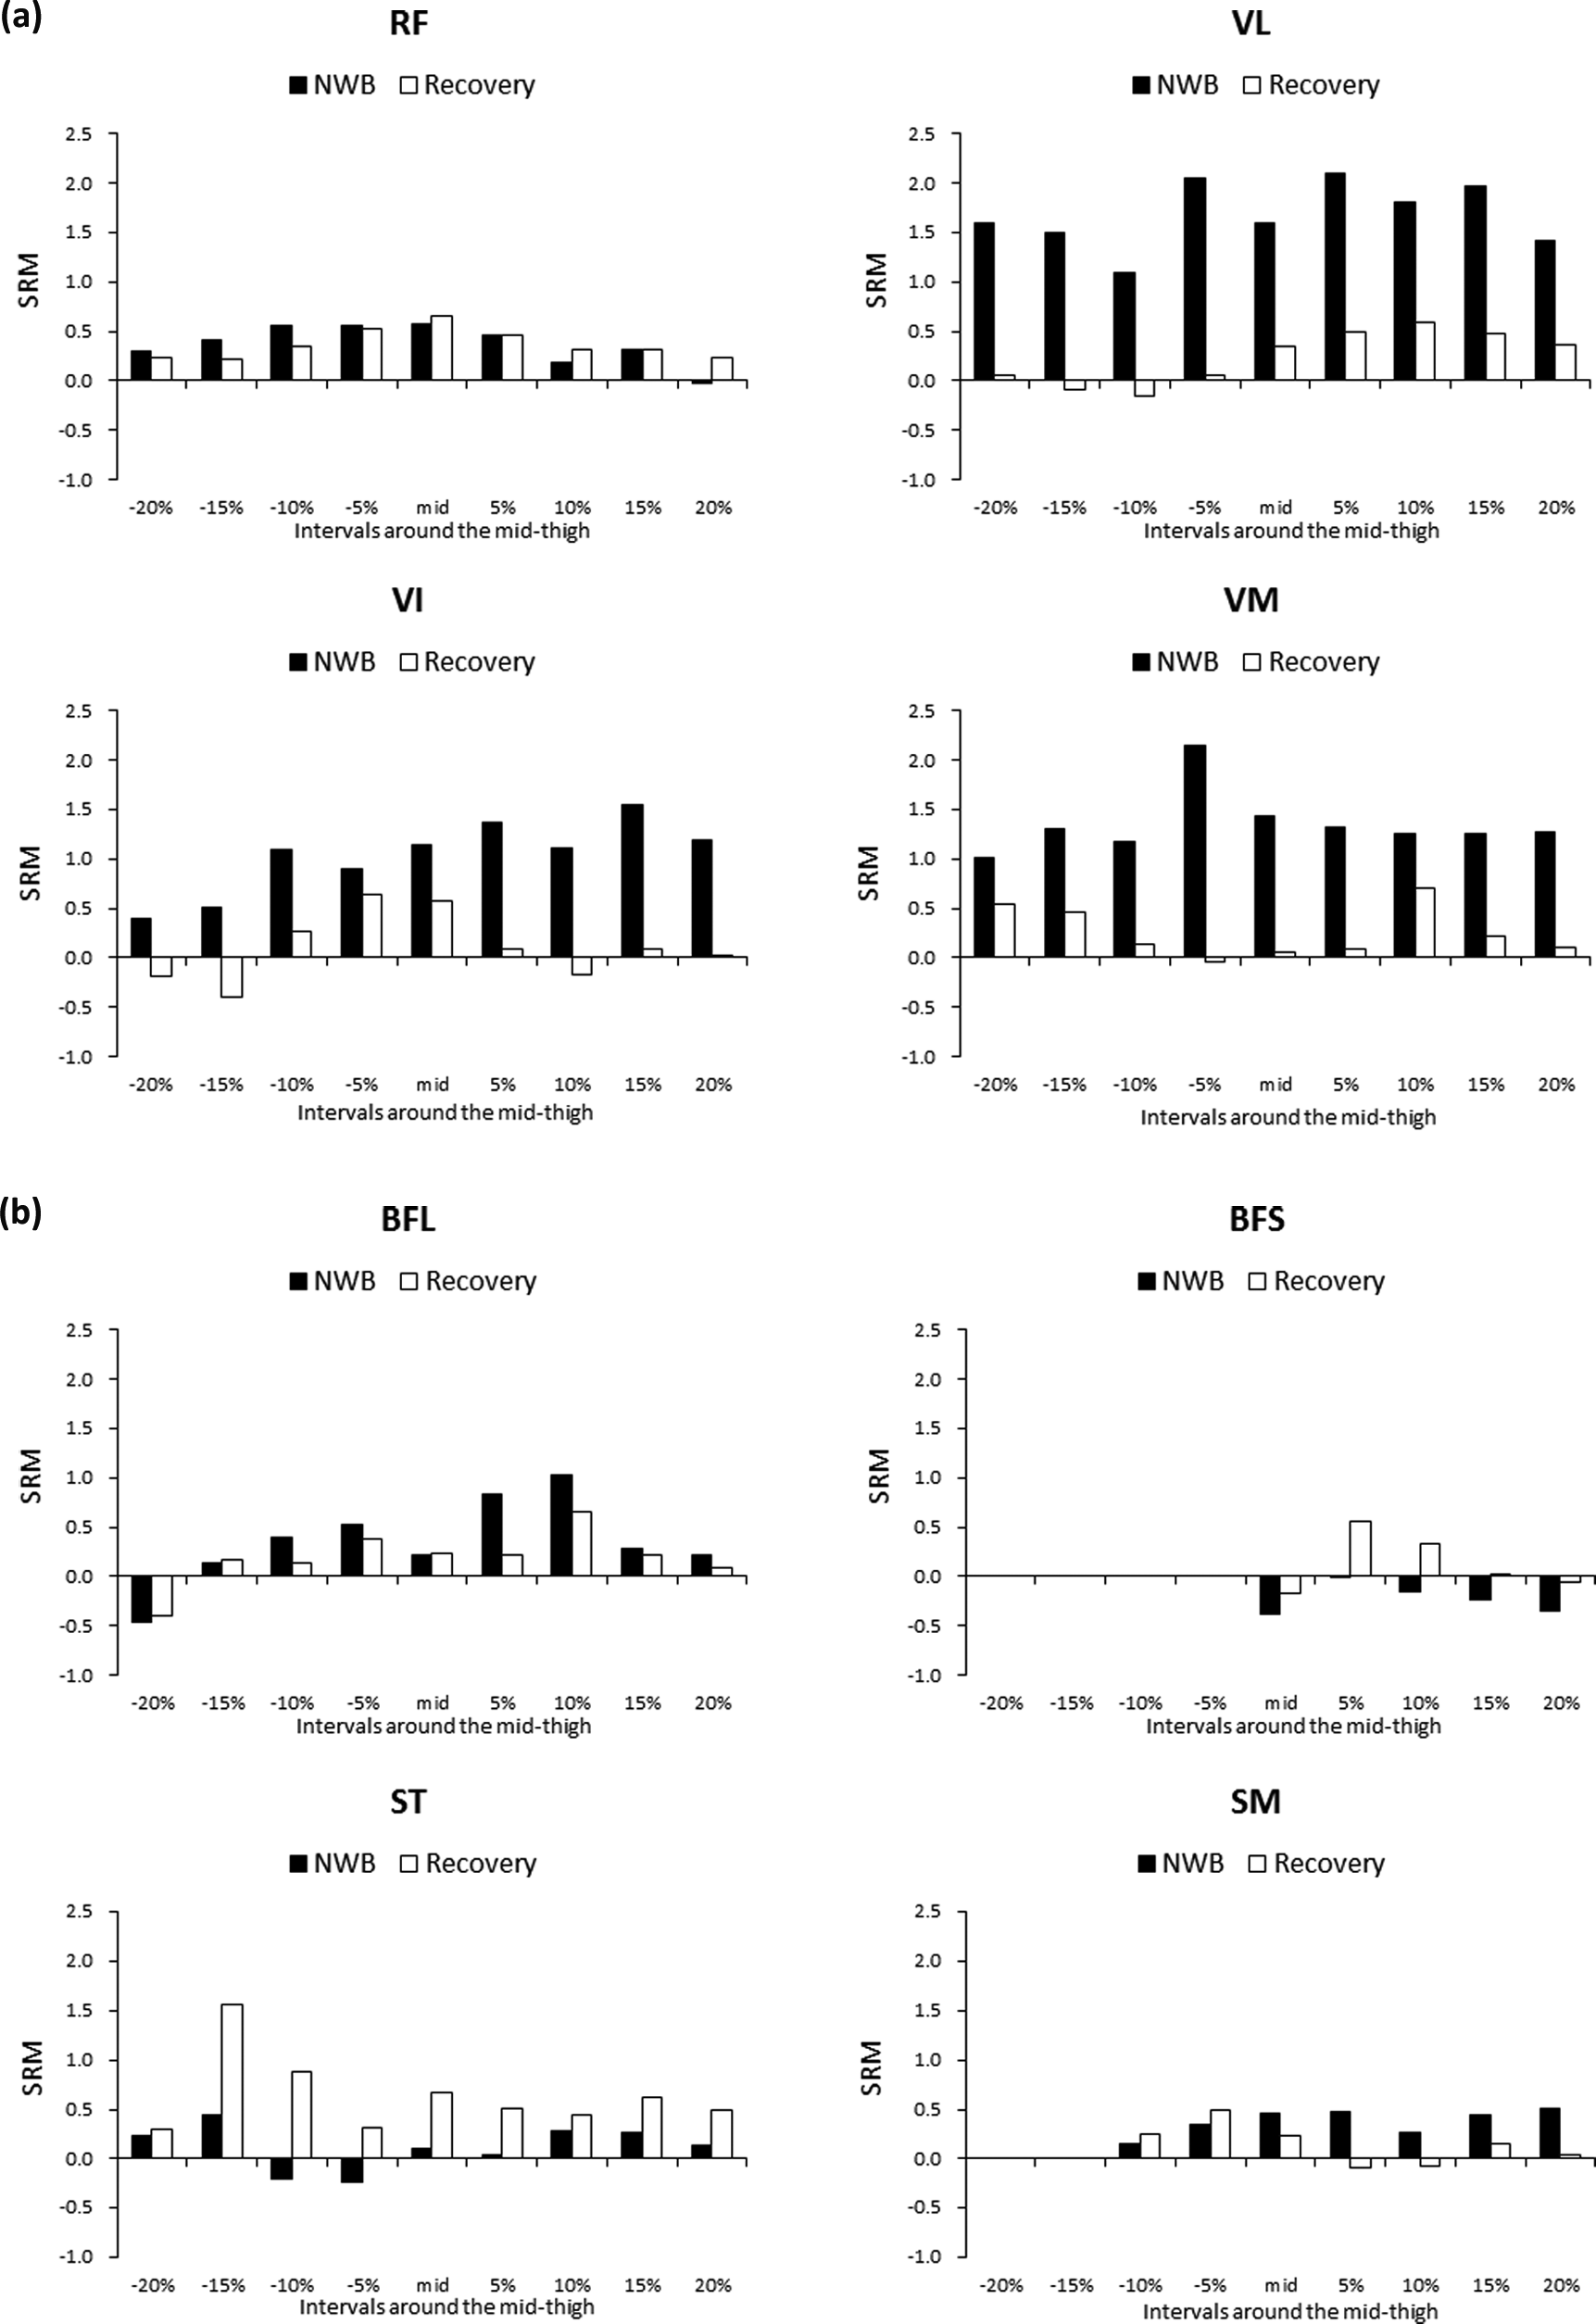
Distribution of the SRM in (a) individual knee extensor muscles, (b) individual knee flexor muscles, and (c) ADD, SAR, and GRA. Black bars (NWB) show SRM calculated as decreased rates between Pre and NWB divided by SD of the decrease rates. White bars (recovery) show SRM between Pre and recovery. NWB: nonweight bearing; SRM: standardized response mean; ADD: adductors; SAR: sartorius; GRA: gracilis; SD: standard deviation.
Discussion
To the best of our knowledge, this is the first study to longitudinally investigate individual thigh muscle changes using MRI scan during treatment with cast of ankle or foot fracture. The results of this study showed that significant muscle atrophy in patients’ VL, VI, and VM after approximately 4 weeks of NWB with an ankle cast. However, the observed muscle atrophy was not significant after the rehabilitation program. Moreover, CSA of individual muscles should be accessed at or near the muscle belly to detect muscle change.
When patients walk using crutches maintaining NWB with the ankle cast, they should lift their affected foot off the ground. To maintain this leg position, their hips and knees need to be lightly flexed, which might stimulate the RF to act on hip flexion and knee flexor muscles. In contrast, VL, VI, and VM may be rested and lead to muscle atrophy even if patients perform knee extension exercises. However, the scheduled rehabilitation post removal of the ankle cast is effective enough for the recovery of muscle atrophy. In the present study, we hypothesized that the atrophy at NWB might persist even after completing rehabilitation, based on a report by Lindström et al., 6 in which postoperative muscle atrophy in knee extensors persisted even 1 year after the anterior cruciate ligament reconstruction (ACLR) surgery. Interestingly, in this study, there was no significant differences in the muscle atrophy at NWB between Pre and recovery. We suppose that the muscle atrophy of knee extensors induced by an ankle or a foot injury may recover more easily than that induced by ACLR. However, the mean decreased rate at recovery exhibited small positive values: 2.6% for VL, 1.0% for VI, and 2.5% for VM in the total CSAs. Dirks et al. 15,16 reported that in healthy people leg disuse for only 5 days induced a 1.5–3.5% decrease in knee extensor CSA of the mid-thigh. In this study, the mean period between the injuries and the first MRI scan was 5.4 days; therefore, the muscle size measured at Pre might be relatively lower than that measured prior to the injury, which may lead to an underestimation of the muscle atrophy. In individual knee flexors, ADD, SAR, and GRA, only ST CSA of the proximal 15% and 10% levels exhibited a decrease at recovery (9.3% and 7.4%, respectively). Although we are unable to explain why only ST decreased among the knee flexors, we found that muscle responses after rehabilitation program for ankle or foot fracture may vary depending on the individual thigh muscles.
MRI scan findings enable us to effectively improve the rehabilitation programs. The results in this study suggested that we should stimulate the knee extensors (particularly VL, VI, and VM) more actively during NWB to attenuate muscle atrophy. However, resistance training, such as using weight, was inappropriate because the affected ankles or feet could not be rested, even when immobilized using the ankle cast. Therefore, during a long rest period for the treatment of an injury or a disease, NMES could provide beneficial effects to counter muscle atrophy. 15,17 Indeed, applying NMES for VL and VM may be successful in decreasing muscle atrophy during NWB and for early recovery from the muscle atrophy. Moreover, we should stimulate ST more actively after restarting body weight bearing following the removal of the ankle cast, and knee flexion resistance training or NMES for ST should be performed to prevent muscle atrophy in ST.
At NWB and recovery, the mid-thigh CSAs of RF, VI, and GRA are relatively sensitive to muscle atrophy; the distal 10% CSAs of VL, VM, and BFL; the proximal 15% CSA of ST; and the proximal 20% CSA of ADD. This result indicated that CSA of individual muscles should be accessed at or near the muscle belly to detect muscle atrophy. Similarly, in terms of knee extensors and flexors as muscle group, Akima et al. 18 reported that the CSA decrease induced by bed rest in healthy young people was observed at or near the muscle belly. Conversely, Hudelmaier et al. 14 showed that CSA measurement at the muscle belly or more proximal level could detect the increase most sensitively in knee extensors, knee flexors, and ADD after muscle strength training. In our study, at recovery, VL CSA at or near the muscle belly recovered completely, whereas VI and VM CSAs at or near the muscle belly did not recover completely. Therefore, site-specific effects of a rehabilitation treatment on individual muscles may differ according to the individual muscles.
Single CSA measurements were more sensitive to muscle changes than the total CSA measurements. However, regarding upper extremities, Roman et al. 4 reported that the increase in the ratio of CSA after resistance training was greater than that of MV. Measuring muscle changes based on a single-slice CSA resulted in an overestimation of the MV change. Therefore, our results may not show that single CSA changes exhibit a stronger correlation with the individual muscle function compared to the total CSA changes; however, they do show that we can sensitively detect muscle atrophy. Previously, in terms of muscle groups, several authors showed that MV measurement was more suitable than a single CSA measurement when estimating muscle function, 1,3 –5,19,20 whereas some authors reported that a single CSA measurement may be sufficient to monitor muscle changes. 14,21,22 Irrespective of a single CSA or MV measurement used for clinical application, depending on the purpose, it is important to more sensitively detect muscle atrophy.
This study had several limitations. Firstly, the total CSAs in this study were defined as ROI around the mid-thigh corresponding to 40% of the FL, which may not represent the true MVs of the individual muscles. Secondly, power analysis revealed that the required sample size was nine in the longitudinally observational study of one group. However, the period required for maintaining NWB and a rehabilitation treatment differed according to the type of fracture or the patients’ conditions. Therefore, the sample size in this clinical study may not have been highly adequate, without the risk of a type II error. If this study had included a larger sample size, a significant change in RF, ST, BFL, or GRA might have been observed. The simpler measurement of the single CSA can contribute to a larger sample size for this study. Finally, we did not exclude intramuscular adipose fat tissues from measured CSA, though we did exclude intermuscular adipose fat tissue.
In conclusion, thigh muscle changes differ according to variations in individual muscles during the treatment of ankle or foot fractures. Therefore, it is important to evaluate individual thigh muscles. Measuring the single CSA at or near the muscle belly is a simple and suitable method for detecting changes in individual muscles.
Footnotes
Authors’ note
This study was performed at Akita hospital.
Declaration of conflicting interests
The author(s) declared no potential conflicts of interest with respect to the research, authorship, and/or publication of this article.
Funding
The author(s) received no financial support for the research, authorship, and/or publication of this article.