
Abstract
Purpose:
This study aimed to investigate the influences of high-heeled shoe (HHS) parameters on gait cycle, center of pressure (COP) trajectory, and plantar pressure in young females.
Methods:
Twenty healthy adult females were recruited to participate in this study. Subjects walked on a treadmill at a fixed speed (1 m/s). Overall, six pairs of HHSs were evaluated, presenting two heel types (thin and thick) and three different heel heights (low: 3 cm, medium: 6 cm, and high: 8.2 cm). Subjects also wore flat shoes (heel height: 0.2 cm) as the control group.
Results:
The gait cycle, COP parameters, peak pressure (PP), maximum force, contact area (CA), and force–time integral (impulse) were measured. The comparison between these parameters when the volunteers wore thick heel and flat shoes at different walking conditions indicated that thin heels caused a significant increase in the pre-swing parameter, CA, and PP of the first toe and first metatarsus. Increased heel heights yielded smaller gait line lengths, single support lines, and smaller hindfoot areas. By contrast, increased anterior–posterior positions and plantar pressure parameter values were noted for the forefoot.
Conclusions:
Data analyses showed significant differences in the plantar pressure distribution associated with heel height and heel type at increased pressure in the first metatarsal and central forefoot region and decreased pressure in the midfoot and heel sections, thus increasing anterior shift. The results presented herein may allow for the design of HHSs with reduced adverse health effects on the wearer.
Introduction
Throughout history, high-heeled shoes (HHSs) have been extensively used to increase the height and improve the profile of the wearer. According to the American Podiatric Medical Association, 39–69% of women wear HHSs; furthermore, 40% of these women wear them daily. 1 –3 However, wearing HHSs may induce adverse effects on bones and the musculoskeletal system and cause lower back discomfort, forefoot pain, and hallux valgus. 4 –7
Moreover, several studies revealed that high heels cause alterations in balance and are responsible for changes in the center of pressure (COP) and plantar pressure. 8 –10 Previous studies indicate that the trajectory of the COP has always been used to assess walking stability. Multiple COP parameters, such as medial–lateral position, anterior–posterior position, and average distance of the COP from the mean position, were sensitive to deviations during extra inversion or eversion. 8
Previous studies have shown that heel rise can induce adverse biomechanical effects that may lead to uneven distributions of plantar pressure. In turn, this would reduce the stress on the hindfoot and increase the stress on the forefoot. 11 Furthermore, these reported changes in forefoot pressure have been associated with the impacts of HHSs on foot deformities, including the development of metatarsalgia, callus formation, increased rates of ulceration under the metatarsal heads, and the subsequent risk of painful bony deformities. 12,13
Research on heel height and heel type of high heels has been carried out worldwide based on gait patterns on the ground or on other surfaces. 14,15 However, to the best of our knowledge, this is the first time a treadmill was used in a survey on HHSs. Additionally, as this approach requires less space and allows for the use of harness support systems, it could be employed to perform comparisons under more standardized conditions (e.g. constant walking speed). 16,17 Therefore, treadmill gait analysis was an attractive alternative for this study.
Furthermore, most of the shoes used for research are non-customized, not only in terms of structure and style but also in terms of the material of the shoe. These factors result in nonnegligible errors that affect the accuracy of research conclusions.
The shoes used in this study were customized to reduce human error and improve the accuracy of the research. By studying the influences of different heel structures on the gait cycle, the COP, and the plantar pressure at a fixed walking speed, this study attempted to provide scientific advice to women regarding high heel choice.
Materials and methods
The participants in the survey included adult female volunteers from Fudan University, Shanghai Polytechnic University, and Tongji University, with the following recruitment criteria: (1) foot size of 37 yards (European standard); (2) no history of wearing high heels when underage; (3) no ankle-related illness or surgical history; (4) no relevant experimental site skin lesions or health-related problems; (5) body mass index (BMI) is within the normal range (approximately 18.5–23.9 kg/m2). Prior to the experiment, all participants had read and signed written informed consent. The research design was approved by the Ethics Committee of Huashan Hospital, Fudan University. According to previous study that high heels of different sizes had little effect on the human body, 18 moreover, as we looked into the basic situation survey of the experimental population in the early stage of the experiment, we found that the number of foot code 37 euro accounted for a larger proportion. In order to reduce the experimental error and reduce the difference of variables, the shoes in this experiment were unified into 37 euro-code shoes. The participants were examined while walking on a treadmill at a fixed speed (1 m/s) under seven experimental conditions: (A1) thick HHSs with 3 cm heels, (A2) thick HHSs with 6 cm heels, (A3) thick HHSs with 8.2 cm heels, (B1) thin HHSs with 3 cm heels, (B2) thin HHSs with 6 cm heels, (B3) thin HHSs with 8.2 cm heels, and (C) flat shoes in a random order, and every participant completed the test in the same day (Figure 1). All the shoes were made at Shanghai Second Leather Shoe Factory with the same type of material.
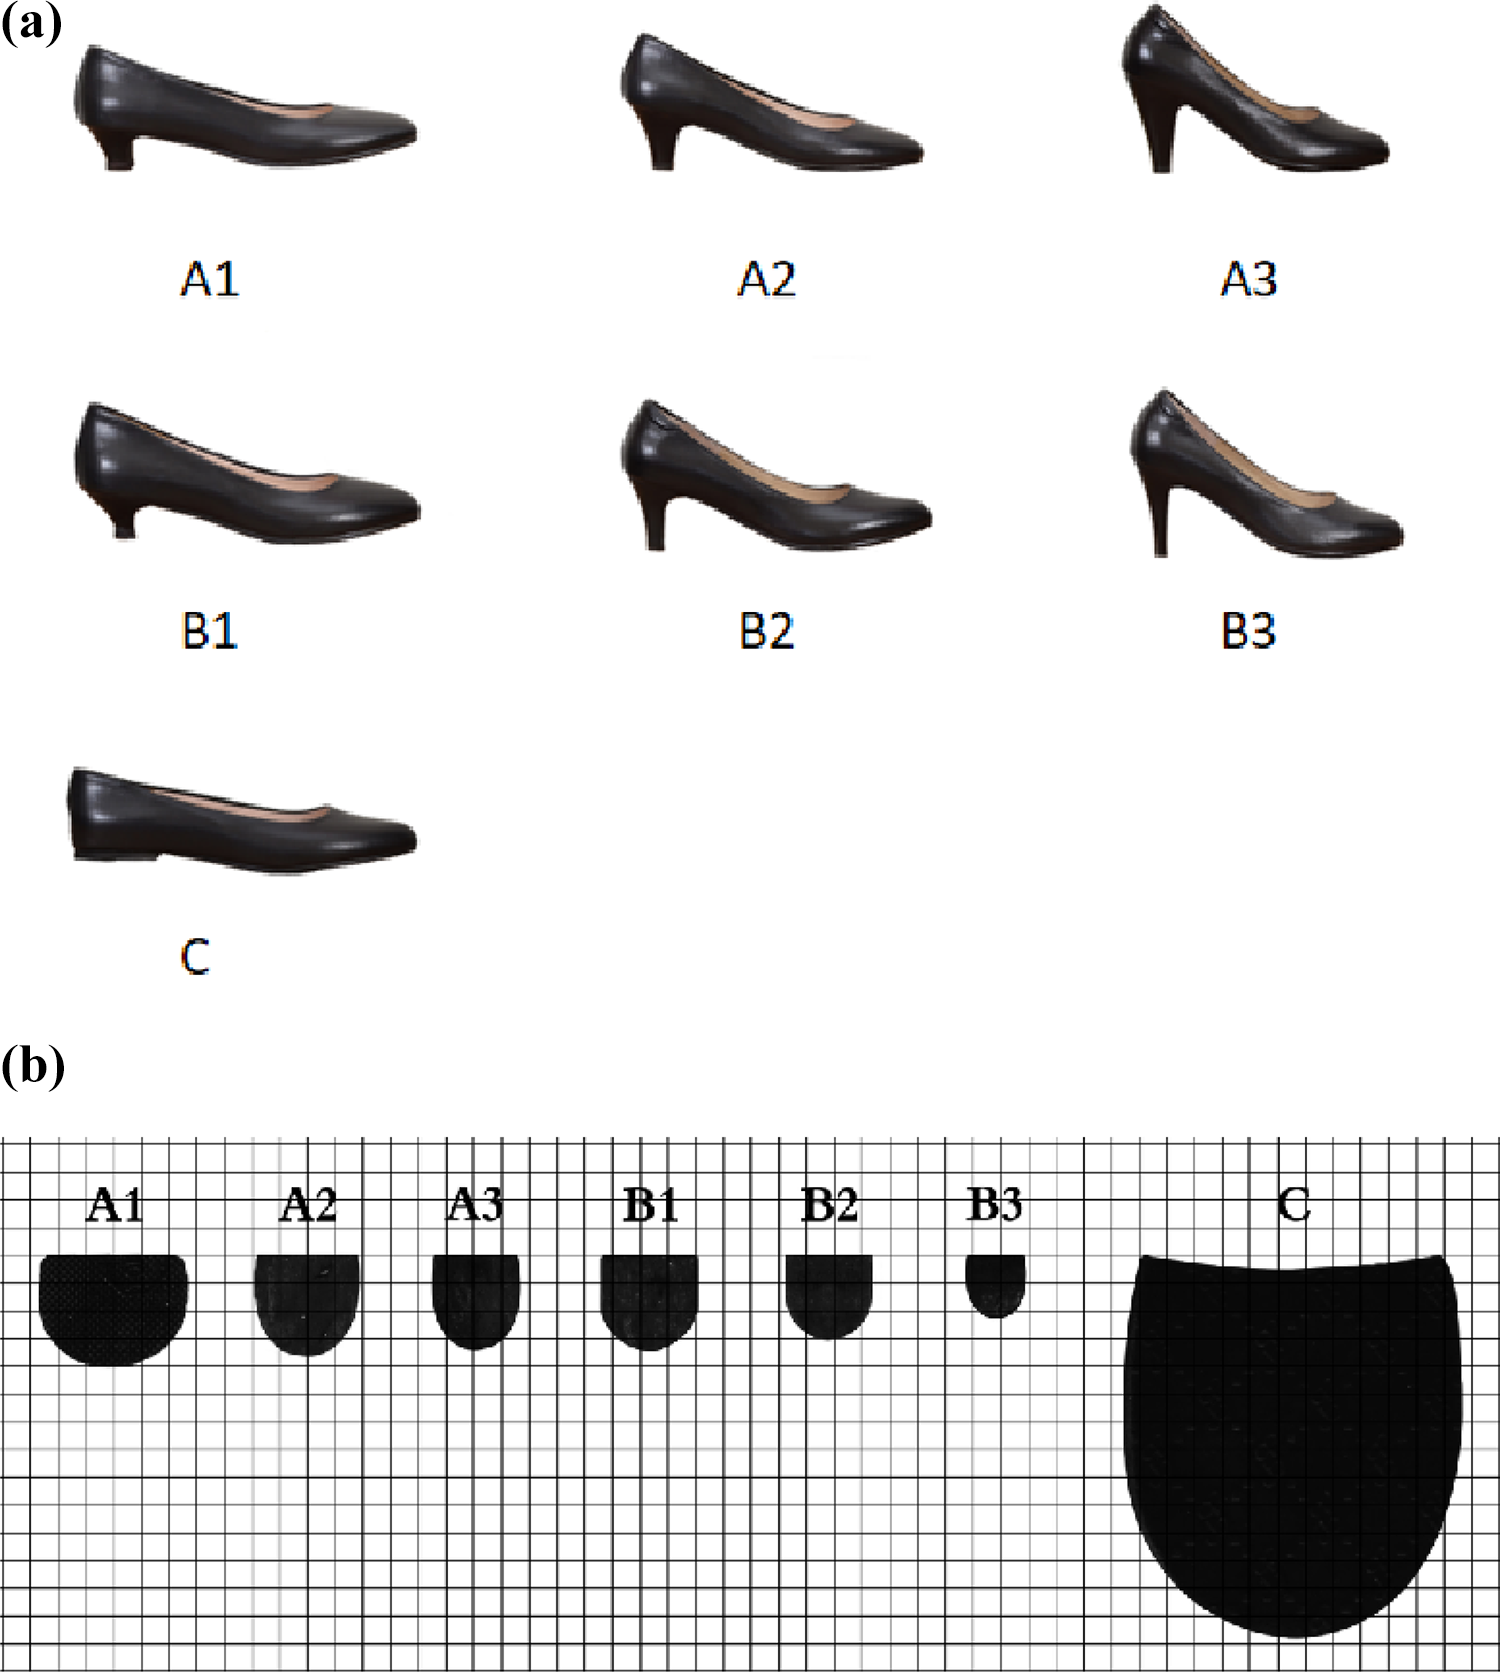
(a) Experimental conditions: (A1) thick HHSs with 3 cm heels, (A2) thick HHSs with 6 cm heels, (A3) thick HHSs with 8.2 cm heels, (B1) thin HHSs with 3 cm heels, (B2) thin HHSs with 6 cm heels, (B3) thin HHSs with 8.2 cm heels, and (C) flat shoes. (b) Heel base sizes, size of grid paper is 0.5 × 0.5 cm2. HHS: high-heeled shoe.
The ZEBRIS® gait analysis system and the Noraxon myoPRESSURE module were operated with the treadmill system (Noraxon USA, Inc., Scottsdale, Arizona, USA) at a frequency of 100 Hz. The treadmill speed was set to 1 m/s. We first asked the participants try on high heels walking on the floor, this step lasted for 5 min, and then on the treadmill for normal straight walking exercises while treadmill speed gradually increased to the experimental speed, this step lasted for 2 min. Finally, when the subject could form a continuous natural walking step at the experimental speed on the treadmill, started experimentation with the right foot as the first step and started the software at the same time. Each session lasted approximately 10 s and every participant gradually walked along a track twice with each pair of shoes. MyoPRESSURE presented a comprehensive analysis of the standard gait parameters and the COP. Associated average curves were generated. Plantar pressure measures were concurrently recorded using the Tekscan® F-Scan® system (Tekscan, Inc., South Boston, Massachusetts, USA). This system comprised a wireless transmitter and two sensors. These sensors were approximately 0.15 mm thick and contained 960 sensing elements distributed in four sensors/areas. A sampling rate of 500 Hz was utilized for all the trials. All the data were collected and processed using the Tekscan® research software (version 7). The plantar surface was divided into eight anatomical regions, including great toe (T1), lesser toes (T2–5), first metatarsal (M1), central forefoot (M23), lateral forefoot (M45), midfoot (MF), medial heel (MH), and lateral heel (LH) (Figure 2).

Plantar division. The plantar surface was divided into eight anatomical regions, including great toe (T1), lesser toes (T2–5), first metatarsal (M1), central forefoot (M23), lateral forefoot (M45), midfoot (MF), medial heel (MH), and lateral heel (LH).
All analyses were performed for the right foot (dominant side). 19 To analyze the effects of heel height and heel type on gait parameters, a heel height × heel type mixed analysis of variance (ANOVA) test was used with heel height (four levels: control group, low (3 cm), medium (6 cm), and high (8.2 cm)) as the within-group factor and heel type (three levels: control group, thin, and thick) as the between-group factor. When the tests were significant, the least significant difference criterion was adopted for post hoc comparisons. For each statistical test, the significance was set to 0.05. Statistical analyses were performed using built-in functions of SPSS 21 (IBM, Armonk, New York, USA).
Results
The survey participants included 20 female adult volunteers (age: 20.89 ± 3.04 years, height: 161.0 ± 0.05 cm, weight: 53.80 ± 5.75 kg, and BMI: 20.73 ± 2.05 kg/m2). Most of them wore high heels one to four times a week in recent years. The height and BMI were normally distributed tested by Kolmogorov–Smirnov.
Gait phase parameters
The results of all gait phase parameters for two heel types (thin and thick), three different conditions (low: 3 cm, medium: 6 cm, and high: 8.2 cm), and a pair of flat shoes as the control group are listed in Figure 3. The stance phase was separated into three subphases: loading response, midstance, and pre-swing (PS).

Percentage of support phase, pre-swing, swing phase, and double support phase time when walking on treadmill in fixed speed walking (n = 20, p = 0.05).
The heel height × heel type mixed ANOVA test showed that the interaction factor and the main effect (heel height) were not statistically different for the selected conditions, while heel type only showed significant differences in the PS parameter. The post hoc results showed significant differences between the control group and the thin-heeled group, and also between the thick-heeled group and the thin-heeled group.
COP parameters
The results for COP parameters, including gait line length, medial–lateral position, anterior–posterior position, and single support line for two heel types (thin and thick), three different conditions (low: 3 cm, medium: 6 cm, and high: 8.2 cm), and a pair of flat shoes as the control group, are reported in Figure 4.

COP parameters when walking on treadmill in fixed speed walking (n = 20, p = 0.05). COP: center of pressure.
The heel height × heel type mixed ANOVA test showed that neither the interaction factor nor heel height and heel type were statistically different for the medial–lateral position.
Conversely, the main effect (heel height) and the interaction factor showed significant differences for the following parameters: gait line length, single support line, and anterior–posterior position. Regarding COP parameters, the post hoc analysis revealed significant differences in gait line length and the single support line. However, the results for the anterior–posterior position yielded statistically significant differences between the control and high-heeled groups, low-heeled and medium-heeled groups, low-heeled and high-heeled groups, and medium-heeled and high-heeled groups.
Plantar pressure parameters
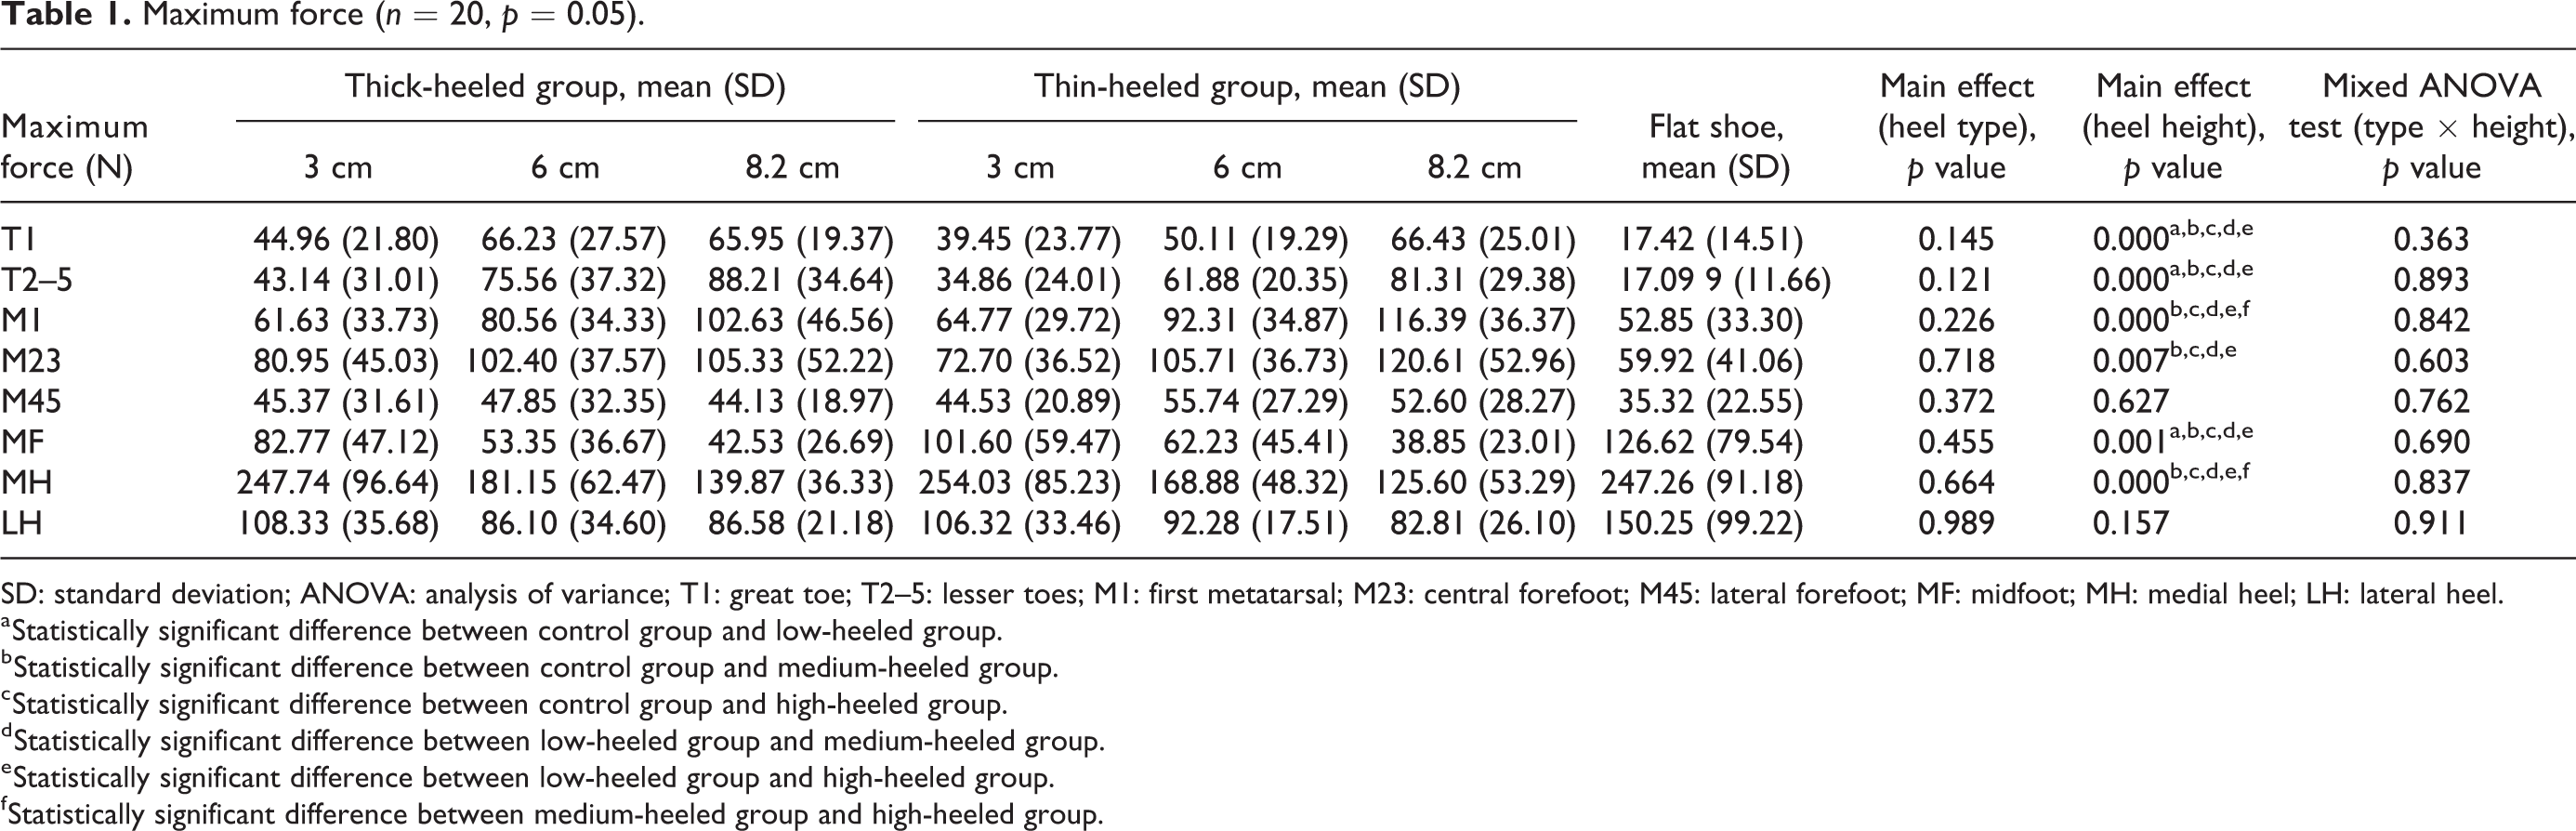
The heel height changed the maximum force over the entire foot region (Table 1). The heel height increased the maximum force on T1, T2–5, M1, and M23, whereas a smaller force acted on the MF and MH regions. As shown in Table 2, the force–time integral exhibited patterns similar to those of the maximum force, that is, lower force–time integral values in the MH region and higher in the T1, T2–5, M1, and M23 regions.
Maximum force (n = 20, p = 0.05).
SD: standard deviation; ANOVA: analysis of variance; T1: great toe; T2–5: lesser toes; M1: first metatarsal; M23: central forefoot; M45: lateral forefoot; MF: midfoot; MH: medial heel; LH: lateral heel.
a Statistically significant difference between control group and low-heeled group.
b Statistically significant difference between control group and medium-heeled group.
c Statistically significant difference between control group and high-heeled group.
d Statistically significant difference between low-heeled group and medium-heeled group.
e Statistically significant difference between low-heeled group and high-heeled group.
f Statistically significant difference between medium-heeled group and high-heeled group.
Force–time integral (n = 20, p = 0.05).

SD: standard deviation; ANOVA: analysis of variance; T1: great toe; T2–5: lesser toes; M1: first metatarsal; M23: central forefoot; M45: lateral forefoot; MF: midfoot; MH: medial heel; LH: lateral heel.
a Statistically significant difference between control group and low-heeled group.
b Statistically significant difference between control group and medium-heeled group.
c Statistically significant difference between control group and high-heeled group.
d Statistically significant difference between low-heeled group and medium-heeled group.
e Statistically significant difference between low-heeled group and high-heeled group.
f Statistically significant difference between medium-heeled group and high-heeled group.
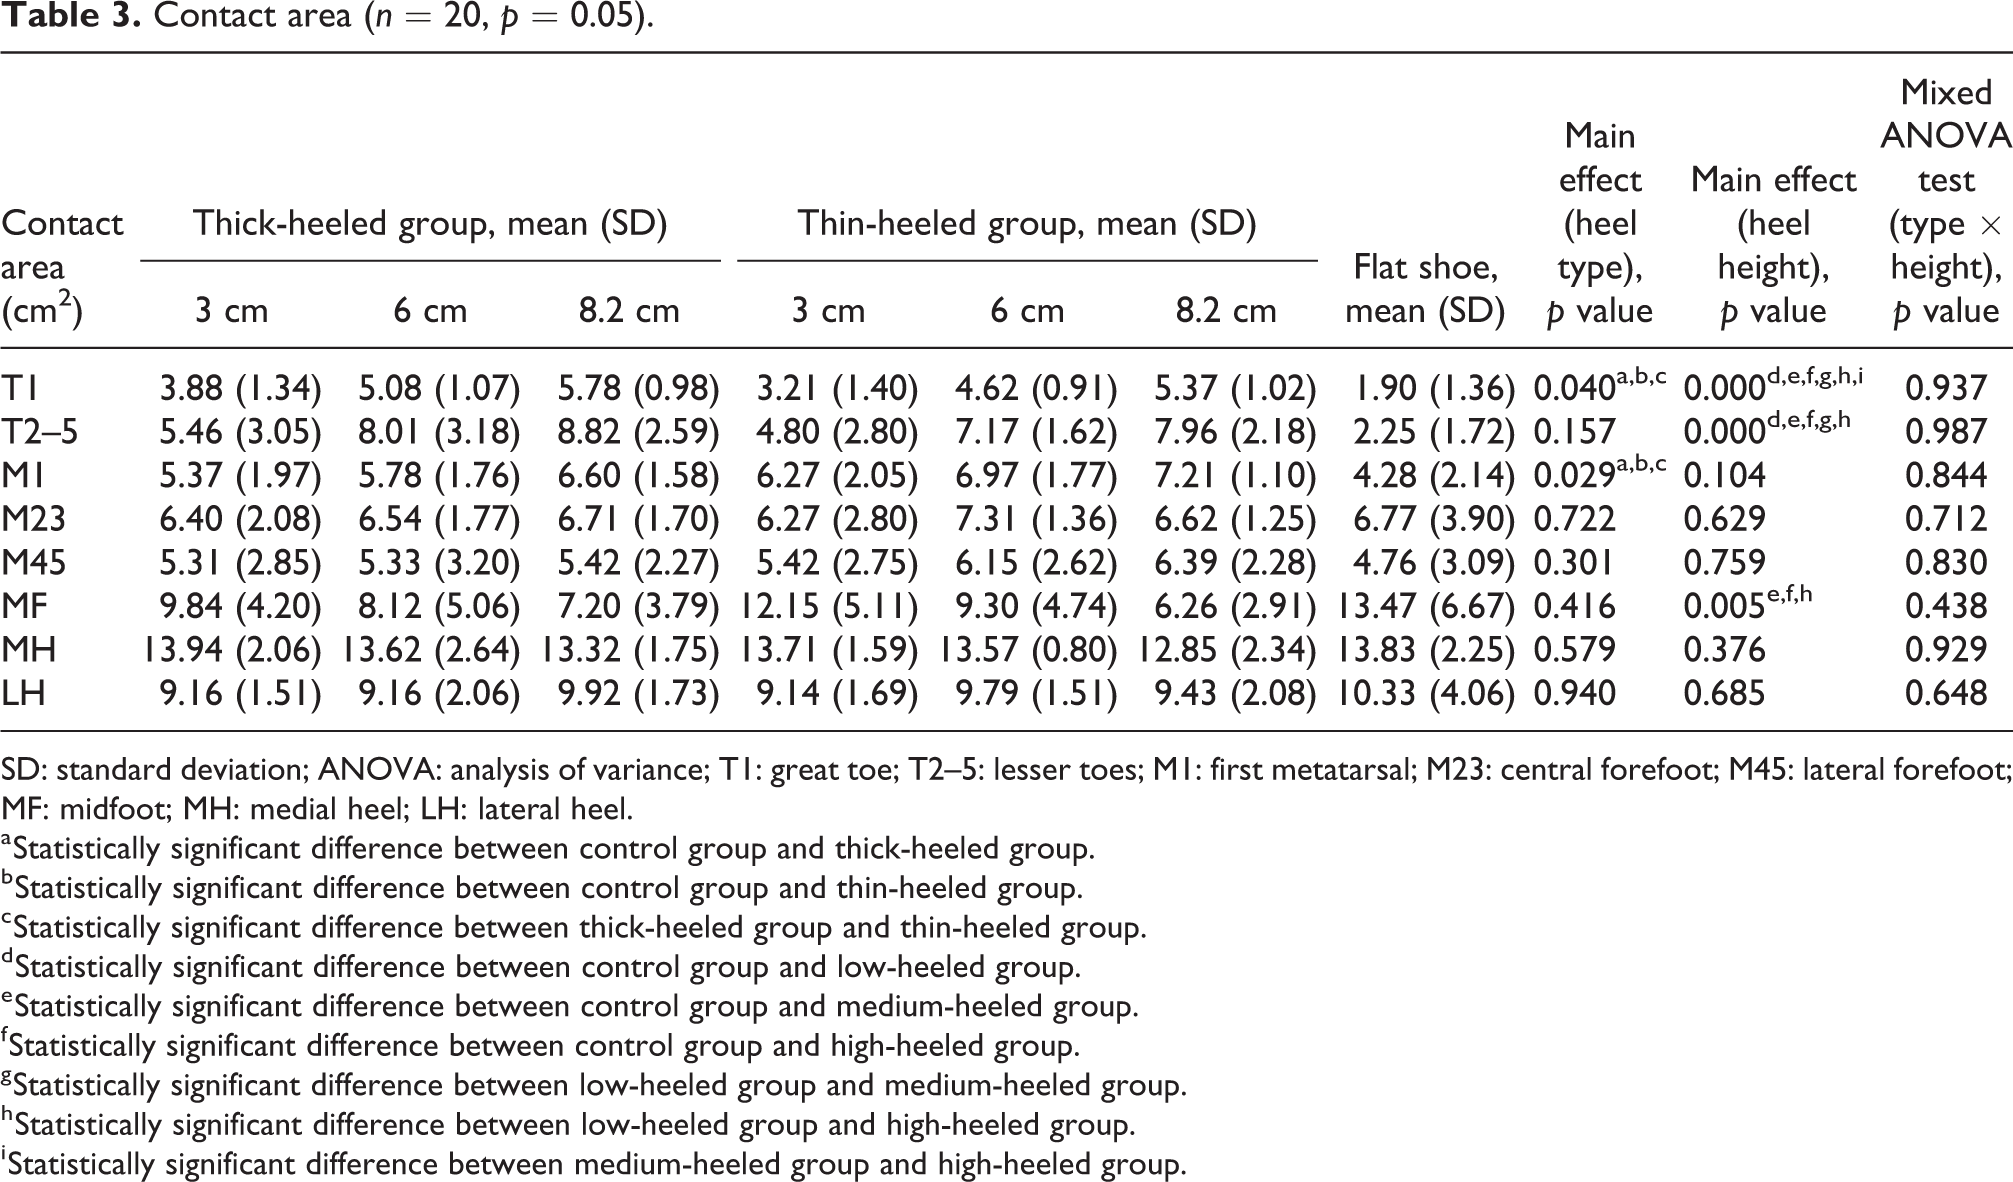
As shown in Table 3, the contact area (CA) was larger in T1 and T2–5 with increased heel height. Moreover, the main effect of heel type yielded significant differences in the T1 and M1 regions, while the post hoc analysis results showed significant differences between the control and thin-heeled groups, control and thick-heeled groups, and thick-heeled and thin-heeled groups. Furthermore, the CA for T1 was larger in the thick-heeled group, while less CA was observed for M1 in the thin-heeled group.
Contact area (n = 20, p = 0.05).
SD: standard deviation; ANOVA: analysis of variance; T1: great toe; T2–5: lesser toes; M1: first metatarsal; M23: central forefoot; M45: lateral forefoot; MF: midfoot; MH: medial heel; LH: lateral heel.
a Statistically significant difference between control group and thick-heeled group.
b Statistically significant difference between control group and thin-heeled group.
c Statistically significant difference between thick-heeled group and thin-heeled group.
d Statistically significant difference between control group and low-heeled group.
e Statistically significant difference between control group and medium-heeled group.
f Statistically significant difference between control group and high-heeled group.
g Statistically significant difference between low-heeled group and medium-heeled group.
h Statistically significant difference between low-heeled group and high-heeled group.
i Statistically significant difference between medium-heeled group and high-heeled group.
Table 4 shows the peak pressure (PP) results for eight anatomical regions. The PPs were larger in the T1, T2–5, M1, and M23 regions, and smaller in the MF, MH, and LH regions for high-heeled walking compared with walking in heels with lower height. The main effect of heel type yielded significant differences in the T1 and T2–5 regions; the post hoc analysis results showed significant differences between the control and thin-heeled groups, control and thick-heeled groups, and thick-heeled and thin-heeled groups. Additionally, the PP on both the T1 and the T2–5 regions were bigger for the thin-heeled group than for the thick-heeled group.
Peak pressure (n = 20, p = 0.05).

SD: standard deviation; ANOVA: analysis of variance; T1: great toe; T2–5: lesser toes; M1: first metatarsal; M23: central forefoot; M45: lateral forefoot; MF: midfoot; MH: medial heel; LH: lateral heel.
a Statistically significant difference between control group and thick-heeled group.
b Statistically significant difference between control group and thin-heeled group.
c Statistically significant difference between thick-heeled group and thin-heeled group.
d Statistically significant difference between control group and low-heeled group.
e Statistically significant difference between control group and medium-heeled group.
f Statistically significant difference between control group and high-heeled group.
g Statistically significant difference between low-heeled group and medium-heeled group.
h Statistically significant difference between low-heeled group and high-heeled group.
i Statistically significant difference between medium-heeled group and high-heeled group.
Discussion
In this study, the effects of the heel type and heel height of HHSs on gait cycle measurement, COP parameters, and plantar pressure were investigated. Heel type and heel height significantly influenced the trajectories of the COP and plantar pressure, and thus changed walking stability during gait analysis on a treadmill.
According to previous studies, the comfortable speed for high heels ranged from 122 cm/s to 140 cm/s when heel height ranged from 1 cm to 6 cm. 3,20 In this experiment, a maximum height of 8.2 cm was considered. Moreover, higher heel heights contributed to slower self-selected walking speeds. 21 Finally, the speed of 100 cm/s was used.
Previous kinematic studies reported that walking in HHSs led to a variation in lower-extremity joint kinetics, which began in the early stance phase. 3,18 In agreement with these results, the results of our study suggested that PS time increased as a function of heel height, although no statistical difference was observed. However, for heel type, the PS time for the thin-heeled group increased compared with both the control and the thick-heeled group. This may indicate that thin-heeled shoes contribute to muscular fatigue. 22
Regarding the COP parameters, both gait line length and the single support line decreased as heel height increased, regardless of the heel type. However, a large increase in the anterior–posterior position was evident when the heel height increased. The novel finding of this study is that the range of COP deviations in the anterior–posterior directions significantly increased for higher heels, while the anterior–posterior positions of the COP were parallel to the direction of progression. There were no statistical differences in the medial–lateral directions partly owing to the lower speeds. 9 This is because the medial–lateral positions of the COP were described relative to the line of progression that bisected the line of motion of the COM during the gait cycle. The COP deviations in the anterior–posterior directions were correlated with the results from another study that indicated that, for HHSs, anterior–medial force shifts occurred within the foot, increasing forefoot forces and enhancing force concentration. 21
In this study, the primary kinetic differences with respect to the normalized distribution of plantar pressure at different heel height and heel type conditions were observed for eight anatomical regions. In general, the maximum force, impulse, PP, and CA in the forefoot increased when heel height increased, while the same indices decreased for the MF and the heel when greater heel heights were used. Moreover, for both T1 and T2–5, the order of PP was: control group < thick-heeled group < thin-heeled group. For T1, the CA order for the heel region was: control group < thin-heeled group < thick-heeled group. For M1, the CA order for the heel region was: control group < thick-heeled group < thin-heeled group. These results are consistent with those reported in previous studies. 23 More importantly, for all heel regions in the flat shoe and the 3 cm heel height case, the plantar pressures were similar. This implied that there was a threshold for the flat-heel-height difference. Both impact force and loading rate decreased when the heel height ranged from 7.6 cm to 8.5 cm. This outcome was similar to that observed in our experiment. This was attributed to the prevention strategy employed for high heel heights. 24
In our previous study on the impact of HHSs on the ankle complex during walking in young women, it was shown that HHSs mainly affected the rotational motion of the ankle complex during walking. The spatial position of the talocrural joint was abnormal, and the subtalar joint’s range of motion decreased during high-heeled gait. 25 Moreover, the plantar flexions of the ankle joints increased as heel height increased, contributing to the increased pressure on the forefoot. These changes in force distribution have been linked to forefoot deformities, such in the hallux valgus, metatarsalgia, and callus formation, 21,26 Also an anterior shift of the COP caused greater plantar pressure on forefoot and less plantar pressure on MF and heel, thus a smaller CA over the MF and rearfoot. A smaller CA provides less foot support, affecting walking stability. 27 Future research will investigate walking at different velocities and the use of finite element analysis to quantify internal pressures.
Conclusions
Data analyses showed significant differences in the plantar pressure distribution associated with heel height and heel type at increased pressure in the first metatarsal and central forefoot region and decreased pressure in the MF and heel sections, thus increasing anterior shift. The results presented herein may allow for the design of HHSs with reduced adverse health effects on the wearer.
Footnotes
Declaration of conflicting interests
The author(s) declared no potential conflicts of interest with respect to the research, authorship, and/or publication of this article.
Funding
The author(s) disclosed receipt of the following financial support for the research, authorship, and/or publication of this article: This project was supported by the National Natural Science Foundation of China (grant nos 81171670 and 81472037) and Shanghai Excellent Academic Leaders Program (grant no 17XD1401000).