
Abstract
Purpose:
In total knee arthroplasty (TKA), various landmarks are generally used to ensure correct osteotomy. In this study, we examined whether the tibialis anterior tendon (TAT) or the extensor hallucis longus tendon (EHLT) could be used as a landmark of the center of the ankle joint in patients with knee osteoarthrosis (OA), using magnetic resonance imaging (MRI).
Methods:
The subjects were 61 patients with OA in 79 knees (males: 8 with 9 knees and females: 53 with 70 knees). With the ankle joint secured in the intermediate position, MRI from the knee joint to the ankle joint was performed in the same foot position. We prepared individual lines connecting the center of the ankle joint with the TAT or EHLT to measure the angle difference (ΔA) from Akagi’s line in the knee joint. We analyzed whether the ΔA might be affected by deformity of the knee joint or foot region, and tibial torsion.
Results:
At the ankle joint level, the ΔA of EHLT was the smallest, with an average of 1.6 ± 3.4°. The ΔA for the femorotibial angle, hallux valgus angle, and varus–valgus angle showed no correlations with deformity of the knee joint and foot region, or tibial torsion.
Conclusions:
MRI findings showed that EHLT would be useful as a landmark of the ankle joint center in extramedullary tibial osteotomy in TKA for medial knee OA. It was also clarified that the landmark would not be affected by severe deformity of the knee joint, deformity of the foot region, or external torsion of the tibia.
Keywords
Introduction
To obtain a favorable long-term outcome after total knee arthroplasty (TKA), correct alignment of the component is important. When the alignment of the component is poor, aseptic loosening, polyethylene wear, joint instability, and patella dislocation, may lead to the need for revision surgery. 1 –3 For coronal plane alignment, it is recommended to set the components within 3° for the mechanical axis of the lower extremity, 3 –5 and accurate osteotomy is required as a surgical technique. To improve the accuracy, various devices and landmarks have been used. 6 –14 In recent years, the accuracy has been further improved by computer-assisted surgery. However, this type of surgery has problems related to bone fracture, extended surgical time, and costs, and thus it will require time for the surgery to be used commonly. In this study, we successfully found a new landmark to correctly and simply identify the center of the ankle joint without the use of a special device, among the landmarks to be used for tibial osteotomy.
For tibial osteotomy, the extramedullary method has been used for many cases. In the extramedullary method, osteotomy is performed for the proximal tibia after alignment guides, with various landmarks in the surgical field or on the body surface as landmarks. Recently, the axis connecting the proximal 1/3 with the distal 1/3 of the tibial ridge 6 has been considered to be a good standard because of its high reproducibility as a mechanical axis. However, incorrect data may be obtained when the tibia has a deformity. 15 In addition, a method in which the axis connecting the center of the proximal tibia with the center of the ankle joint has also been used as the standard. In this method, it is easy to identify the center during surgery because the medial border of the patella tendon is visible, although it is difficult to visually confirm or touch the center of the ankle joint. On the other hand, since the tibia shows physiological external torsion, the front of the ankle joint exhibits further external rotation, compared with the front of the proximal tibia. Therefore, the location of the ankle joint center, to which the proximal tibia is set on the front, is different from that, to which the ankle joint is set on the front. Thus, a point located slightly medial to the bimalleolar center of the ankle joint, 7,8 or the second metatarsal bone 9 is used as a landmark of the ankle joint center. However, since the level of torsion varies between individuals and many patients with deformity of the knee develop concomitant deformity of the foot region, the mechanical axis may not be reproduced correctly when the above-mentioned landmarks are used as the standard. It has been reported that the tibialis anterior tendon (TAT), extensor hallucis longus tendon (EHLT), and Achilles tendon, which are easily palpable as they run close to the body surface around the ankle joint, would be useful as a new landmark of the ankle joint center. 10 –13 However, in these reports, the evaluation was performed only for the situation, in which the ankle joint was viewed squarely, with no relation to the knee joint. Thus, an actual foot position in TKA (the front of the ankle joint when the proximal tibia was set at the front) was not simulated as part of the evaluation. Therefore, the possibility exists that the actual positional relationship between the ankle joint center and the tendon during a surgery might not be analyzed correctly.
Materials and methods
Subjects
The subjects were 61 osteoarthrosis (OA) patients with 79 knees (males: 8 with 9 knees and females: 53 with 70 knees) who underwent initial TKA from September 2016 to May 2017 in our hospital. The inclusion criteria included OA with a femorotibial angle (FTA) ≥175°. The exclusion criteria included valgus OA, idiopathic osteonecrosis of the femoral medial condyle, and inflammatory diseases, such as rheumatoid arthritis, secondary OA, and history of fracture of the lower extremity and foot. The average age, height, weight, and body mass index were 75.1 ± 6.3 years, 150.2 ± 8.3 cm, 57.8 ± 10.3 kg, and 25.5 ± 3.3 kg/m2, respectively. The average preoperative FTA was 185.0 ± 5.7°; the varus–valgus angle (VVA), an index of hindfoot deformity, was 80.4 ± 4.5°; and the hallux valgus angle (HVA), an index of forefoot deformity, was 17.0 ± 10.1°.
MRI examination
One month before the TKA, magnetic resonance imaging (MRI) of the knee joint and foot region was performed using a 1.5-T MRI (Brivo MR355 Inspire 1.5 T, GE Healthcare, Chicago, Illinois, USA) and whole-body coil, with the following imaging conditions: proton density-weighted image method, fast spin-echo, and multi-echo time (TE); repetition time, 1800 ms; TE, 12.5 (ms); scan time, 5 min 24 s; phase encoding direction, anterior-to-posterior; bandwidth, 35.7 Hz (1.48 pixels); field of view, 161 × 230 (mm); slice thickness, 5.0 mm; and a 224 × 320 matrix. For MRI, the ankle joint was secured in the intermediate position using a wooden device to obtain images of the knee joint to the ankle joint in the same foot position (Figure 1). The axial image was obtained so that the axis was vertical to the axis of the tibia.

The ankle joint was secured at the intermediate position using a wooden device, to obtain MRI images. MRI: magnetic resonance imaging.
Image analysis
The anteroposterior axis of the tibia was defined as a line perpendicular to the transepicondylar axis passing through the middle of the posterior cruciate ligament (PCL). Akagi’s line was the line connecting the tibial insertion in the PCL projected at the ascensus of insertion of the patella tendon with the medial margin of the patella tendon. Akagi’s line has an error of 0.0° ± 2.8° compared with the anteroposterior axis and is a useful index for determining the rotation axis of the proximal tibia. 16 Since its usefulness has also been reported for osteoarthritic knee, we used Akagi’s line as a reference of tibial rotation. 17 We identified Akagi’s line with slices of the proximal tibia. Next, in the ankle joint, we determined the diagonal intersection point of two lines connecting the anterior and contralateral posterior edges of the talus as the center of the ankle joint 6,18 (Figure 2). We identified the TAT and EHLT running on the anterior part of the ankle joint at the ankle joint level. We prepared individual lines connecting the center of the ankle joint to the ① TAT medial margin (TAT-med), ② TAT center (TAT-cen), ③ TAT lateral margin (TAT-lat), and ④ EHLT center (EHLT) (Figure 3). Akagi’s line, drawn at the level of the patella tendon attachment at the distal side, was projected at the level of the ankle joint. The angle between line (①–④) and Akagi’s line was defined as ΔA, respectively. The external directions for Akagi’s line were determined as +. In the three slices at the ascensus 5-mm proximal from the talocrural joint (line-a), talocrural joint (line-b), and 5-mm distal from the talocrural joint (line-c), we measured angle difference (ΔA) of ①–④ (Figure 4). We analyzed the proportion for which the ΔA was 5° and 10° or less among all subjects. We measured the angle between the posterior tibial tangential line and the line connecting the medial malleolus and the lateral malleolus in the talocrural joint in the transected images of the proximal tibia as tibial torsion (Figure 5). 19 Image analysis was performed using OsiriX imaging software (OsiriX Foundation, Switzerland). All measurements were performed blindly and independently by two orthopedic surgeons specializing in knees, with 11 and 16 years of experience, respectively.
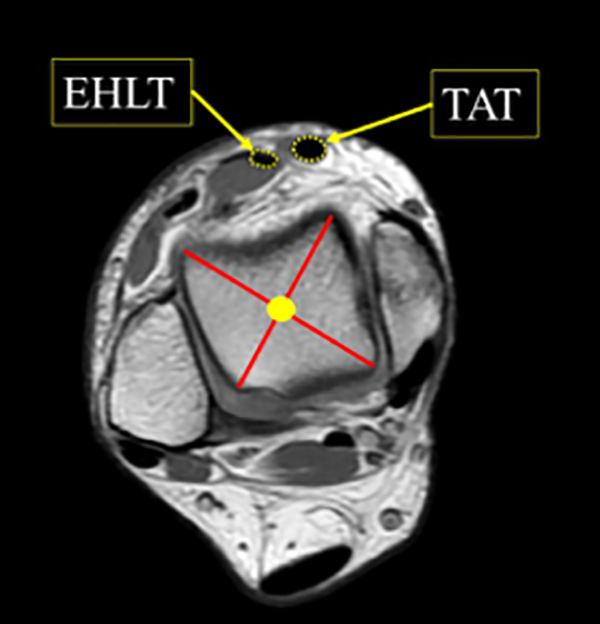
The center of the ankle joint was defined as the point of diagonal intersection of two lines connecting the anterior and contralateral posterior edges of the talus.
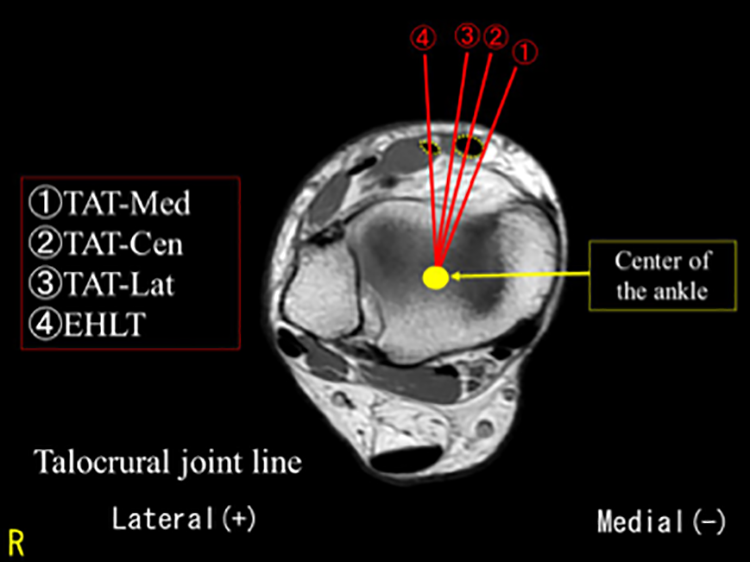
We prepared individual lines from the center of the ankle joint to the ① TAT medial margin (TAT-med), ② TAT center (TAT-cen), ③ TAT lateral margin (TAT-lat), and ④ EHLT center (EHLT). TAT: tibialis anterior tendon; EHLT: extensor hallucis longus tendon.

Akagi’s line, at the level of the patella tendon attachment at distal side, was projected at the level of the ankle joint. The angle between line (①–④)and Akagi’s line was defined as ΔA, respectively. In the three slices at the ascensus 5-mm proximal from the talocrural joint (line-a), talocrural joint (line-b), and 5-mm distal from the talocrural joint (line-c). ΔA: angle difference.

We measured the angle between the posttibial tangential line and the line connecting the medial malleolus and the lateral malleolus in the talocrural joint in the transected images of the proximal tibia as tibial torsion.
Radiographic examination
One month before TKA, we obtained frontal view images of both lower extremities, the feet, and the hindfoot in a standing position. 20 We measured the FTA, HVA, and VVA, as indexes of coronal deformity of the leg-long lower extremity, forefoot deformity, and hindfoot deformity, respectively. 21 We determined the FTA of 185°, HVA of 20°, and VVA of 76° as the cutoff values for individual deformities. We analyzed whether individual deformities correlated with the ΔA of the EHLT at the ascensus of the talocrural joint. This study was approved by the Institutional Review Board of our institution (Approval number: ERB-C-268). Informed written consent was obtained from all participants included in the study.
Statistical analysis
The results are expressed as the mean ± standard deviation and were compared by Mann–Whitney U tests. Intraclass correlation coefficients were calculated with a two-way random model. The interobserver reliability of the two orthopedists was 0.967 for the ΔA measurements. The intraobserver reliabilities of observers 1 and 2 were 0.995 and 0.931 for the ΔA measurements. All statistical analyses were performed using EZR (Saitama Medical Center, Jichi Medical University, Saitama, Japan), with p < 0.05 defined as being statistically significant.
Results
At the ankle joint level, the ΔA at the TAT-med was −19.5 ± 6.0°, and only 5.1% of the subjects exhibited ΔA values of 10° or less (Table 1). Furthermore, the ΔA at the TAT-cen was −13.9 ± 5.7°, and only 26.6% of the subjects exhibited ΔA values of 10° or less. The ΔA at the TAT-lat was −8.5 ± 5.5°, and 65.8% exhibited ΔA values of 10° or less. On the other hand, the ΔA of the EHLT at the ankle joint level was 1.6 ± 3.4°, showing the smallest error. The proportion of the subjects who exhibited ΔA values of 5° or less was 88.6%, and 100% exhibited ΔA values of 10° or less. In addition, the average ΔA of the EHLT at the ankle joint level was 1.6 ± 3.4° and 1.7 ± 3.6° for an FTA <185° and ≥185°, respectively (p = 0.758), compared with 1.4 ± 3.3° and 2.1 ± 3.8° for HVA <10° and ≥10°, respectively (p = 0.252), and 1.6 ± 3.0° and 1.7 ± 3.6° for VVA <76° and ≥76°, respectively (p = 0.853). There were no significant differences in the ΔA values between the small and large FTA, HVA, or VVA groups. In addition, the ΔA of the EHLT at the ankle joint level, FTA, HVA, and VVA did not correlate with the severity of deformity (Figures 6 to 8). The ΔA of the EHLT also showed no correlation with tibial torsion (Figure 9).
Data on the difference from ΔA on the axial plane.

ΔA: angle difference; TAT: tibialis anterior tendon; EHL: extensor hallucis longus.

ΔA of EHL showed no correlation with FTA. ΔA: angle difference; EHL: extensor hallucis longus; FTA: femorotibial angle.
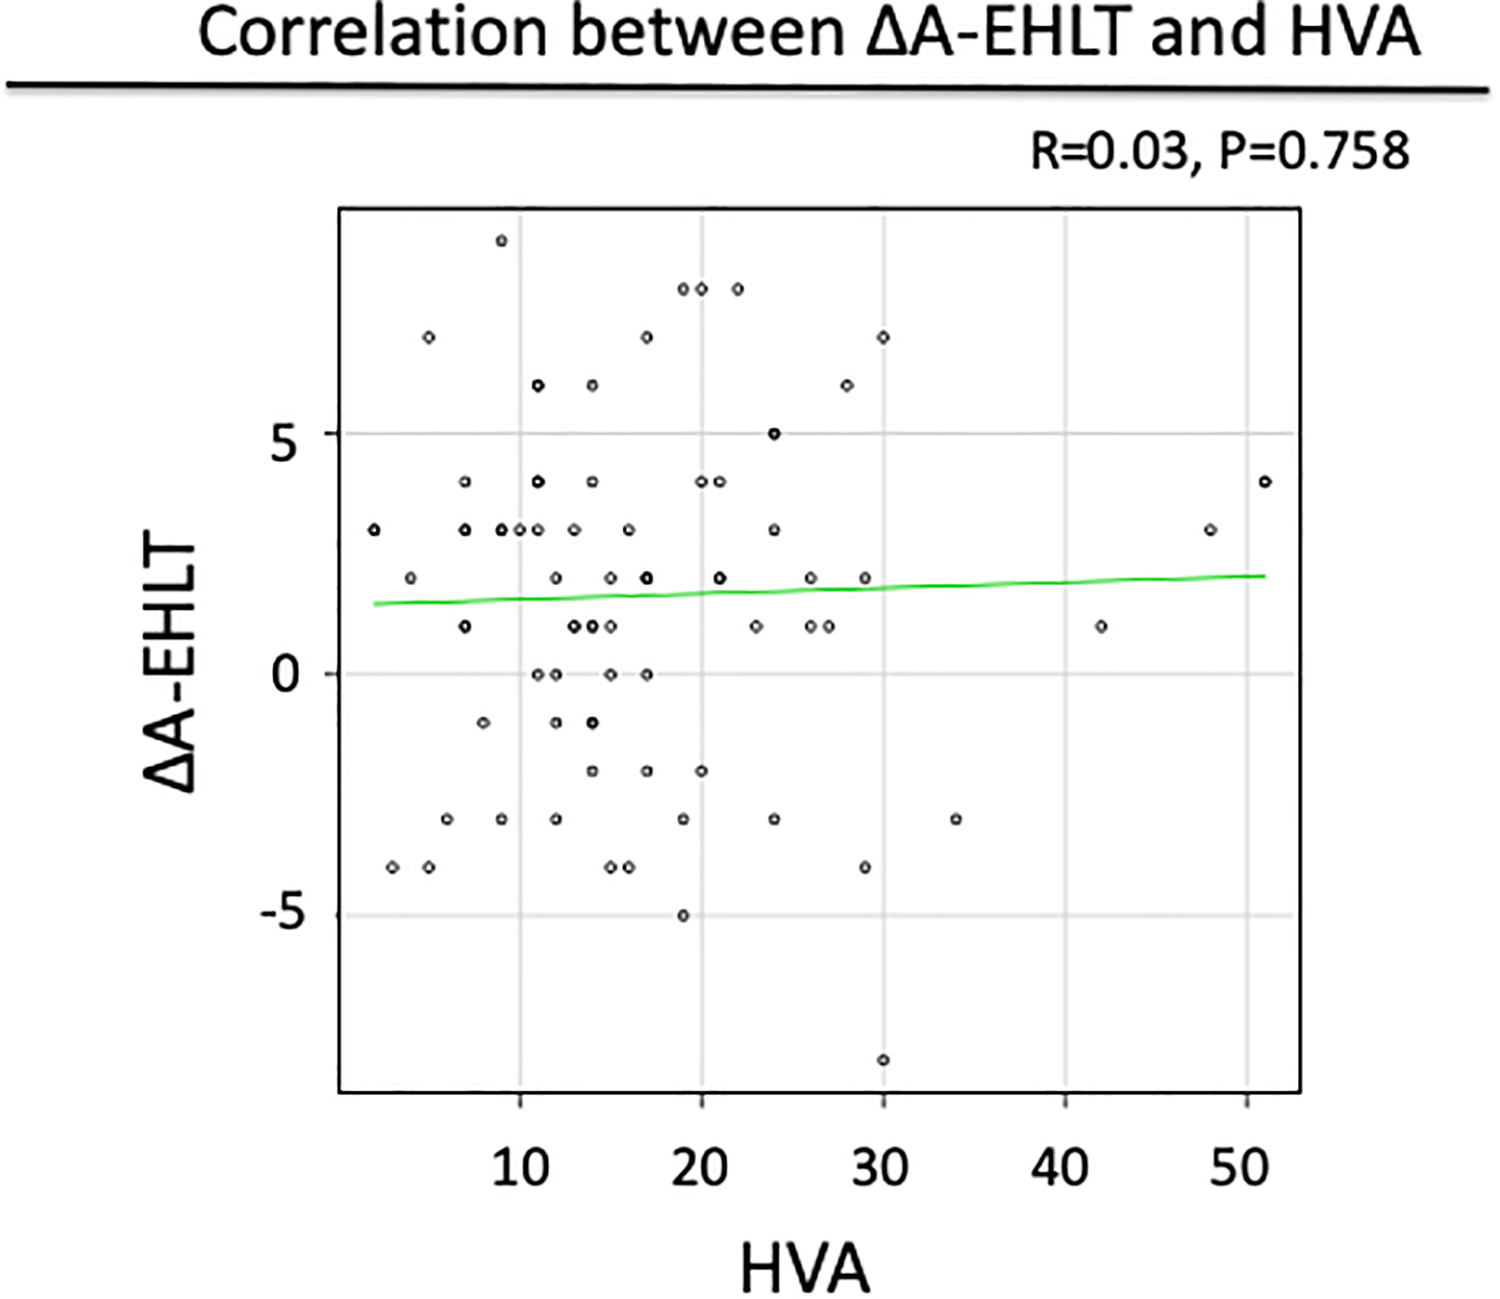
ΔA of EHL showed no correlation with HVA. ΔA: angle difference; EHL: extensor hallucis longus; HVA: hallux valgus angle.
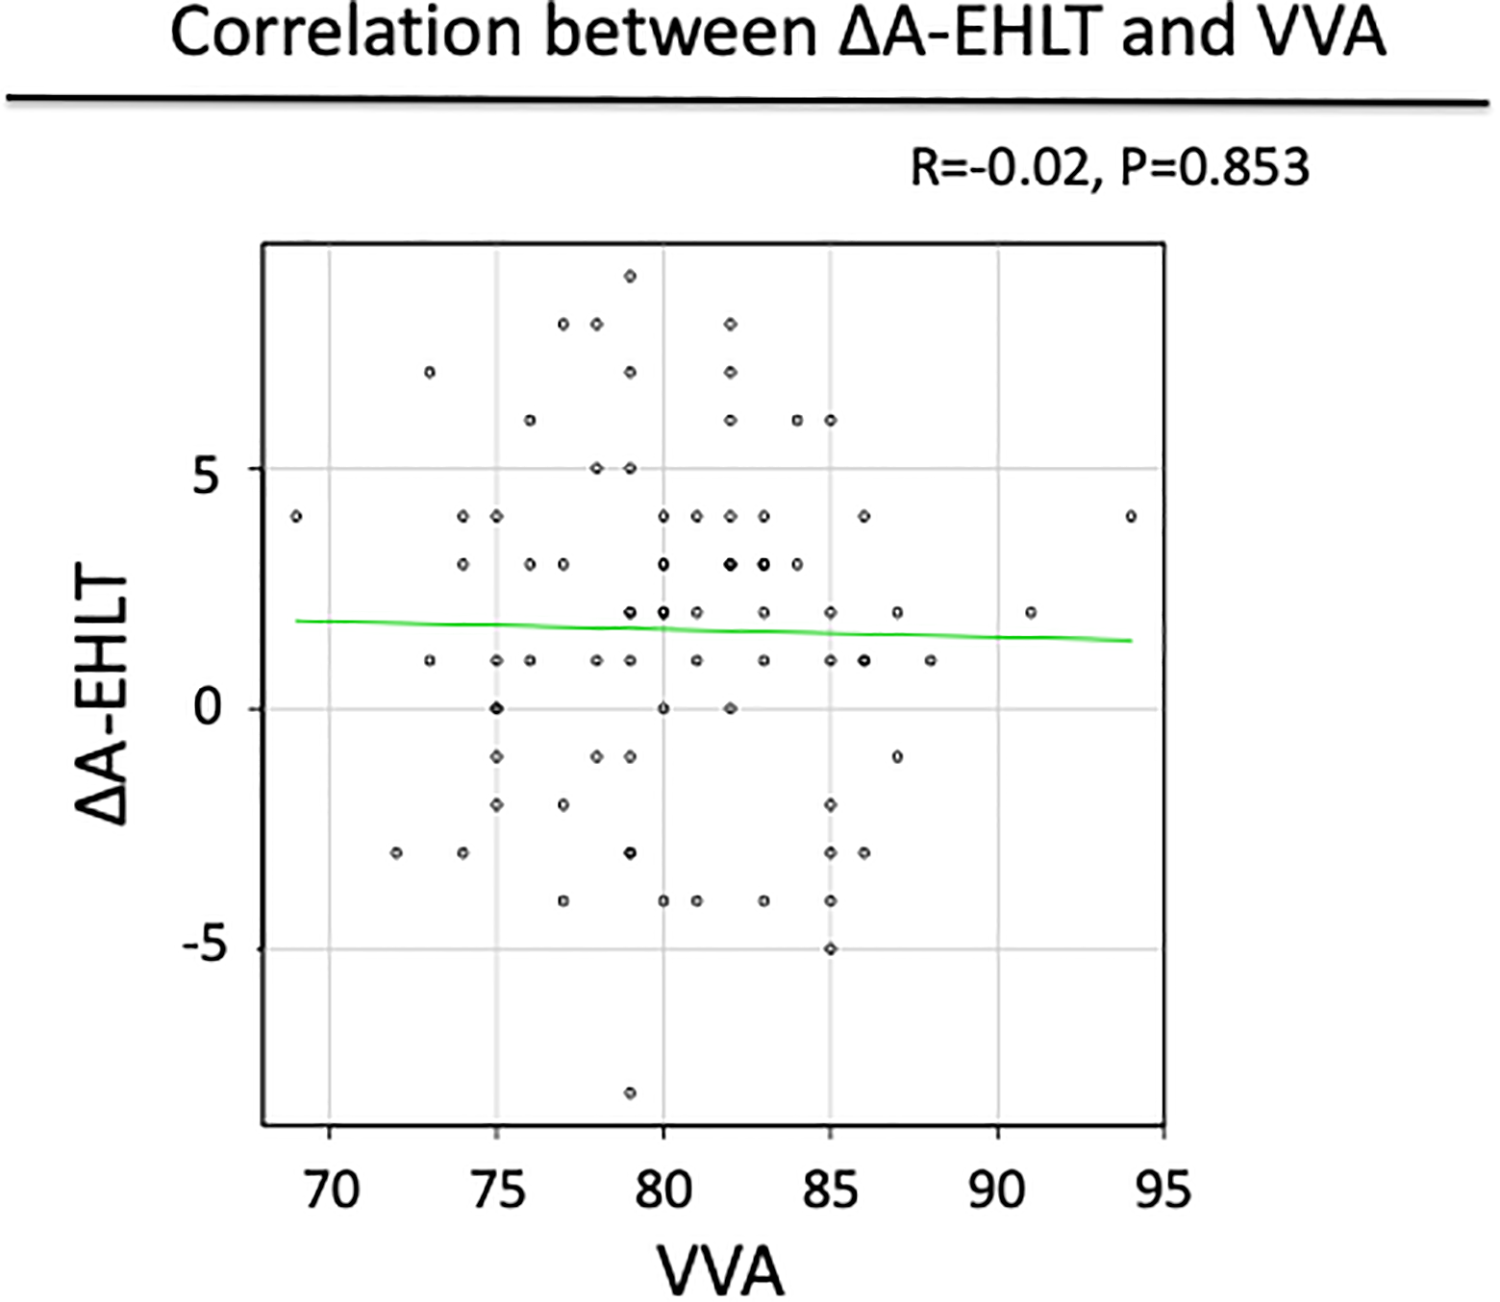
ΔA of EHL showed no correlation with VVA. ΔA: angle difference; EHL: extensor hallucis longus; VVA: varus–valgus angle.

ΔA of EHL showed no correlation with tibial torsion. ΔA: angle difference; EHL: extensor hallucis longus.
Discussion
In this study, we tested the hypothesis that the tendon to be used as a correct landmark in tibial osteotomy in TKA might be clarified by examining the positional relationship between the tendon and the ankle joint center at the level of the ankle joint, with the front of the proximal tibia used as the standard. Based on these background data, this study was performed to elucidate the positional relationship between the TAT/EHLT and the center of the ankle joint using MRI, for patients with knee OA who were scheduled to undergo TKA.
It is important to identify the center of the ankle joint when using extramedullary guides for tibial osteotomy in TKA. In this study, it was importantly clarified that in vivo EHLT in patients with knee OA who were scheduled to undergo TKA was closest to the center of the ankle joint when the proximal tibia was used as the front.
In extramedullary tibial osteotomy in TKA, the proximal and distal parts of the rod should be set at the medial border of the patella tendon and at the center of the ankle joint, respectively. On the other hand, the distal tibia exhibited external torsion of 3.6 − 19.7° against the proximal tibia, 22 and when the proximal tibia was set as the front, the frontal view of the ankle joint showed external rotation. If the distal tibia is set at the center when being viewed from the front of the ankle joint, the distal part of the rod is located outward, resulting in a large gap between the rod and the mechanical axis. Therefore, when the rod is set to the mechanical axis in the extramedullary method, the center of the ankle joint should be used as the landmark when the proximal tibia is set at the front. Although the position slightly medial from the center of the bimalleolar ankle joint or the second metatarsal has been used as the bony landmark, the level of external torsion of the tibia varies between individuals, and thus the reproducibility has been a problem. On the other hand, around the ankle joint, various tendons, such as the TAT, the EHLT, and the Achilles tendon, run close to the body surface. The EHLT lies anterior to the ankle joint and is located outside of TAT, and the average diameter of the TAT and EHLT is 6.9 mm and 5 mm, respectively, which are both sufficiently large for confirmation. 11 It is easy to touch either tendon, and thus these tendons are attracting attention as new landmarks of tibial osteotomy in TKA and have been evaluated by various methods. In a study performed using cadavers, at the intermediate position of the ankle joint, the external margin of the EHLT of the right and left feet were located 2.5 ± 1.9 mm and 2.4 ± 1.6 mm medial from the center of the ankle joint, respectively. Thus, it was reported that the EHLT would be useful as a reference point to suggest the center of the ankle joint. 11 In addition, since the EHLT moves 0.1–0.95 mm from the intermediate position to the pronate position, and 2–5.3 mm to the supinated position, it was suggested that the EHLT would be affected by the foot position of the ankle joint. 11 Furthermore, in an MRI study of healthy knees, it was found that the EHLT was located 3.89 ± 2.45 mm medial from the center of the ankle joint and that the Achilles tendon was located 2.64 ± 1.62 mm lateral from the center of the ankle joint, suggesting that the Achilles tendon was closer to the center of the ankle joint. 12 In a study in which ultrasound was used for knee OA, it was clarified that the EHLT was located 0.7 ± 3.5 mm medial from the center of the ankle joint at the position of plantar flexion of the ankle joint, suggesting the close positioning of the EHLT to the center of the ankle joint. 13 However, the largest limitation of these studies was the fact that the path of the tendon was only evaluated in the situation in which the front of the ankle joint was viewed with no relation to the knee joint, and the intraoperative foot position (frontal view of the ankle joint when the proximal tibia was set at the front) in TKA was not simulated for evaluation. In addition, since the studies included those in which the ankle joint was not evaluated at the intermediate position and those with subjects without knee OA, it was not conclusive that the data of such studies could be used as reference for TKA in knee OA. Therefore, we evaluated the reproduced foot position during actual TKA for patients with knee OA who were scheduled to undergo TKA. To this end, we obtained successive MRI images from the proximal tibia to the ankle joint at the intermediate position of the ankle joint, to examine the positional relationship between the center of the ankle joint and the TAT/EHLT, with the frontal view of the proximal tibia used as the standard on Akagi’s line. It was found that the error between Akagi’s line in the proximal tibia, the center of the ankle joint, and EHLT was the smallest, 1.6 ± 3.4°, at the ankle joint level. Furthermore, since the incidence of error ≤5° was as high as 84.8% and 88.6% in the proximal and distal areas from the level of the ankle joint, respectively, it was concluded that EHLT would be useful as a landmark of the ankle joint center in TKA and that the center of the ankle joint could be identified correctly, even if the palpable point of the EHTL was to move in a proximal or distal direction.
In addition, since the EHLT can be clearly identified without the use of any special devices, we believed that the EHLT could easily be used as a landmark to suggest the location of the ankle joint center during surgery.
The EHLT begins from the front of the tibia and ends at the distal phalanx of the great toe. On the other hand, patients with knee OA may concomitantly develop deformity in various joints between the origin and arrest site of the EHLT. They may develop hallux valgus deformity and subtalar joint deformity 23 as well as deformity in the forefoot and hindfoot. 24 Therefore, such deformities may affect the path of the EHLT. When we examined whether the running of the EHLT at the ankle joint level might be affected by deformity of the lower extremity and foot, no significant difference was confirmed in the FTA, HVA, and VVA with ΔA of the EHLT, and it was clarified that deformity in the coronal plane of the lower extremities, forefoot, and hindfoot would not affect the ΔA of the EHLT. It was suggested that the EHLT could be used as a landmark of the center of the ankle joint even in patients with severe deformity of the knee joint and foot. In addition, since there was no significant correlation between the level of tibial external torsion and the ΔA of the EHLT, it was also found that the EHLT would be located at the front of the ankle joint even if the level of external torsion of the tibia varied between individuals. In clinical practice, more accurate alignment of the lower extremities will be obtained by using the EHLT together with various previously-reported landmarks.
There were some limitations in the study. Firstly, the subjects of this study had varus OA, and, thus, the usefulness of EHLT as an index for valgus OA remains unclear. Secondly, it is difficult to adapt our method to obese patient which cannot palpate the EHLT. Thirdly, the actual accuracy of the EHLT as a landmark in osteotomy should be confirmed in the future.
Conclusions
It was clarified that the EHLT would be useful as a landmark of the ankle joint center in extramedullary tibial osteotomy in TKA for varus knee OA. In addition, it was also found that this landmark would not be affected by severe deformity of the knee joint, foot deformity, or external torsion of the tibia.
Footnotes
Declaration of conflicting interests
The author(s) declared no potential conflicts of interest with respect to the research, authorship, and/or publication of this article.
Funding
The author(s) received no financial support for the research, authorship, and/or publication of this article.