
Abstract
Background:
High tibial osteotomy (HTO) is an established treatment for uni-compartmental osteoarthritis with varus deformity in relatively active young patients with good knee mobility. The most important factor for success and low complications of HTO is the precise correction of osteotomy. The objective of this study was to evaluate the accuracy of pre-operative planning of open-wedge HTO using t3D computer-aided design (CAD) weight-bearing simulated guidance technique for the succession of surgery.
Materials and methods:
Nineteen patients who met the inclusion criteria were recruited between July 2013 and June 2014. 3D CAD weight-bearing simulated guidance technique was obtained from standard anterior–posterior, lateral of hip-to-ankle full leg standing radiographs, and computed tomography (CT) scan provided the weight-bearing corrective axis of preoperative planning and predictive corrective mechanical axis value. Post-operative mechanical axis value was obtained after surgery.
Results:
This comparative study between the predictive corrective, using 3D CAD weight-bearing simulated guidance technique, and post-operative mechanical axis value, analysed with t-test statistical analysis, showed the insignificant difference (p > 0.05).
Conclusion:
We conclude that the 3D CAD weight-bearing simulated guidance technique has good accuracy as preoperative planning of open-wedge HTO for succession surgery.
Keywords
Introduction
High tibial osteotomy (HTO) is an established treatment for uni-compartment osteoarthritis with varus deformity in relatively active young patients with good knee mobility. Moreover, it can also be used to treat localized medial cartilage defects, such as osteochondritis dissecans and condylar osteonecrosis. 1 –6 The procedures realign a bone to change the biomechanics of a joint, especially to change the force transmission through a joint. Lateral closing wedge HTO was initially preferred, but opening wedge HTO is becoming popular because it is simpler and allows adjustment to be made in both coronal and sagittal planes. In addition, open-wedge HTO avoids possible damage to the lateral aspect of the knee (proximal tibiofibular joint and peroneal nerve). 1 –3 Furthermore, long-term HTO outcomes strongly depend on the degree of correction. Inaccurate assessments of the lower limb mechanical axis are the most important causes of undercorrection or overcorrection, and surgeons have to solve these problems based on personal experience. 5,7,8
To date, intraoperative assessments of mechanical axes that are performed by clinical alignment and fluoroscopy with alignment rods have been concerned about an unelaborate issue. A cable method using fluoroscopy is most commonly used. 9 Fluoroscopic imaging of a radio-dense straight object, such as an alignment rod or bovie cord is obtained as the object, which is held over the centre of the hip and centre of the ankle. The fluoroscope is then moved to the knee to determine the point at which the mechanical axis passes through the knee joint (Figure 1). 10

The cable method of assessing intraoperative leg alignment is not accurate because it depends on limb rotation and alignment guide position.
A grid with radiopaque reference lines and a measurement of correction angles on conventional radiographs have been used as alternative methods for guidance in intraoperative surgery. 7,11 However, these techniques have defects in accuracy because their procedures depend on limb rotation, alignment guide position and quality of image intensification; furthermore, they are affected by parallax. 12 –15
Over the past few years, intraoperative navigation systems have been widely used in orthopaedic surgery, as they allow more precise evaluations of deformities and corrections in real time. 10,12,16,17 The computer navigation in HTO is used to improve intraoperative measurement accuracy and leg axis corrections. Using this technique also reduces exposure time of patient to radiation. 12,13 The precise and continuous leg alignment visualization offered by navigation systems has many benefits especially for accuracy; however, this technique is not widely used due to many limitations, such as the additional time requirement, the stab wound in the femur and tibia for fixing the navigation guidance, and the additional cost. 13,16,18 –20
Moreover, the 3D computer-aided design (CAD) weight-bearing simulated guidance can be a solution to be used in complex modelling in medicine for various purposes, for example, biomechanics investigation, 21 evaluation of implant design 22 and preoperative planning. 23 Therefore, the 3D CAD weight-bearing simulated guidance might be a new sight to overcome the problem caused by computer navigation system that are difficult to perform as mentioned previously.
To prove the potential application of the 3D CAD weight-bearing simulated guidance technique for open-wedge HTO surgery, we applied the technique to calculate for distraction width prior performing the conventional medial opening wedge HTO. The main purpose of this study was to evaluate the accurate preoperative planning for osteotomy to properly correct joint alignment, so as to justify the application of the 3D CAD weight-bearing simulated guidance technique for open-wedge HTO surgery as an appropriate pre-operative surgical planning.
Materials and methods
Inclusion and exclusion criteria
This study was conducted with the formal approval of the human ethical committee of Thammasat University (No.MTU-EC-OT-1-055/57). The inclusion criteria in this study were the surgical indications for high tibial medial open-wedge osteotomy included (1) active physiologically young patients with progressive symptoms unresponsive to conservative treatment; (2) medial compartment gonarthrosis; and (3) a well-preserved range of motion. While the exclusion criteria were (1) the patients with contraindications to CT scan such as claustrophobia, pregnancy and (2) contraindications to high tibial medial open-wedge osteotomy such as lateral compartment gonarthrosis, marked limited range of motion and knee instability.
Nineteen patients who met the inclusion criteria were recruited between July 2013 and June 2014. No patient was excluded. Informed consent was obtained from all patients regarding the HTO procedure, complications of the procedure and imaging process. Patients who agreed were consecutively included in the study. Then, the details of data collection were described.
Acquisition and reconstruction of patient anatomical data
The preoperative planning included a standard anteroposterior (AP), lateral of hip-to-ankle full leg standing radiographs and a Phillips 256-slice Brilliance iCT Gantry Scanner (Cleveland, Ohio, USA) to obtain the anatomical topology of lower extremity. The scan included the data ranged from hip to ankle joint and was performed with 0.625 mm slice thickness.
Data from the 3D CT was saved in Digital Imaging and Communications in Medicine (DICOM) format and subsequently processed into the medical image-processing program (Mimics, Materialise NV, Belgium) to provide 3D geometric models of the lower extremities (Figure 2). The reconstruction technique was based on selection (threshold) of the region of the CT images which was having optimal Hounsfield unit. 24 The optimal Hounsfield value is >300 for bone model reconstruction. The selected region was computed into 3D geometric models (Figure 2). After reconstruction, all geometric models were formatted as stereo lithography (STL) files.

CT images of the lower extremity. CT: computed tomography.
Weight-bearing posture adjustment
The deformity of the lower extremity was normally evaluated from alignment in the weight-bearing posture during standing. However, during the CT acquisition process, the patient was in the laying down posture (supported by the bed underneath). The obtained alignment of 3D lower extremity from the CT scan was therefore not similar to the standing posture. To adjust the alignment of lower extremity obtained from CT scan, the two-dimensional (2D) radiographic images taken in the true AP standing posture was used. Figure 3 illustrates the radiographic image showing the alignment of the lower extremity used in adjustment (Figure 4).

Adjustment weight-bearing hip-to-ankle scannogram to 3D CT to obtain 3D weight-bearing geometric models of the lower extremity. CT: computed tomography; 3D: three-dimensional.

Alignment of lower extremity and associated axes of each alignment pattern. MA angle is defined by frontal plane angle of the mechanical axis of femur with respect to the mechanical axis of tibia. The MA of femur is the line drawn from the centre of the femoral head to knee joint centre, whereas the MA of tibia is the line drawn from the centre of knee joint to centre of ankle joint. Weight-bearing axis is defined by the line connected between the centre of femoral head and the centre of ankle joint. The relevant morphological parameters that are necessary to find the MAs and weight-bearing axis could be obtained using following definition: Femoral head centre represents the best-fit sphere was approximated the shape of femoral head. Knee joint centre represents the centre of the line connected between apexes of both tibial spines. Ankle joint centre represents the centre of the line connected between both malleolus. MA: mechanical axis.
To this end, the adjustment process can be summarized as follows:
Step 1: The 3D lower extremity was projected to the frontal plane, giving the 2D contour line of the bones.
Step 2: The projected contour line of tibia was superimposed to the tibia in the radiographic image.
Step 3: The projected contour line of femur was rotated around the knee joint centre until the projected contour line of femur showed best fit to the femur in the radiographic image.
Step 4: The rotation angle obtained from the previous step represented an angular difference in the alignment of lower extremity between the non-weight and weight-bearing posture.
Step 5: The femur in the 3D lower extremity model was rotated by 3D CAD software to make the 3D lower extremity model in weight-bearing posture.
Virtual corrective preoperative planning
After the lower extremity was adjusted to the weight-bearing posture, it was then aligned in a space in such a way that its load-bearing axis was vertical. The measured MA angle described in the previous method was used to calculate the correction angle which was required to correct the deformed “varus” knee alignment to neutral knee alignment, according to the following equation:

Moreover, the correction with an angle equivalent to mechanical axis (MA) angle is considered to be an ideal correction. There is a chance that in the future, the performed corrective angle could be reduced. Consequently, the load shifted towards the medial compartment and continued the progress on damage of articular cartilage. As a result, the correction was added to 5° over correction. Equation (1) became:

To simulate the open-wedge HTO correction, the 3D model of tibia was cut just above the tibia tubercle position. The most lateral point of cutting line was a hinge, which allowed the proximal and distal part of tibia to be separated by the angle calculated from equation (2). In case a bone graft was inserted in the space to stabilize the resection region, the dimension of bone graft could be estimated. To this end, the cross sections of tibial proximal and distal part of resection region were used to construct the side surface of bone graft using “loft” function in CAD software. The above- and below-bounded surfaces of the bone graft were created using the “filled close contour” function in CAD software. Next, these three surfaces were combined together, producing the complete bone graft volumetric structure. All dimensions of bone graft, that is, width, length and thickness, were measured at this point. Figure 5 shows the virtual corrective preoperative planning of open-wedge HTO surgery.
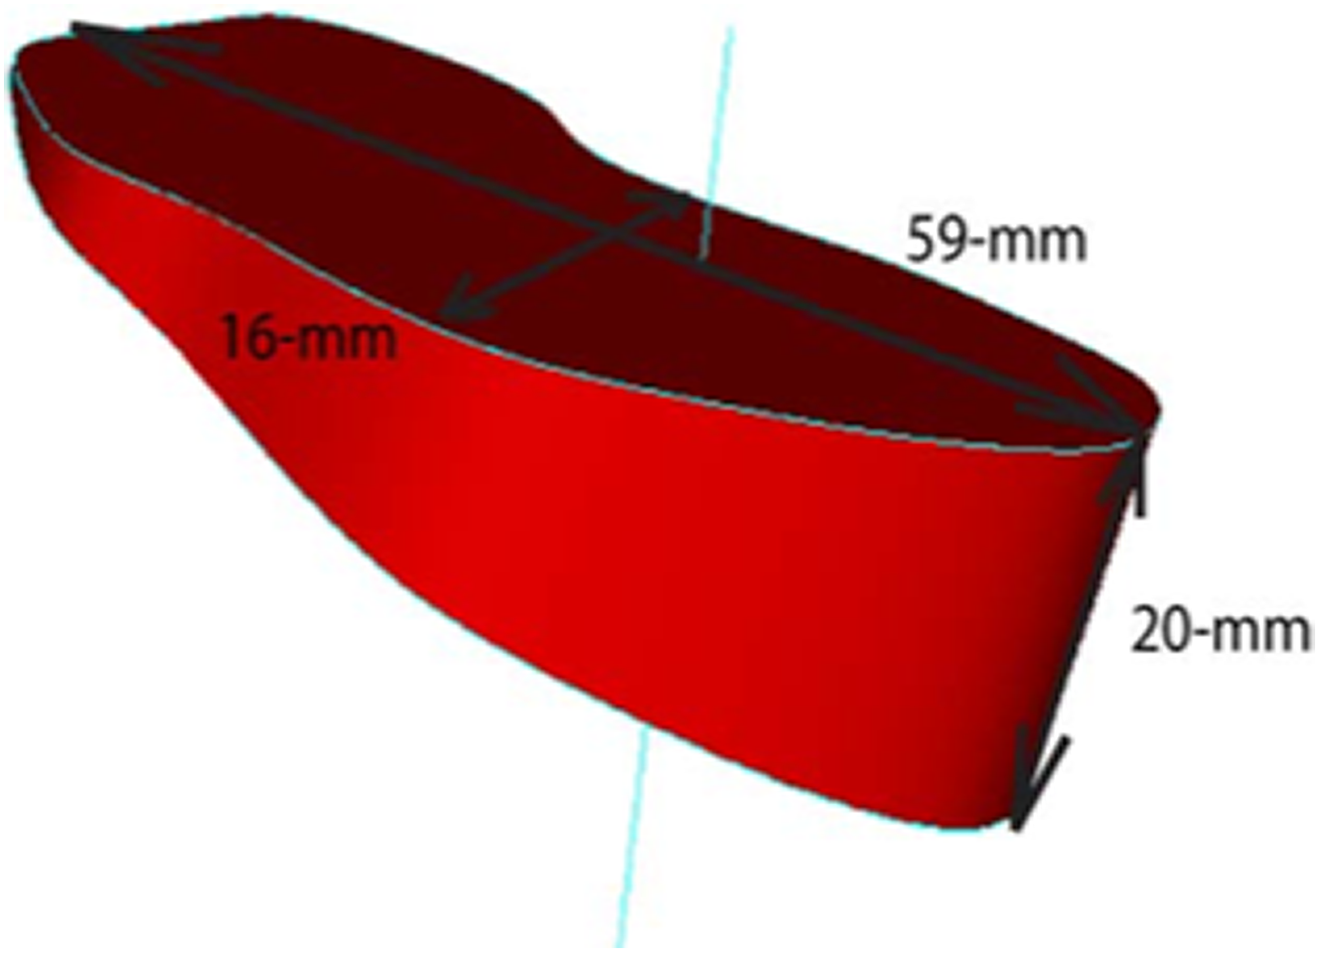
Desired medial opening gap and resected bone from preoperative planning.
The created 3D models were cut as medial open-wedge osteotomy to provide anatomical tibio-femoral axis (5°–7°). The preoperative medial opening gap and resected bone were obtained and noted in the preoperative planning (Figure 5).
Surgical technique
The procedure was performed with the patient under general or spinal anaesthesia and placed in a supine position. Arthroscopy was performed to evaluate medial, lateral and patella femoral compartments and to treat intra-articular lesion, such as cartilage, loose bodies and meniscus injury.
The surface anatomical landmark was identified and marked. Vertical incision was made 5–7 cm long, 4 cm distal to the medial joint line. Then, the pes anserinus was identified. A deep incision was made just above the pes anserinus insertion, and the superficial medial collateral ligament identified. The superficial medial collateral ligament was partial released to reduce medial compartment pressure. The blunt Hohmann retractor was applied to the posteromedial aspect of proximal tibia to protect the neurovascular structures.
Subsequently, the patellar insertion side was identified. Two of 2.5-mm threaded Kirschner wires were applied 4 cm distal to joint line at the medial cortex of proximal tibia and pointed to the tip of the fibular head at the lateral cortex of proximal tibia under imaging intensifier. Then the medial open-wedge osteotomy was performed. The bone oscillating saw and osteotome were applied just distal to the Kirschner-guided wires from the medial cortex of tibia to lateral cortex, leaving an intact lateral hinge of proximal tibia. The stepwise chisels were applied to enlarge osteotomy site. The bone spreader forceps were applied at the dorsomedial intercortical portion of the osteotomy gap and slowly spread to open the medial gap until the desired opening gap was obtained as in the preoperative planning (Figure 6).

Result of the 3D weight-bearing computer-aided design weight-bearing simulated guidance as a guidance in performing HTO. HTO: high tibial osteotomy.
Additionally, the plate was inserted subcutaneously, and its position was checked under an image intensifier.
Results
All demographic data of the preoperative and post-operative alignments are shown in Table 1. No patient was excluded from the study after enrolment. The average mechanical axis in preoperative was −7.81° (range: −14.0 to −1.0, SD: ±4.4). The average corrective axis in preoperative planning was 12.7° (range: 6.0 to 18.0, SD: ±4.3). The average predictive corrective mechanical axis was 5.1° (range: 4.0 to 6.2, SD: ±0.5). The average mechanical axis in post-operative was 5.1° (range: 0.0 to 13.0, SD: ±3.9). The average mechanical axis deviation was −0.04° (range: −3.96 to 3.88, SD: ±3.96). The mean length of surgery time was 95 min (range: 90 to 110 min).
Demographic data, preoperative alignment, mean corrective axis for preoperative planning, post-operative alignment and mean corrective axis for post-operative planning.

MA: mechanical axis; SD: standard deviation.
aPost-operative MA − Pre-operative MA.
Moreover, F-test and t-test were analysed, respectively, to obtain the significant difference between predictive correction MA and post-operative MA (Table 2). F-test was used to test the variance of data, whereas t-test analysed the comparison of average between predictive correction MA and post-operative MA.
Comparison between predictive correction MA and post-operative mechanical axis with t-test statistical analysis.
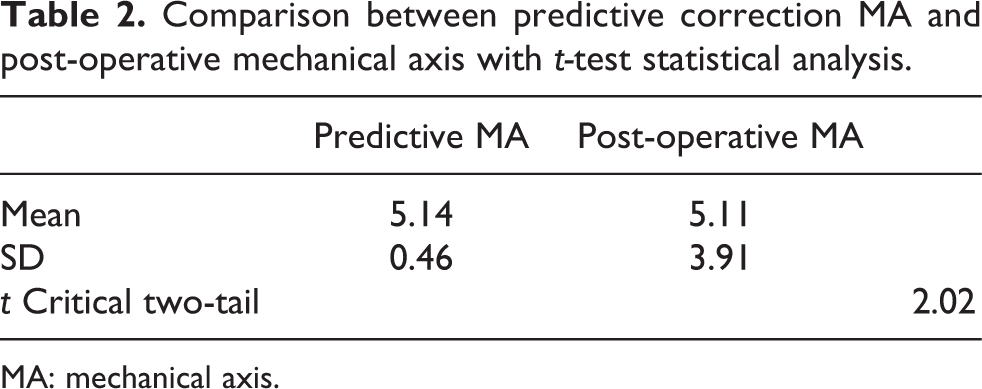
MA: mechanical axis.
The test was performed at 95% significant level (α = 0.05). The analysis showed that the comparison between predictive MA and post-operative MA was not significantly different (5.1 ± 0.5 vs. 5.1 ± 3.9; p > 0.05).
Discussion
Medial opening wedge HTO is one of the techniques used to correct varus malalignment. Nowadays, the accuracy of operation is limited by the accuracy of preoperative and intraoperative methods. There are many techniques for intraoperative assessments of mechanical axes such as using the cable method, a grid with radiopaque reference lines or the measurement of correction angles on conventional radiographs intraoperatively. These techniques have their own disadvantages including low reproducibility, excess radiation, prolonged operation time, complicated setup, high cost and operative complication such as pin tract infection and bone fractures. 10,25,26 The preoperative method benefits the patient by prediction of the surgical planning before surgery. However, the preoperative conventional HTO shows non-reliability of correction.
A special technique such as intraoperative computer assisted navigation in HTO is used for increasing the accuracy and reducing the consequence of malalignments; however, this technique is not widely used due to many limitations. The main disadvantages of navigated HTO are the additional time required for the operative procedure (range: 10 to 23 min), the stab wounds required in the femur and tibia for fixing the navigation system, and the additional cost. Moreover, implantation of half pins or wires can cause pin tract infections or fractures. In addition, although navigation systems are accurate to within 1° or 1 mm, technical pitfalls including line of sight issues, registration errors and mechanical or software malfunctions still occur. An instability or intraoperative deformation of trackers or electric system reduce accuracy and may even stop the navigation system during operation. 13,16,18 –20
The results in our series contributed the precise correction of osteotomy, which is the most important factor for success and low complications of HTO. This method overcomes the variability and human induced errors in measurements in the manual method that especially depend on the surgeon’s experience. The preoperative planning system using the 3D computer-aided design weight-bearing simulated guidance for HTO could be an ideal method to solve the problem of accurate intraoperative control of mechanical axis. The information for all osteotomies in this study was based on a CT scanner adjusted by hip-to-ankle full leg standing radiographs with the purpose of obtaining an anatomical topology of the lower extremity and subsequently processed into the medical image processing program to provide 3D geometric models of the lower extremities in weight bearing as a real condition. This adjustment was considered necessary to allow to obtain the 3D weight-bearing correction alignment from the basic 3D CT in supine position because the cadaveric study reported that the MA showed significant deviation on weight bearing.
The result showed that the predictive MA from the simulation was not significantly different from the post-operative MA (5.1 ± 0.5 vs. 5.1 ± 3.9; p > 0.05). If the determined accepted range were predictive MA ± 3o, we found that 20% (4 of19) patients were overcorrected and 80% patients were included in the accepted range. Previous systematic review showed 9 cohorts used computer navigation during HTO and the other 14 cohorts used a conventional method. This study shows that HTO using the conventional method (cable technique) tends to achieve out of range correction (range: 8–77%), either under-correction or over-correction. In seven computer navigation cohorts, at least 75% of the study population fell into the accepted “range of accuracy” (AR) as proposed by the different studies. 27 We also found that the mean length of surgery time, using this technique was 95 min (range: 90–110 min). Previous study showed that the operation time of conventional group and navigated group were 96 ± 10 and 112 ± 21 min. 28 Therefore, the 3D CAD weight-bearing simulated guidance could be more precise and accurate for medial opening wedge HTO than conventional technique and comparable with navigation technique. This technique also offered less surgical time than the conventional and navigation technique. Nevertheless, the surgeon’s experience is an important factor for accuracy as well. Therefore, the surgeon should be aware of intraoperative measurement errors and recheck intraoperative alignments by another procedure to increase the accuracy of surgery. Besides, CT scan could increase the patient’s radiation exposure (Table 3).
Advantages and limitations.

HTO: high tibial osteotomy; CT: computed tomography.
For further studies, larger number of cases should be considered to increase the accuracy of the study. Furthermore, the short-term and long-clinical outcome should be recorded to prove the usefulness of this study. This study also did not evaluate other parameters in coronal and sagittal plane beside mechanical femoral–tibial axis. Therefore, further studies that evaluate the 3D CAD weight-bearing simulated guidance technique in other parameters are needed to prove the potential advantages of this technique.
Conclusion
Recently, many intraoperative and preoperative techniques have been used for HTO. However, these techniques have encountered some limitations in accuracy such as a cable method using fluoroscopy and a complicated setup with high cost such as the computer navigation in HTO. Computer-aided methods for HTO with the 3D computer tomography preoperative planning have been presented and performed in this study. This method is a preoperative planning technique that allows surgeons to know the precision of the osteotomy site, alignment of lower extremity, associated axes of each alignment pattern, desired medial opening gap and resected bone. The computerized aided method for HTO with the 3D computer tomography preoperative planning overcomes the measurement error from other techniques as mentioned earlier and human-induced errors in the manual method.
Our proposed technique shows precision and reliability in medial opening wedge HTO. Moreover, the application of an existing computer program using a 3D CAD weight-bearing simulated guidance as intraoperative guidance for HTO is easy to access.
Footnotes
Declaration of conflicting interests
The author(s) declared no potential conflicts of interest with respect to the research, authorship, and/or publication of this article.
Funding
The author(s) disclosed receipt of the following financial support for the research, authorship, and/or publication of this article: This study was provided by Thammasat University Research Fund under The TU Research Scholar No. 68/2557.