
Abstract
Purpose:
Intertrochanteric fractures are usually treated with open reduction and internal fixation, but controversy still remains regarding the proper placement of the lag screw on the anteroposterior view. The stability of the lag screw has been shown to correlate with the bone quality around the screw, but the three-dimensional distribution of the bone mineral density (BMD) in the femoral head has not been studied in detail. Herein, the BMD along the femoral neck axis was measured to clarify the recommended position of the lag screw.
Methods:
Ten femoral heads acquired from intertrochanteric fractures were evaluated in this study. Each femoral head was scanned with micro computed tomography and the BMD along the femoral neck axis was measured in five regions: center, anterior, posterior, superior, and inferior. The BMD on the anteroposterior view (superior, center, and inferior) and the BMD on the lateral view (anterior, center, and posterior) were compared.
Results:
The BMD of the center region (173.0 ± 50.6 mg/cm3) was significantly higher than that of the inferior region (139.7 ± 50.1 mg/cm3) on the anteroposterior view (p < 0.01). On the lateral view, the BMD was lower than the center region in the anterior region (165.7 ± 52.8 mg/cm3) and in the posterior region (157.5 ± 42.3 mg/cm3), but the difference was not significant.
Conclusion:
The BMD was higher in the center region of the femoral head than in the inferior region. Therefore, lag screws are recommended to be inserted into the center of the femoral head.
Keywords
Introduction
Intertrochanteric fractures often occur in elderly people with osteoporosis and the quality of care for such patients is an important issue in an aging society. 1,2 Intertrochanteric fractures are usually treated with open reduction and internal fixation using short femoral nails or dynamic hip screws. There are many factors that affect the clinical results and the position of the lag screw and tip apex distance (TAD), which is the sum of the distance from the tip of the screw to the apex of the femoral head on anteroposterior and lateral views, are reported to be the predictors for good outcomes 3 –7 (Figure 1). In these reports, a TAD less than 25 mm and placement of the lag screw tip in the center region on the lateral view have been recommended. However, it has not been clarified whether to place the lag screw in the center region or in the inferior region on the anteroposterior view. 4,5 Although it has been reported in a cadaveric study that the bone mineral density (BMD) of the femoral head strongly correlates with the load at cutout 8,9 and the stability of the lag screw is related to the bone quality where the screw is inserted, few reports analyzed the BMD distribution of the femoral head. 10 –13 Furthermore, no reports measured the local BMD according to the area where the screw is inserted and little is known about the relationship between the TAD and local BMD. 11 Therefore, the purposes of this study were (1) to clarify the distribution of the BMD in the femoral head with the use of the micro quantitative computed tomography (CT) and (2) to analyze the relationship between the TAD and local BMD.

Measurement of TAD. (a) Anteroposterior view of the femur. The red line indicates the neck axis. Two-dimensional distance from the apex of the femoral head to the tip of the lag screw (A) is measured. (b) Lateral view of the femur. Two-dimensional distance from the apex of the femoral head to the tip of the lag screw (B) is measured. The TAD is calculated as the sum of (A) and (B). TAD: tip apex distance.
Materials and methods
Ninety-seven patients (30 men and 67 women) who had an intertrochanteric fracture between October 2013 and December 2015 were the initial subjects of this study. Of these 97 patients, 84 cases with stable intertrochanteric fractures were treated by open reduction and internal fixation, while 13 cases with unstable fractures were treated by cemented bipolar hemiarthroplasty. Of these 13 cases, 3 were excluded, 2 due to the fracture extending into the neck and 1 due to the possibility of a tumor, and the remaining 10 patients (6 men and 4 women, mean age: 82 years) were evaluated in this study. Femoral heads were removed during surgery without the use of a corkscrew to avoid damaging the femoral head and were stored in 10% formaldehyde after surgery. This research was approved by the institutional review board at our institute and informed consent was obtained from all individual participants included in the study.
Micro computed tomography (µCT) images were taken using a CosmoScan FX (Rigaku Corporation, Tokyo, Japan; 90 kV, 160 µA, field of view: 73 mm, slice thickness: 0.146 mm, and scan time: 8 min). The femoral heads were removed from formaldehyde just before taking the μCT images. A bone density calibration phantom was also included in the imaging field. After the µCT images were taken, the femoral head center, femoral neck center, and center of the neck calcar were identified using multi-planar reconstruction software (3D template; Kyocera, Kyoto, Japan). The femoral head center was defined as the center of the best fitted sphere, femoral neck center was defined as the center of the neck, and the center of the calcar was defined as the place where the cortical bone was the thickest in the neck region, according to a previous report. 14 After these three points were identified, the images were resampled and axes were defined as follows. The X-axis (femoral neck axis) was set parallel to the line through the femoral head center and the neck center, Z-axis was set parallel to the line perpendicular to the plane passing through the X-axis and calcar center, and Y-axis was set perpendicular to the X-axis and Z-axis (Figure 2).

Definition of the coordinates. µCT images were resampled using the femoral head center (red point), femoral neck center (green point), and calcar center (blue point). The X-axis was set parallel to the line through the femoral head center and neck center (i.e. neck axis), Z-axis was set parallel to the line perpendicular to the X-axis which included the calcar center, and Y-axis was set perpendicular to the X-axis and Z-axis. The lower row shows the DRRs of the three-dimensional volume corresponding to each direction. A cylindrical density calibration phantom can be seen on the axial and sagittal views of the figure. µCT: micro computed tomography; DRR: digitally reconstructed radiograph.
As the purpose of this study was to measure the local BMD for regions of the femoral head where lag screws are often inserted, specific regions of interest (ROIs) parallel and adjacent to the femoral neck axis were identified for analysis. Using a coronal image slice through the center of the femoral head, three ROIs were defined parallel to the femoral neck axis and were labeled as superior, center, and inferior (Figure 3(a), each ROI shown as a rectangular region on one coronal slice for clarity). Similarly, three ROIs aligned with the femoral neck axis were identified on an axial image slice through the center of the femoral head to define anterior, center, and posterior ROIs (Figure 3(b), each ROI shown as a rectangular region on one axial slice for clarity). These two-dimensional (2-D) regions were then used to define 3-D cuboid ROIs aligned with the femoral neck axis (Figure 3(c)). The central ROI was shared between the coronally and axially defined regions, such that there were five ROIs: superior, inferior, center, anterior, and posterior. The mediolateral length of each of the five ROIs was 30 mm, which was similar to the thread length of a commercially available lag screw (Joy up nail; Joy up, Tokyo, Japan). The vertical and horizontal dimension of each cuboid ROI was between 6 mm and 10 mm, according to the femoral neck height and width, respectively. The ROIs were positioned as medially as possible while avoiding the inclusion of any cortical bone in the ROI. Each of the 5 ROIs was subdivided into 3 subdivisions (medial, center, and lateral) for a total of 15 cuboid subdivisions used to analyze the local BMD in detail (Figure 3(c)). The CT intensity values for each voxel within a cuboid ROI were averaged to calculate the 3-D CT intensity value for each ROI and subdivision using computational software (M-View; Virtual place, Osaka, Japan). After the CT intensity value was measured, local BMD was calculated using the density calibration phantom.

ROIs and subdivisions created for the BMD measurements. (a) Superior, center, and inferior cuboid ROIs shown on a coronal image slice passing through the center of the head (red rectangles). The mediolateral dimension of the ROI was 3 cm for all subjects, and the superoinferior dimension was determined from the height of the neck. BMD was averaged over all voxels within each ROI. (b) Anterior, center, and posterior ROIs on an axial image slice passing through the center of the head (red rectangles). Note that the center ROI is shared between the axial and coronal regions. The mediolateral dimension of the ROI was 3 cm for all subjects, and the anterolateral dimension was determined by the width of the neck. BMD was averaged over all voxels within each ROI. (c) Creation of 15 cuboid subdivisions from 5 cuboid ROIs. Each ROI (red cuboid) was subdivided into medial, center, and lateral subdivisions (subdivided by blue lines), and a total of 15 cuboid subdivisions were created for further analysis. BMD: bone mineral density; ROI: region of interest.
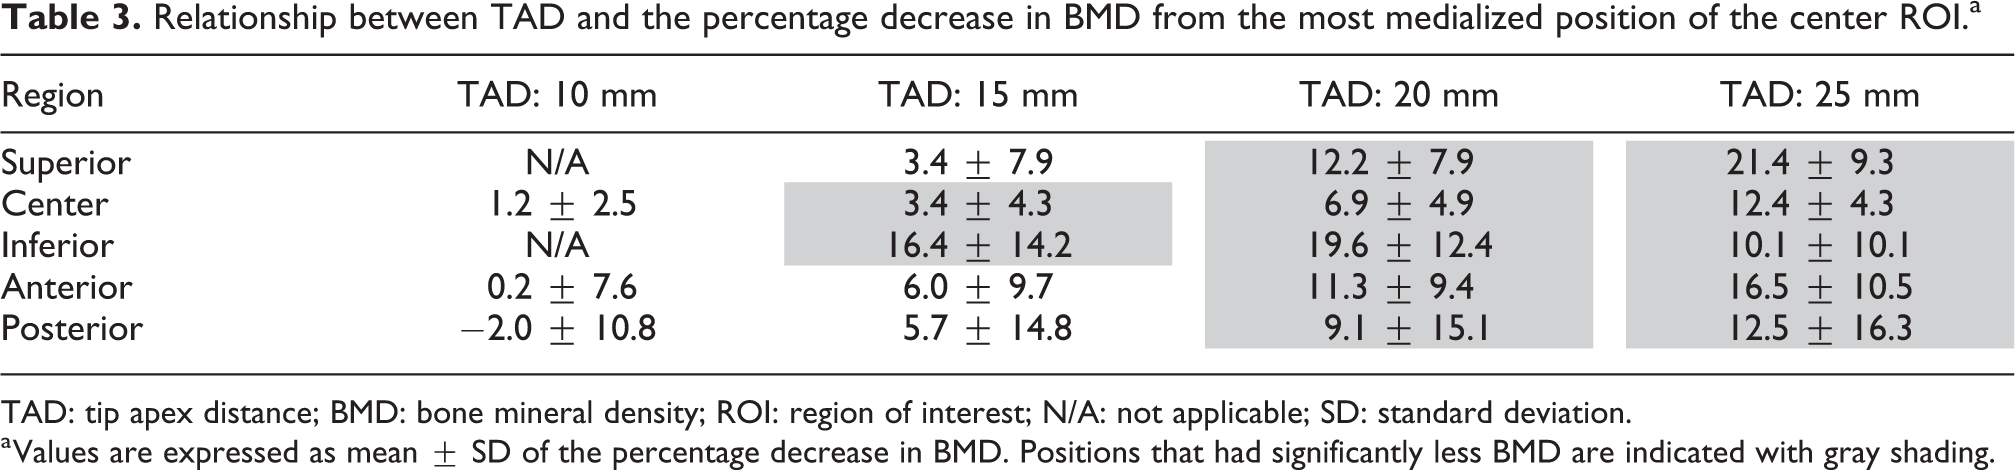
The position of each ROI was varied to represent various TADs and to evaluate the correlation between the depth of the lag screw and local BMD. Each ROI was translated laterally along the neck axis to the point at which the minimum distance between the ROI and the apex of the femoral head was 10, 15, 20, and 25 mm. For each of the simulated TADs, BMD was calculated for each ROI and compared against the local BMD of the center ROI when the TAD was minimized (Figure 4, shown in one coronal slice as a rectangular region for clarity). The BMD for each ROI was measured only when the entire ROI was within the trabeculae of the femoral head and neck.

Position of the ROIs on the coronal plane for varied TADs. Coronal image slice overlaid with rectangles representing the varied positions of the ROIs relative to the TAD. The mediolateral position of each ROI for evaluating the BMD was determined based on the minimum two-dimensional distance from the tip of the apex of the femoral head (red star) to each ROI on the center image slices in the coronal and axial planes (axial plane not shown). The yellow ROI in the center region indicates the most medial ROI, the red ROI represents a TAD of 10 mm, the orange ROI a TAD of 15 mm, the blue ROI a TAD of 20 mm, and the green ROI a TAD of 25 mm. TAD: tip apex distance; ROI: region of interest; BMD: bone mineral density.
All statistical analyses were performed using SPSS statistical software version 23 (IBM Japan, Tokyo, Japan). Normality tests were performed with the Kolmogorov–Smirnov test. The local BMD of each ROI and each subdivision was compared using a generalized linear model with repeated measures and a post hoc analysis was also conducted with a Bonferroni correction. The difference in the BMD of the two groups was compared with a paired Student’s t-test when the values were normally distributed. Values of p < 0.05 were considered to represent significant differences.
Results
On the three coronal ROIs, the average ± standard deviations of the BMD were 166.9 ± 51.4 mg/cm3 in the superior, 173.0 ± 50.6 mg/cm3 in the center, and 139.7 ± 50.1 mg/cm3 in the inferior. There was a significant difference in the BMD between the center ROI and the inferior ROI (p = 0.007; Table 1). On the three axial ROIs, the BMD was 165.7 ± 52.8 mg/cm3 in the anterior and 157.5 ± 42.3 mg/cm3 in the posterior. The center ROI tended to be higher, but no significant difference was observed among the three axial ROIs (Table 2).
Results of the BMD measurements on the three coronal ROIs and nine coronal subdivisions.a,b

BMD: bone mineral density; ROI: region of interest; SD: standard deviation.
a Values are expressed as mean ± SD (mg/cm3).
b A significant difference, p < 0.05, is indicated between superscripts e and f and between superscripts c and d.
Results of the BMD measurements on the three axial ROIs and nine axial subdivisions.a,b

BMD: bone mineral density; ROI: region of interest; SD: standard deviation.
a Values are expressed as mean ± SD (mg/cm3). The center ROI and the center-medial, center-center, and center-lateral subdivisions are shared with Table 1.
b A significant difference, p < 0.05, is indicated between superscripts c and d.
In the comparison of the nine coronal subdivisions, the BMD in the center-center subdivision was the highest among the nine subdivisions (216.2 ± 61.3 mg/cm3) and the inferior-medial was the lowest (97.0 ± 44.0 mg/cm3). Compared with the BMD in the center-center subdivision, all subdivisions, except the superior-medial, superior-center, and inferior-lateral subdivisions, showed a significantly lower BMD (Table 1). By comparing the BMD of the nine axial subdivisions, noting that the center-medial, center-center, and center-lateral are also included in the coronal subdivisions, the center-center subdivision was the highest and the center-medial subdivision was the lowest (134.6 ± 53.2 mg/cm3). The local BMD of the anterior-lateral, center-medial, center-lateral, and posterior-center subdivisions was significantly lower than that of the center-center subdivision (Table 2).
In the analysis of the relationship between the TAD and local BMD, the BMD in the superior, center, anterior, and posterior ROIs decreased as the TAD increased (Table 3). These four ROIs had a significantly lower BMD than the most medialized center ROI when the TAD was more than 20 mm and the BMD decreased by more than 10% from the most medialized center ROI when the TAD was 25 mm. In the inferior ROI, the BMD started to increase when the TAD was above 20 mm (Table 3). All data generated from the analysis are available from the corresponding author upon request.
Relationship between TAD and the percentage decrease in BMD from the most medialized position of the center ROI.a
TAD: tip apex distance; BMD: bone mineral density; ROI: region of interest; N/A: not applicable; SD: standard deviation.
a Values are expressed as mean ± SD of the percentage decrease in BMD. Positions that had significantly less BMD are indicated with gray shading.
Discussion
Proximal femoral fractures, including intertrochanteric fractures, are becoming more frequent in an aging society and it is estimated that the number of cases in Japan is increasing every year, with 175,700 in 2012. 15 Intertrochanteric fractures are usually treated with short femoral nails or dynamic hip screws and comparatively good results are reported. However, cutout of the lag screw is one of the major reasons for additional operation. A systematic review reported that cutout of the lag screw occurs in approximately 2.7% of the cases 16 and many studies have reported that the TAD, position of the lag screw, type of fracture, and quality of fracture reduction are predictors of cutout. 3 –7 However, the distribution of the BMD in the femoral head of the intertrochanteric fracture patients has not been studied in detail. Some studies measured the BMD of the femoral head using the contralateral side (non-fractured side) with clinical CT images, 17 but it is not clear if the BMD is the same as the fractured side since there seems to be a side-to-side morphologic difference even in normal hips, 18 and moreover, it is difficult to measure the local BMD from clinical CT images with its resolution. On the other hand, some reports evaluated the local BMD in the femoral heads of the fractured side using μCT to assess the bone quality at the lag screw position, 8,11 but the BMD was only measured in the proximal and center planes, perpendicular to the femoral neck axis. It is expected that the local BMD parallel to the femoral neck axis would be more relevant to the position where the lag screws are inserted as well as more relevant to the fixation strength. To this end, the local BMD of the femoral head was measured for ROIs along the femoral neck axis in this study using the femoral heads acquired from unstable intertrochanteric fractures.
In the analysis, the BMD was significantly higher in the center ROI than in the inferior ROI. This suggests that lag screws should be inserted into the center ROI from a BMD perspective. By comparing the nine coronal subdivisions, the center-center showed the highest BMD, while the inferior-medial revealed the lowest BMD. The BMD in the superior-medial and inferior-lateral subdivisions was also relatively high (Table 1). It is well known that there are five groups of trabeculae within the proximal femur 19 and the three subdivisions in this study with the highest BMD (center-center, superior-medial, and inferior-lateral) lie on the line of the principal compressive trabeculae which likely accounts for higher BMD in these subdivisions. The reason the center-center subdivision has the highest BMD is suggested to be the effect of the principal compressive trabeculae and principal tensile trabeculae. Singh et al. 20 classified the extent of osteoporosis using radiographs of the proximal femur and stated that the number of principal tensile trabeculae decreases as osteoporosis progresses. However, the results of our study indicate that the trabecular structure remained to some extent, even in very old patients with intertrochanteric fractures.
In the analysis of the relationship between the TAD and local BMD, the BMD decreased as the TAD increased in all regions except the inferior ROI. This tendency is estimated to be the effect of Ward’s triangle, which has a very low BMD. 21 A decrease in BMD of more than 10% occurred when the TAD was 25 mm in these ROIs (Table 3). It has been reported that the risk of lag screw cutout increases significantly when the TAD is over 25 mm 3 –7 and the results of this study may explain these observations. In the inferior ROI, a negative correlation was not observed between the TAD and local BMD, which may be due to an observed low BMD in the inferior-medial subdivision and high BMD in the inferior-lateral subdivision. Based on these results, we would caution against inserting a lag screw deeply into the inferior region.
Limitations
To the best of our knowledge, this report is the first to clarify the local BMD along the femoral neck axis using µCT images and also the first to report the relationship between the TAD and local BMD. However, there are some limitations to our study. First, the number of cases was relatively small, which may have resulted in the lack of significant findings among the ROIs. However, the superoinferior difference found in this study was large, and thus we believe that our findings can be replicated in a larger cohort. Second, the local BMD was only measured parallel to the neck axis with a length of 30 mm. Different results may be found if the ROI was not aligned with the neck axis or if the length of the ROI varied based on femoral head size. However, our subdivision analysis included much of the femoral head which could be interpolated to understand the effect of different orientations. Further, the decrease of BMD with an increase in TAD was found in all ROIs except for the inferior ROI, and thus we believe that our findings are relevant even when a lag screw is inserted unaligned with the neck axis. As the length of the ROI was defined to be 30 mm, it is possible that the local BMD might differ substantially for various head sizes. However, it is important to note that the short femoral nail system provided by the manufacturer usually includes only one specific length of the screw thread. Therefore, we believe that our definition of ROI length to be clinically relevant. Third, BMD was the only parameter measured in this study. A mechanical test was not conducted and the microstructure of the femoral head was also not measured. However, it has been reported in a cadaveric study that there is a strong correlation between the BMD of the whole femoral head and peak torque strength, as well as a strong correlation between the peak torque strength and load at cutout. 8,9,22 Furthermore, a significant correlation between BMD and mechanical parameters has also been reported for the cylindrical samples acquired from the femoral heads obtained during hip arthroplasty. 12 From these reports, we estimate that our findings can be applied to mechanical stability, but higher resolution µCT, measuring bone microstructure, and mechanical testing may be required as a component of future research.
Conclusions
The local BMD of the femoral head in elderly patients with intertrochanteric femoral fractures was higher in the center region than in the inferior region. The local BMD decreased as the TAD increased in the center region. Collectively, the results suggest that lag screws should be inserted deep into the center of the femoral head.
Footnotes
Acknowledgment
The authors would like to thank Dr Tatsuya Kitaura for his help in acquiring the specimens for this research.
Declaration of conflicting interests
The author(s) declared no potential conflicts of interest with respect to the research, authorship, and/or publication of this article.
Funding
The author(s) disclosed receipt of the following financial support for the research, authorship, and/or publication of this article: This work was supported by the International Collaborative Research Program: Strategic International Research Cooperative Program (SICP) (Strategic Japanese-Swiss Cooperative Research Program) from AMED; MEXT/JSPS KAKENHI (grant no. 26108004); and JST PRESTO (grant no. 20407).