
Abstract
Purpose:
Joint pain is the most common symptom of osteoarthritis (OA); however, its mechanism remains unclarified. The present study investigated hindlimb motion during locomotion on the treadmill using a three-dimensional (3D) motion analysis system with high-speed cameras to evaluate whether this method can be used as an indication of joint pain in a mouse model of surgically induced OA.
Methods:
We resected the medial meniscus and medial collateral ligament in 8-week old C57BL/6 male mice and performed locomotion recording 6 months post-operatively. Additionally, we performed the same recording after oral administration of the selective cyclooxygenase-2 inhibitor to determine whether alteration of the parameters were associated with joint pain.
Results:
OA development, characterized by cartilage degeneration and osteophyte formation, was markedly enhanced in the OA group. There was no significant difference between the sham and OA groups in basic gait parameters, including stance duration, swing duration and gait cycle. However, when we divided the gait cycle into four phases and calculated the joint ranges of motion in each phase, the range of motion of the knee joint during the stepping-in phase and the swing duration were significantly decreased in the OA group. These significant differences between the sham and OA groups were diminished by the oral administration of a selective cyclooxygenase-2 inhibitor to the OA group.
Conclusion:
The present method may be useful to evaluate joint pain in experimental mice and contribute to elucidating the molecular mechanisms of pain in the OA knee joint in combination with genetically modified mice.
Introduction
Osteoarthritis (OA) is the most prevalent joint disorder that involves articular cartilage degradation. To investigate the molecular mechanisms underlying OA development, surgically induced mouse knee OA models were established in 2005. 1,2 Histological analyses employed to evaluate OA progression in studies using murine models have identified various molecules and signals involved in OA progression, including proteolytic enzymes, endochondral ossification–related molecules and inflammatory factors. 3
The most common symptom of OA is joint pain. Although the presence of knee pain increases with radiographic OA severity, the severity of radiographic changes does not correlate with pain severity in the individual patient. 4 There are abundant published findings about the molecular mechanisms of articular cartilage degeneration, but the mechanisms of pain in joint OA generally remain unclarified.
Several methods have been developed to assess joint pain in experimental small animals. Methods used to evaluate pain in OA model mice include mechanical sensitivity, recording of spontaneous behaviour, incapacitance meter, rotarod testing and gait analysis using a footprint-based method like the CatWalk system. 5 These methods can identify some aspects of the painful joint. Furthermore, joint movements can be quantitatively evaluated during human activities such as walking, running and jumping using a three-dimensional (3D) motion analysis system with high-speed cameras; this method is widely used in sport and rehabilitation medicine. Motion analysis has also been used in rodent models of cerebellar dysfunction or Alzheimer’s disease to reveal the mechanisms of gait abnormality. 6,7 This system may also be useful for quantification of joint pain–related gait alteration in OA model mice, which is necessary for elucidation of the molecular mechanisms underlying OA joint pain.
Herein, we aimed to evaluate whether the 3D motion analysis system could be used to indicate the pain experienced by OA model mice. We performed 3D motion analysis of mice with surgically induced OA to examine how cartilage degeneration of the knee joint alters locomotor pattern on the treadmill, particularly regarding the temporal and spatial parameters. Additionally, we performed oral administration of a selective cyclooxygenase-2 inhibitor, which is commonly used for pain relief in OA patients, to the OA surgery group, and analysed the subsequent alteration of gait parameters.
Material and methods
Mouse knee OA model
We performed all experiments according to a protocol approved by the Animal Care and Use Committee of the University of Tokyo. C57BL/6 mice were used for all mouse experiments (mean body weight: 30.7 g; range: 27.4–34.0 g). All mice were kept in plastic cages with sawdust bedding in a specific pathogen-free facility, with four to five animals per cage. The room had a 12-h dark/light cycle and was maintained at a constant temperature (18–22°C). Mice were allowed to move freely in the cages and had free access to food and water.
The surgically induced OA model was created using 10 male 8-week-old mice. Under general anaesthesia with 2–3% isoflurane, we performed resection of the medial collateral ligament and medial meniscus using a surgical microscope. 1 The surgical wound was then irrigated with saline and closed. As a sham operation in the sham group (10 male 8-week-old mice), the same skin incision was performed without ligament/tendon resection. We did not administer post-operative analgesic treatment to either group.
Measurement of range of motion of the operated knee joint
We measured the range of motion of the operated knee joint immediately before the surgery, and at 6 months post-operatively under general anaesthesia. We measured the maximal and minimal angle of the mouse knee joint using an angle gauge by gentle manual extension and flexion, respectively.
Radiographic analyses
Anteroposterior radiographs of the operated knee joints were taken immediately before the surgery, and at 6 months post-operatively under general anaesthesia using a soft X-ray apparatus (CMB-2; Softex Co., Tokyo, Japan).
Locomotion recording and motion analyses
Kinematic recording and motion analysis were performed at 6 months post-operatively as previously described. 6 Briefly, the mice were first habituated to the treadmill apparatus and trained to walk on it. To enable observation of hindlimb movements, the fur on the hindlimb of each animal was shaved. Circular infrared reflective markers (3 mm in diameter) were precisely placed on the shaved skin over anatomic landmarks of the right hindlimb: the iliac crest, the great trochanter (hip), the lateral malleolus (ankle) and the fifth metatarsophalangeal joint. The animals walked freely at a speed of 24 m/min imposed by the treadmill belt, and their locomotory movements were recorded at 200 frames per second using three high-speed digital image camera systems (HAS-220, DITECT, Inc., Tokyo, Japan).
Motion analysis was performed in the sagittal plane parallel to the direction of walking. Custom-designed image analysis software (DIPP-Motion 3D, DITECT, Inc., Tokyo, Japan) was used to extract the 3D coordinates of the various joint markers, to reconstruct the movements in the form of angular excursions of the joints and to calculate the temporal and spatial parameters. Due to skin slippage above the knee joint during walking, the actual knee position was calculated by triangulation from the position of the hip and ankle joint, using the measured lengths of the femur and tibia that were obtained from radiographic images. Ten or more gait cycles were extracted from smooth sequential gaits of more than five steps and were used for kinematic analysis of each mouse. The gait cycle can be divided into the swing phase and the stance phase. The swing phase is defined as starting at the moment when the animal lifts its foot from the treadmill belt and ends when the foot comes back into contact with the treadmill belt. The stance phase is defined as starting when the foot touches the treadmill belt and ends when the foot lifts from the belt.
Oral administration of selective cyclooxygenase-2 inhibitor
After locomotion recording, the OA group received 30 mg/kg orally of the selective cyclooxygenase-2 inhibitor Celecoxib. The locomotion recording was performed again 2 h after Celecoxib administration.
Histological analyses
After the above-mentioned recordings and analyses, the mice were euthanized. Knee joint samples were fixed in 4% paraformaldehyde for 24 h, decalcified in ethylenediaminetetraacetic acid at 37°C on a shaker for 5 days and embedded in paraffin. Coronal sections (4-μm thick) were prepared and stained with Safranin O and fast green according to the standard protocol.
We quantified the severity of knee OA in the medial and lateral compartments using the Osteoarthritis Research Society International (OARSI) scoring system. 8 Histological scoring was performed on the femoral and tibial articular cartilage of the medial and lateral compartments of the knee, using 5–10 slides for each sample.
Statistical analyses
Statistical analyses were performed using JMP Pro 11. Multiple group means were analysed by one-way analysis of variance, followed by Dunett’s multiple comparisons test when appropriate. The paired t-test was used to assess the differences between groups in passive range of motion of the knee joint and OARSI score.
Results
OA development
We first prepared the surgically induced OA model using 8-week old C57BL/6 male mice and reared them for 6 months post-operatively. The passive extension range of the operated knee joint under general anaesthesia was significantly decreased compared with the sham group (Figure 1(a)). Radiography showed OA development in the operated knee joints, accompanied by obvious osteophyte formation and sclerosis of subchondral bone (Figure 1(b)).
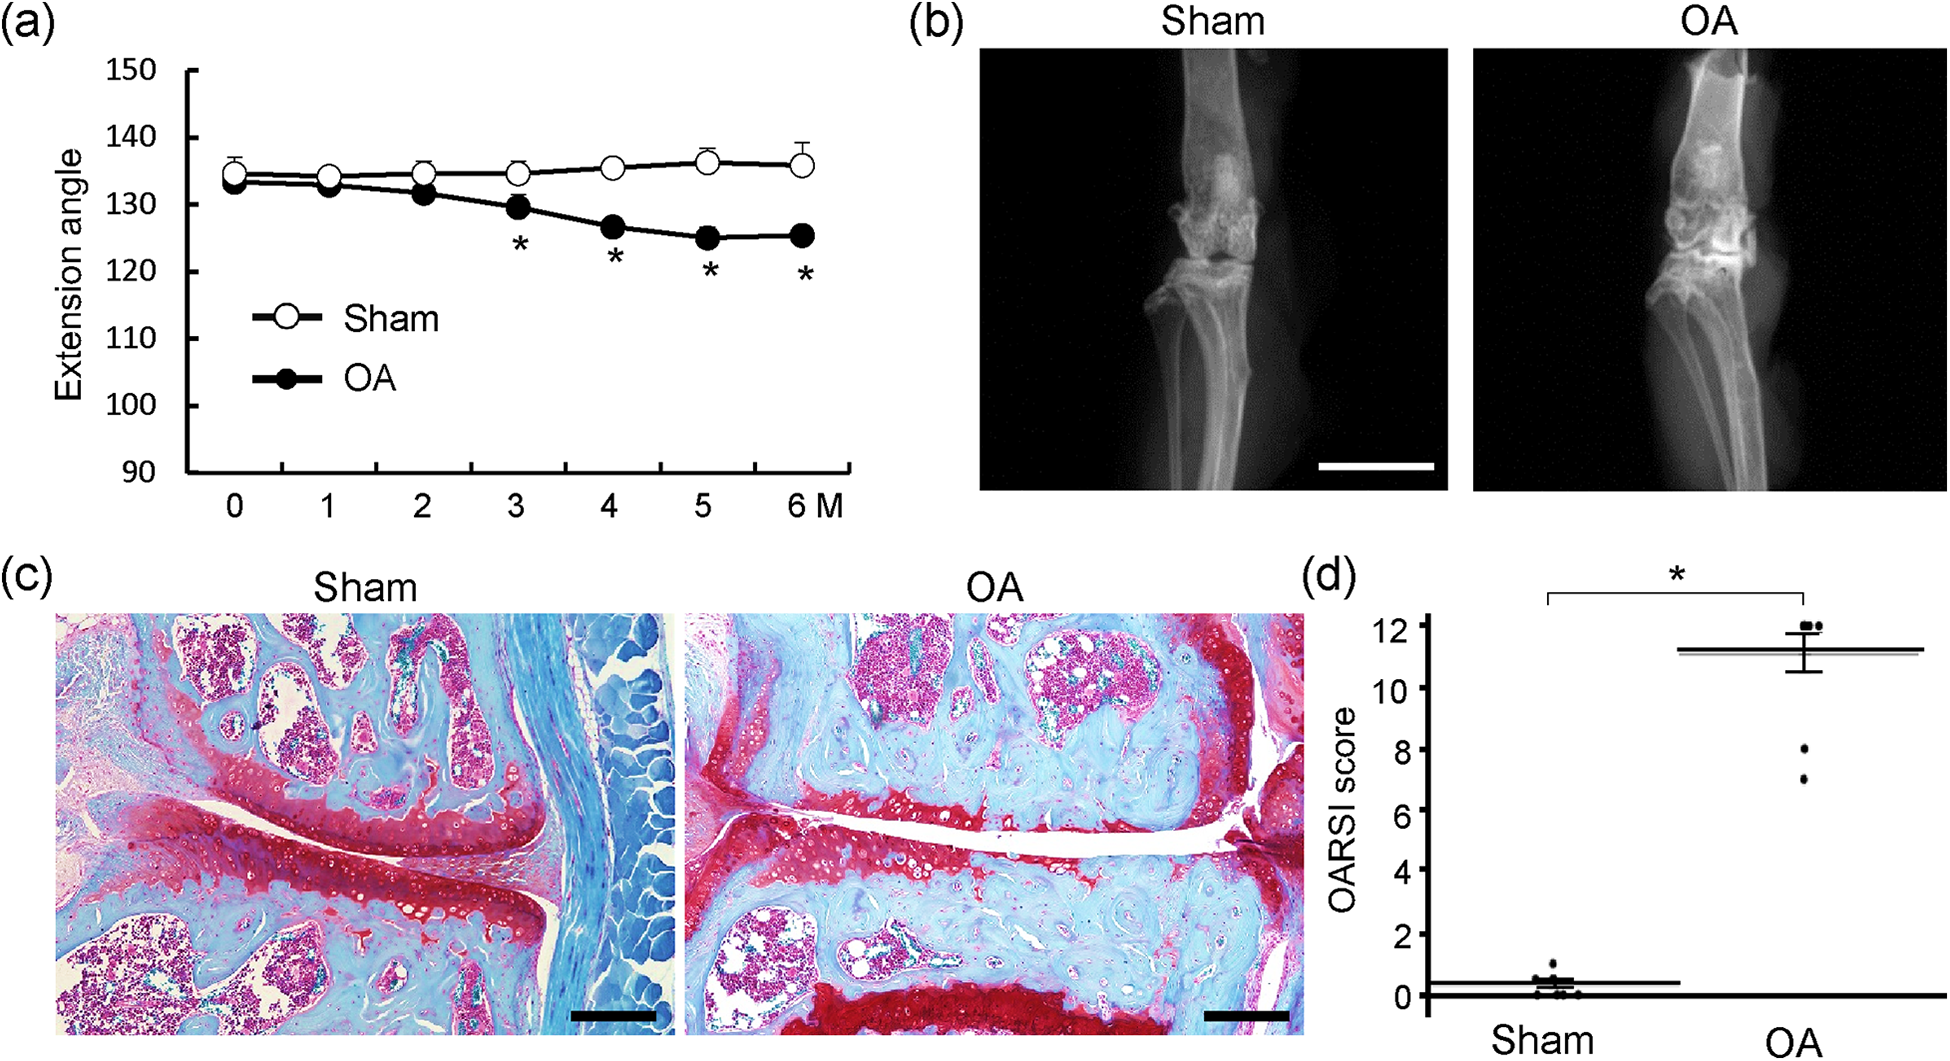
Osteoarthritis development by surgical induction of knee joint instability. (a) Extension angle of operated knee joints from the time of surgery until 6 months post-operatively. *p < 0.05 versus the sham group at each time point. (b) Plain radiographs of operated knee joints at 6 months post-operatively. Scale bar: 5 mm. (c) Representative images of Safranin O staining of the medial knee compartment at 6 months post-operatively. Scale bar: 200 μm. (d) Quantification of osteoarthritis development using the OARSI grading system. Data are expressed as means (bars) ± SE (error bars). *p = 0.0227. The OA group (n = 10) underwent resection of the medial collateral ligament and medial meniscus. The same skin incision was performed in the sham group (n = 10), without ligament/tendon resection. SE: standard error; OA: osteoarthritis.
After completion of all locomotion recordings, radiography and measurements of the hindlimb joints’ ranges of motion, the mice were euthanized and the knee joints were histologically examined. The articular cartilage of the knee joints in the OA group was markedly degenerated and thinner than that in the sham group (Figure 1(c)). The OARSI scoring indicated significant enhancement of OA development in the OA group (Figure 1(d)).
Gait analyses
Hindlimb movements were investigated with a 3D motion capture system during locomotion on the treadmill (Online Supplementary videos S1–S3). The two groups did not differ in stance duration, swing duration and gait cycle (Table 1). We then analysed angular variations of the hip, knee and ankle joints during gait cycles and divided the gait cycle into subphases (Figure 2(a) and (b)). The angular variations of the hip joint were divided into a flexion (F) and an extension (E) phase, while the angular variations of the knee and ankle joints were divided into a flexion (F) and three extension (E1, E2 and E3) phases (Figure 2(b)). The swing and stance durations were equivalent to the F + E1 and E2 + E3 phases, respectively (Figure 2(b)). The transition from flexion to extension during swing duration is the beginning of the E1 phase and that during stance duration is the beginning of the E3 phase (Figure 2(b)). There was no significant difference between the two groups regarding the angles of the joints at the beginnings of the E2, E3, F and E1 phases, except regarding the ankle angles at the beginning of E1 (Figure 3).
Numerical and statistical parameters for kinematic analysis of the three experimental groups.a

SE: standard error; OA: osteoarthritis.
aData are expressed as means ± SE.

Joint angles and gait cycle phases. (a) Definitions of the angles of the hip, knee and ankle joints. (b) Time course of the changes in the joint angles during a normal gait cycle of a sham group mouse. E and F phases are shown for the hip joint and E2, E3, F and E1 phases are shown for the knee and ankle joints.

Joint angles at the beginnings of the E2, E3, F and E1 phases. Data are expressed as means (bars) ± SE (error bars). *p = 0.0274. The OA group (n = 10) underwent resection of the medial collateral ligament and medial meniscus. The same skin incision was performed in the sham group (n = 10), without ligament/tendon resection. The Celecoxib data were obtained from the OA group after administration of 30 mg/kg oral Celecoxib. SE: standard error; OA: osteoarthritis.
We then calculated the alterations in joint angles at the beginnings of two phases. There was no significant difference in the range of motion of the hip joint during the E phase (⊿E–F) compared with that during the F phase (⊿F–E; Figure 4). In the knee joint, the ranges of motion during the E2 phase (⊿E2–E3), the F phase (⊿F–E1) and the E1 phase (⊿E1–E2) in the OA group were significantly smaller than those in the sham group (Figure 4); the range of motion during the E3 phase (⊿E3–F) in the OA group tended to be smaller than that in the sham group, but this difference was not significant (p = 0.0828; Figure 4). In the ankle joint, only the range of motion during the E2 phase (⊿E2–E3) in the OA group was significantly larger than that in the sham group (Figure 4).

Alterations of joint angles at the beginnings of two phases. Data are expressed as means (bars) ± SE (error bars). *p < 0.05, **p < 0.01. The OA group (n = 10) underwent resection of the medial collateral ligament and medial meniscus. The same skin incision was performed in the sham group (n = 10), without ligament/tendon resection. The Celecoxib data were obtained from the OA group after administration of 30 mg/kg oral Celecoxib. SE: standard error; OA: osteoarthritis.
To determine whether these parameters were associated with joint pain, we analysed these parameters in the OA group after oral administration of the selective cyclooxygenase-2 inhibitor Celecoxib. After Celecoxib treatment, the ranges of motion of the knee joint in the E2 phase (⊿E2–E3) and the E1 phase (⊿E1–E2) and that of the E2 phase (⊿E2–E3) in the ankle joint were not significantly different from those in the sham group (Figure 4).
Discussion
The present study demonstrated that the ranges of motion of the knee joint in three gait cycle phases were decreased by severe knee OA, and these decreased ranges of motion in two gait phases were improved by the oral administration of Celecoxib. The increased range of motion of the ankle joint during the stepping-in (E2) phase was probably caused by the decreased range of motion of the knee joint (Figure 4). The present data are consistent with a previous study that reported a decreased range of motion in the knee joint during gait cycles in moderate and severe OA patients. 9 Generally, the range of motion is decreased by either pain or joint contracture in OA patients. Joint contracture was observed in the operated knee joints of the OA group (Figure 1(a)); however, the motion range used in the actual gait was from 58.6° to 90.1°, which was completely within the passive motion range in the OA mice (from 36.3° to 125.4°). This indicates that the decreased ranges of motion of the knee joint in ⊿E2–E3, ⊿F–E1 and ⊿E1–E2 were not solely caused by joint contracture. The increased range of the ankle joint in ⊿E2–E3 may be compensation for the decreased range of the knee joint. We hypothesize that the decreased ranges of motion of the knee joint were probably caused by OA joint pain, as these decreases tended to be reduced slightly by Celecoxib administration; however, we could not clearly prove this in the present study. To clarify this issue, other conditions of the Celecoxib administration, or other analgesics, should be applied in subsequent studies. The decreased range of motion of the knee joint in OA model mice may have been caused by both acute joint pain and fear avoidance, as the latter was probably not affected by the Celecoxib administration.
Although joint pain is the major symptom of OA, it has been challenging to evaluate pain in experimental animals. Several pain assessment methods have been developed and used for OA model mice, but there is still controversy regarding which is the most reliable assessment method. Malfait et al. performed von Frey testing, radiant heat paw-withdrawal test, overnight locomotor activity and CatWalk gait analysis using a mouse model with OA induced by destabilization of the medial meniscus. 10 The OA model mice reportedly showed rapid onset of progressive bilateral mechanical allodynia 10 ; however, they did not report any other potentially pain-relevant parameters, such as thermal hyperalgesia and gait changes. Muramatsu et al. examined the gait parameters of mice that had undergone destabilization of the medial meniscus using the CatWalk system with or without intra-articular injection of hyaluronan. 11 They found that the stance duration was significantly decreased in the OA mice 12 weeks post-operatively, and the decrease was diminished by hyaluronan treatment. 11 Ruan et al. compared hotplate nociception analysis, rotarod analysis, wire-hang analysis and conventional footprint gait analysis using cruciate ligament-transected wild-type mice. 12 OA development resulted in decreased time on the rotarod and a delayed response in the hotplate analysis. 12 Furthermore, although there were no significant differences in stride and base, the OA group had a smaller hindfoot print area compared with the control group. 12 The findings of these previous studies indicate that it may be necessary to perform several analyses of pain assessment to adequately evaluate OA joint pain. Although an increasing number of studies are using the footprint-based gait analysis system in research of neurological diseases, its utility in OA study is still controversial. In the present study, there were no significant differences between the two groups in basic gait parameters, including stance and swing durations.
In the present study, we performed motion analysis only in the sagittal plane parallel to the direction of walking. This method cannot detect motion in the coronal plane, such as lateral thrust, a common feature of advanced OA patients. The use of 3D motion analysis with many cameras in multiple directions may be able to detect other altered gait parameters. Another limitation is that we did not perform sequential recordings after OA induction. The features and severity of joint pain may vary according to the stage of OA. Further studies are necessary to reveal how the gait changes with OA development and to determine which parameter is most useful as a marker of joint pain.
In conclusion, we revealed that the ranges of motion of the knee joint in the gait cycle phases are decreased in mice with surgically induced severe OA, and that these decreases are possibly associated with joint pain. The present method can evaluate joint pain in experimental mice and may contribute to elucidation of the molecular mechanisms of pain in the OA knee joint in combination with genetically modified mice.
Supplementary material
SupplementaryVideo1 - Alteration of gait parameters in a mouse model of surgically induced knee osteoarthritis
SupplementaryVideo1 for Alteration of gait parameters in a mouse model of surgically induced knee osteoarthritis by Yuma Makii, Meiko Asaka, Susumu Setogawa, Soichiro Fujiki, Yoko Hosaka, Fumiko Yano, Hiroyuki Oka, Sakae Tanaka, Naoshi Fukui, Dai Yanagihara and Taku Saito in Journal of Orthopaedic Surgery
Supplementary material
SupplementaryVideo2 - Alteration of gait parameters in a mouse model of surgically induced knee osteoarthritis
SupplementaryVideo2 for Alteration of gait parameters in a mouse model of surgically induced knee osteoarthritis by Yuma Makii, Meiko Asaka, Susumu Setogawa, Soichiro Fujiki, Yoko Hosaka, Fumiko Yano, Hiroyuki Oka, Sakae Tanaka, Naoshi Fukui, Dai Yanagihara and Taku Saito in Journal of Orthopaedic Surgery
Supplementary material
SupplementaryVideo3 - Alteration of gait parameters in a mouse model of surgically induced knee osteoarthritis
SupplementaryVideo3 for Alteration of gait parameters in a mouse model of surgically induced knee osteoarthritis by Yuma Makii, Meiko Asaka, Susumu Setogawa, Soichiro Fujiki, Yoko Hosaka, Fumiko Yano, Hiroyuki Oka, Sakae Tanaka, Naoshi Fukui, Dai Yanagihara and Taku Saito in Journal of Orthopaedic Surgery
Footnotes
Acknowledgements
Declaration of conflicting interests
The author(s) declared no potential conflicts of interest with respect to the research, authorship and/or publication of this article.
Funding
The author(s) disclosed receipt of the following financial support for the research, authorship and/or publication of this article: This study was supported by JSPS KAKENHI grant number #15K15535 (TS). The funding source had no involvement in the study design, analysis or interpretation of data, writing of the manuscript or the decision to submit the manuscript for publication.
Supplementary material
Supplementary material for this article is available online.
References
Supplementary Material
Please find the following supplemental material available below.
For Open Access articles published under a Creative Commons License, all supplemental material carries the same license as the article it is associated with.
For non-Open Access articles published, all supplemental material carries a non-exclusive license, and permission requests for re-use of supplemental material or any part of supplemental material shall be sent directly to the copyright owner as specified in the copyright notice associated with the article.