
Abstract
Purpose:
Osteopenia and osteoporosis are the two most common musculoskeletal disorders in the elderly population. We determined whether osteopenic and osteoporotic patients with fractures exhibit differences in trabecular morphology and biomechanical properties of bone.
Methods:
Fourteen osteopenic patients and 28 osteoporotic patients with hip fractures who underwent hemiarthroplasty for proximal femoral fractures caused by low-energy injury were included. Bone mineral density (BMD) measurements were performed. Compression tests and high-resolution micro-computed tomography were used to assess cancellous bone samples obtained from the principal compressive region of the femoral head.
Results:
The BMD values were lower in the osteoporotic patients than in the osteopenic patients (p < 0.05). There was a significant difference in the yield stress values between the groups (p < 0.05). However, no significant differences in the strain energy density, stiffness and Young’s modulus were observed between the groups (p > 0.05). The mean maximum stress was significantly higher in the osteoporotic patients than in the osteopenic patients (p < 0.05). Although structural parameters, including bone volume (BV), BV fraction, trabecular thickness, trabecular connectivity density and trabecular number, were higher in the osteopenic patients, the differences were not significant (p > 0.05). Trabecular separation values were significantly higher in the osteoporotic patients (p < 0.05).
Conclusion:
Our results showed that the trabecular morphology and biomechanical properties of bone were not significantly different between osteopenic and osteoporotic patients in terms of some parameters.
Introduction
Osteopenia and osteoporosis are the two most common musculoskeletal disorders in the elderly population. 1 –3 The former is a skeletal disorder characterized by a reduction in the bone mass caused by impaired bone remodelling. The rate of bone resorption surpasses the rate of bone formation, which leads to weakened bone. 2 Osteopenia is defined as a bone mineral density (BMD) T-score between 1.0 and 2.5 standard deviations (SDs) below the mean of sex- and ethnicity-matched healthy adults. 1,2 Osteoporosis, in contrast, is a chronic progressive disease characterized by reduced bone mass and impaired microarchitecture, which leads to diminished physical strength of the bone and is the leading cause of fractures in elderly. 2,4,5 Osteoporosis is defined as a BMD or T-score >2.5 SDs below the mean or a T-score <−2.5. 1,2
In ageing populations, osteoporosis, which is a global public health issue, is a major clinical burden, particularly in relation to osteoporotic fractures. 4,6 Osteopenic patients may suffer from osteoporotic-like fractures similar to those that occur in osteoporotic patients. 3,7 Such fractures are often caused by minor injuries when the skeleton is unable to resist normal loading. 3,8
Several studies have investigated the potential causes of proximal femoral fractures, and risk factor analysis has shown that patients with hip fractures have a lower bone mass than healthy individuals. 9 However, some authors have suggested that there is no difference in the BMD values of the femoral neck and head between patients with femoral neck fractures and age-matched healthy individuals. 5,10
Bone quality and structure are critical in identifying the fracture risk in elderly patients. The microstructure and material properties of the trabecular bone determine the bone strength and stiffness. 11,12 Normal bones under physical stimulation undergo a functional adaptation response that alters the bony structure. In contrast, the bony internal microstructure may vary with increasing age; therefore, it can affect the biomechanical characteristics of the bone and lead to the onset of certain diseases such as osteopenia and osteoporosis. 1,5,11 –14
In this study, we investigated osteopenic and osteoporotic patients with fractures to determine whether they exhibited differences in trabecular morphology and biomechanical properties of bone. Therefore, we used compression tests and high-resolution micro-computed tomography (micro-CT) to analyse cancellous bone samples obtained from the principal compressive region of the femoral head in osteopenic and osteoporotic patients with hip fractures.
Materials and methods
Sample preparation
Femoral head samples were obtained from patients who underwent hemiarthroplasty for proximal femoral fractures caused by low-energy injury. Patients with malignancies, gastrointestinal diseases, abnormal mineral metabolism, endocrinopathies and other causes of secondary osteoporosis and patients receiving treatment for osteoporosis were excluded.
According to the BMD results of the proximal femur, the patients were divided into two groups: osteopenic patients (n = 14; mean age, 79; range, 64–90 years; T–score, −1 to −2.5) and osteoporotic patients (n = 28; mean age, 80; range, 65–92 years; T-score, <2.5). BMD was measured within the first week postoperatively from healthy hip images obtained by dual-energy X-ray absorptiometry (DXA; QDR 4500 DXA system; Hologic, Bedford, Massachusetts, USA).
Rectangular prism-shaped cancellous bone samples that were 3 × 2 × 2 cm3 in size were obtained from the principal compressive region of the femoral head using a linear precision saw (Figure 1). The samples were kept at −18°C until testing and were defrosted 24 h before the biomechanical testing.
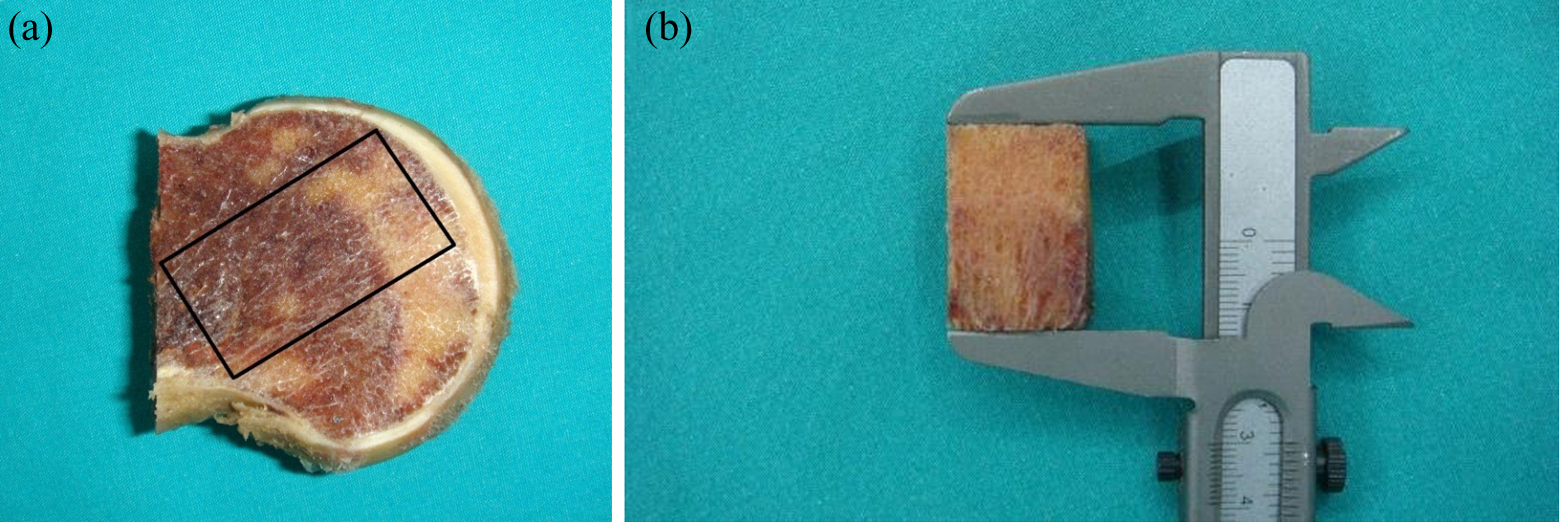
(a) A schematic diagram of the site in the femoral head of the principal compressive area where rectangular prism samples of cancellous bone were removed. (b) 3 × 2 × 2 cm3-sided rectangular prism test samples were taken.
Micro-CT imaging
Before mechanical testing, spongious bone samples were randomly obtained from nine female patients in the osteoporotic group and nine female patients in the osteopenic group. The microarchitectural structure was examined using a micro-CT system (Micro CT-50; Scanco Medical AG, Bassersdorf, Switzerland; Figure 2).
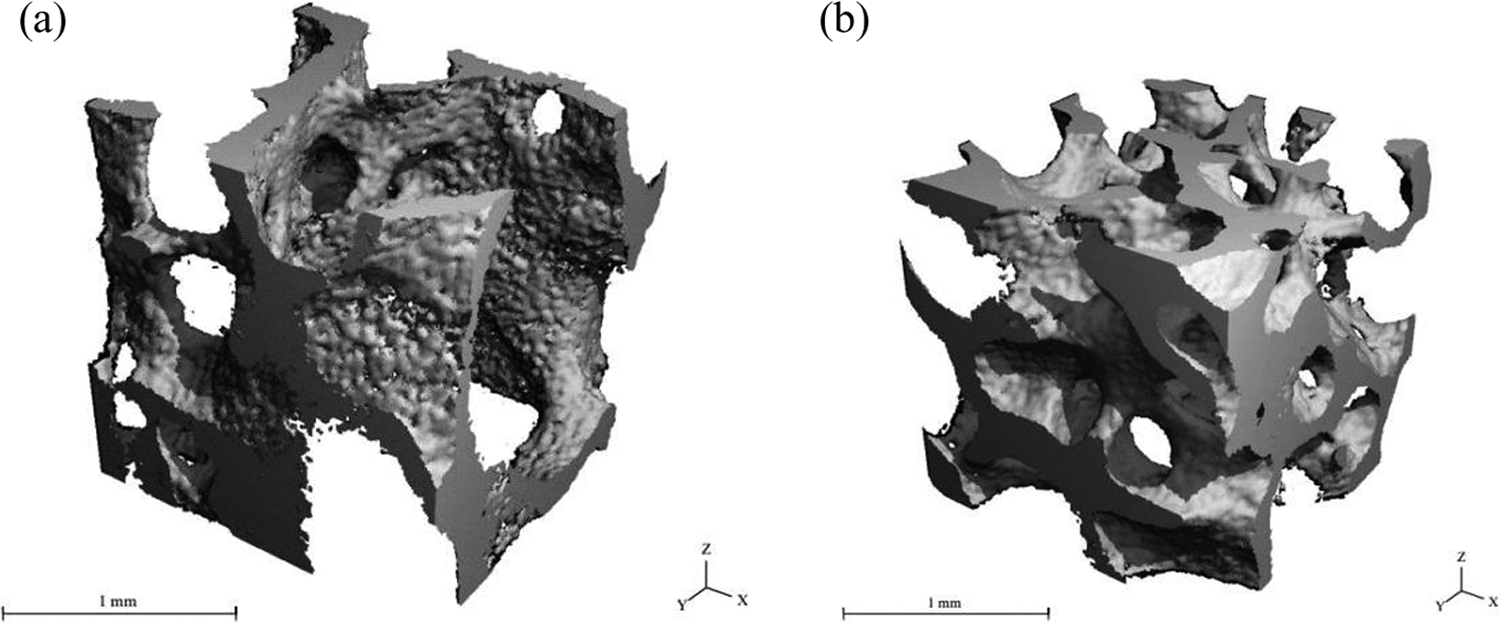
Typical three-dimensional reconstructions of bone cores from the femoral head. (a) Osteoporosis. (b) Osteopenia.
The unit system of the micro-CT device included an X-ray source directed towards a cylindrical specimen holder. The two cancellous bone sample groups were numbered and arranged in a vertical position in the holder. Cotton was placed between the samples to ensure that discrete images were obtained. The slice images were collected, processed and plotted on an HP workstation running the virtual memory system (VMS) operating system. The measurement protocol was set to define the scanning parameters, which included the source energy, sample size and image resolution. The source voltage was 55 kV, and the source current was 145 μA for the cancellous bone measurements. The samples were scanned using high-resolution settings in which each of the two-dimensional slices was 2.048 × 2.048 pixels. Each slice and slice gap had an element size of 0.01 mm. Three-dimensional histomorphometric analysis was performed on each sample of each group by selecting an arbitrary 2 × 2 × 2 mm3 volume of interest.
Microarchitectural variables, including bone volume (BV), BV fraction (BV/total volume (TV)), trabecular thickness (Tb.Th), trabecular number (Tb.N), trabecular separation (Tb.Sp) and trabecular connectivity density (Conn.D), were assessed in both groups. These parameters were calculated by performing three-dimensional triangulation on 200 slices (1 slice = 0.01 mm).
Mechanical testing
The femoral head dimensions were measured using a calliper and used as parameters during the biomechanical analysis. Biomechanical compression tests at a speed of 0.04 mm/s 12 were performed using an Autograph AG-IS 100 kN (Shimadzu Co. Kyoto, Japan) to obtain force–displacement curves. We used a 5-kN Shimadzu load cell. The machine was used to generate force and was controlled by the stroke. In other words, the force acting on the femoral head bone sample was controlled by the displacement applied. The maximum compression or stopping level was fixed at 4 mm. The load cell signals and displacement signal results were discretized by acquiring 10,000 data points sampled at 100 Hz.
When the signals for all femoral cancellous bone were acquired, the biomechanical parameters, such as elastic modulus (Young’s modulus, MPa), maximum stress (MPa), yielding stress (MPa), stiffness (N/mm) and strain energy density (kJ/m3), were evaluated for each clinical group. Once the test was completed for each sample, the final axial length of the specimen was subtracted from the initial length. The resultant plastic length and plastic deformation were mapped onto a strain–stress curve to determine the yield stress. Typical force–displacement and stress–strain curves obtained from the trabecular head bone sample are given in Figures 3 and 4, respectively. The noise ratio was approximately ±0.002 N. The initial region was characterized by a low stiffness of trabecular bone, which suggested that the architectural structure of the cancellous bone decreased by approximately 2%. In the second part, a linear trend was observed. The stiffness and elastic modulus were obtained in this region. An additional compressive increment force in the cancellous bone resulted in bone failure and the compression force decreased. The area under the force–displacement curve until yield point was defined as the strain energy, which was the energy required to cause the bone to start to deform plastically. The cancellous bone tissue architecture was organized so that the load was transmitted from one point to another, and the differences between the osteopenic and osteoporotic cancellous bones were assessed using their biomechanical strength values.

A typical displacement–force curve of the trabecular bone.

A typical stress–strain curve of the trabecular bone.
Statistical analysis
Statistical analysis was performed using PASW version 18.0 software (SPSS Inc., Chicago, Illinois, USA). The Kolmogorov–Smirnov test was used to analyse normally distributed data. Data were compared using the χ2 test, Mann–Whitney U-test and paired Student’s t-test, and Spearman’s correlation coefficient was used to analyse possible correlations. A p value of <0.05 was considered to be statistically significant.
Ethics statement
The study design and protocol were approved by the institutional review board of the Kayseri Training and Research Hospital (no.12.12.2014/25). Written informed consent was obtained from each patient.
Results
There was no significant difference in age, sex, height, weight and femoral head diameter between the groups (Table 1; p > 0.05).
Clinical characteristics of the osteopenic and osteoporotic patients.a
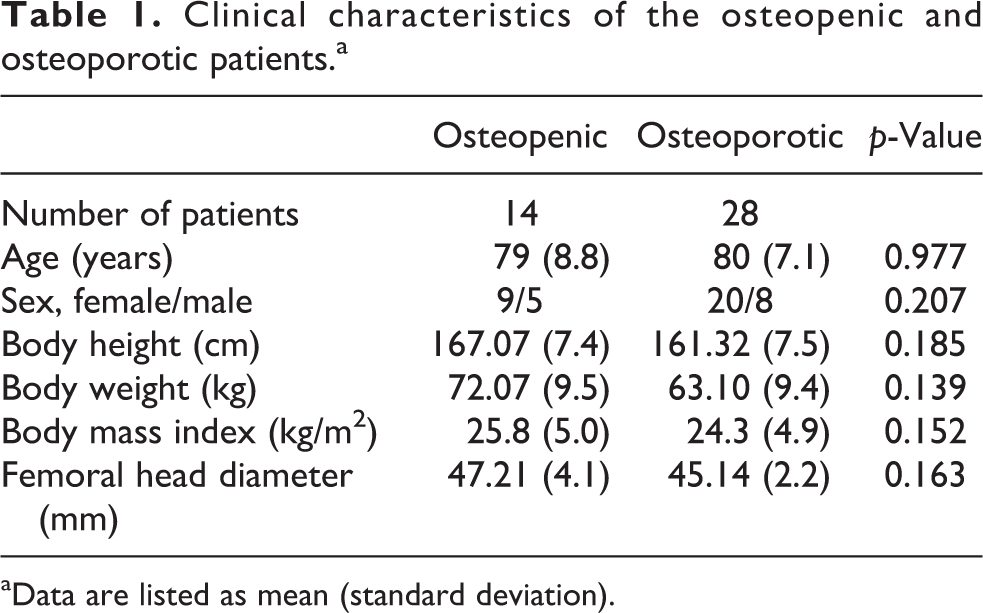
aData are listed as mean (standard deviation).
The mean neck BMDs of the osteopenic and osteoporotic groups were 0.78 g/cm2 (SD 0.08 g/cm2) and 0.54 g/cm2 (SD 0.09 g/cm2), respectively (p = 0.0001). The mean Ward’s triangle BMDs of the osteopenic and osteoporotic groups were 0.63 g/cm2 (SD 0.15 g/cm2) and 0.39 g/cm2 (SD 0.10 g/cm2), respectively (p
Densitometric data.a
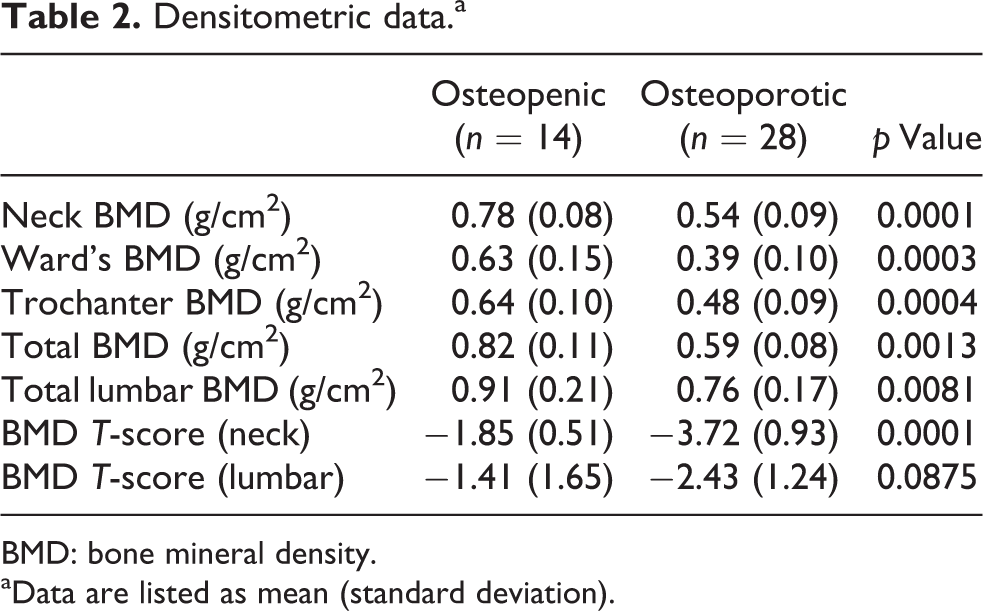
BMD: bone mineral density.
aData are listed as mean (standard deviation).
According to the compression test results, the yielding stress was significantly different between the osteopenic and osteoporotic groups (yielding stress: 2.94 MPa, SD 1.89 MPa vs. 1.94 MPa, SD 1.26 MPa, respectively; p = 0.048). For strain energy density, stiffness and Young’s modulus, there were no significant differences between the osteopenic and osteoporotic groups (strain energy density: 260.76 kJ/m3, SD 14.59 kJ/m3 vs. 179.5 kJ/m3, SD 11.17 kJ/m3, respectively, p = 0.321; stiffness: 1560.82 N/mm, SD 85.71 N/mm vs. 1328.99 N/mm, SD 72.8 N/mm, respectively, p = 0.349; Young’s modulus: 83.38 MPa, SD 4.76 MPa vs. 60.71 MPa, SD 3.37 MPa, respectively, p = 0.143). The mean maximum stress was significantly different between the osteopenic and osteoporotic groups (maximum stress: 4.56 MPa, SD 1.87 MPa vs. 3.03 MPa, SD 1.32 MPa, respectively, p = 0.017; Table 3).
Mechanical properties of cancellous bone in the femoral head of the principal compressive area determined by compression testing.a
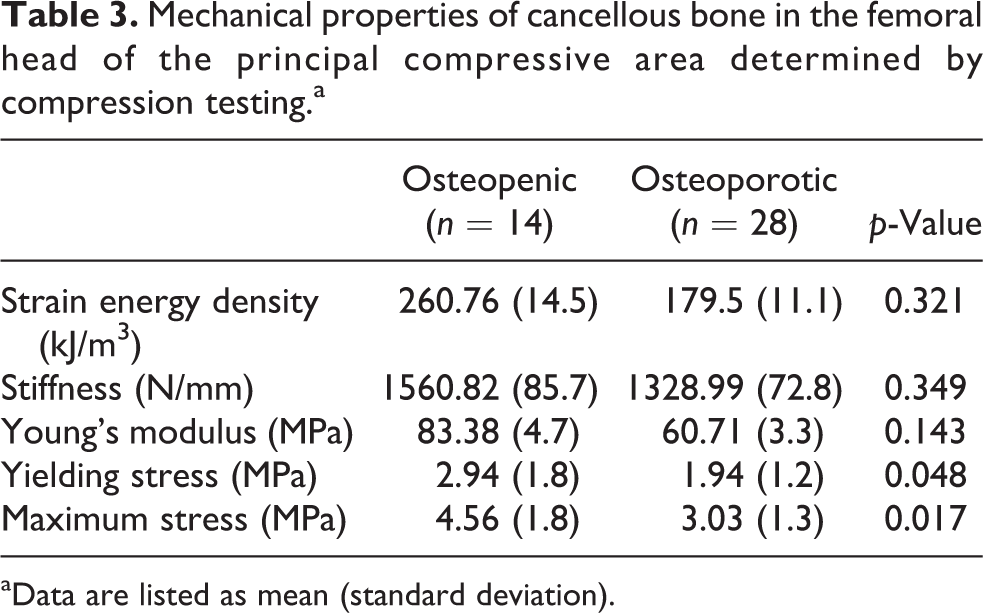
aData are listed as mean (standard deviation).
Although the structural parameters, including BV, BV/TV, Conn.D, Tb.N, Tb.Th, were higher in the osteopenic group, the differences were not significant between the two groups (p = 0.114, p = 0.111, p = 0.234, p = 0.3, p = 0.689, respectively). However, the Tb.Sp values were significantly higher in the osteoporotic patients than in the osteopenic patients (p = 0.003; Table 4).
Microarchitectural parameters in the osteopenic and osteoporotic groups.a

BV: bone volume; TV: total volume; Conn.D: connectivity density; Tb.N: trabecular number; Tb.Sp: trabecular separation; Tb.Th: trabecular thickness.
aData are listed as mean (standard deviation).
There were no significant correlations between BMD and Young’s modulus, yielding stress, maximum stress, BV/TV, Conn.D, Tb.N, Tb.Th and Tb.Sp in the osteoporotic group (Young’s modulus: r = 0.035, p = 0.941; yielding stress: r = 0.107, p = 0.819; maximum stress: r = –0.393, p = 0.383; BV/TV, r = 0.679, p = 0.094; Conn.D, r = –0.143, p = 0.760; Tb.N, r = –0.357, p = 0.432; Tb.Th, r = –0.036, p = 0.939; Tb.Sp, r = 0.500, p = 0.253).
Similarly, no significant correlations were found between BMD and Young’s modulus, yielding stress, maximum stress, BV/TV, Conn.D, Tb.N, Tb.Th and Tb.Sp in the osteopenic group (Young’s modulus: r = –0.396, p = 0.379; yielding stress: r = –0.450, p = 0.310; maximum stress: r = –0.432, p = 0.333; BV/TV: r = –0.342, p = 0.452; Conn.D: r = 0.001, p = 0.839; Tb.N: r = –0.234, p = 0.613; Tb.Th: r = –0.162, p = 0.728; Tb.Sp: r = –0.324, p = 0.478).
In addition, Young’s modulus and BV/TV were not significantly correlated in either group (osteopenic: r = 0.021, p = 0.964; osteoporotic: r = 0.036, p = 0.939).
Discussion
In this study, we compared the mechanical and microstructural characteristics of trabecular bone in hip fractures between osteopenic and osteoporotic patients. We did not observe significant differences in strain energy density, stiffness and Young’s modulus values between the groups in the compression test, whereas yielding stress and maximum stress values were significantly higher in the osteopenic group. Although the total BMD value was significantly higher in the osteopenic group, there was no significant difference in the BV/VT ratio between the groups, as assessed by micro-CT. We also did not observe any significant differences in the Conn.D, Tb.N and Tb.Th between the groups; however, Tb.Sp was significantly lower in the osteopenic group.
Recently, additional factors, such as cancellous microstructure, have gained importance in the aetiology of osteoporotic fractures. 5,11 Loss of trabecular connectivity of the bone increases the fracture risk in the elderly. The Tb.Th, number of trabecular elements and Tb.Sp as well as the connectivity of these structures may affect the mechanical behaviour of the cancellous structure. High connectivity in the microstructure of the bone and trabecular harmony through the load axis has been shown to produce higher stiffness and strength against loading. 5 Bone mass and its microstructure may be altered against mechanical loading. 5,8 Bone mass has been shown to increase with mechanical loading and physical activity, but it was reduced by immobilization. 8 Osteoporotic human bone samples have been shown to have lower bone fractions, Tb.Ths and less anisotropic structure than those of control samples. 5 Patients with osteoporosis may also suffer from cortical thinning, partial deformities of the lamella and trabecular density and integrity. 15
Furthermore, BMD measurements made by DXA only partially identified fracture risk because the majority of fragility fractures have been shown to occur in patients with osteopenia. 10,11,16 Therefore, bone density alone is not the major factor in bone strength or fracture risk; however, several factors, including bone turnover and bone architecture, contribute to a dynamic structural process. 6,11,17 Determinants of bone strength other than bone mass may contribute to bone fragility in these patients. Such determinants would include changes in the microarchitecture and material properties of bone. 10
Gül et al., 17 examined the cortical and trabecular bone samples obtained from osteopenic and osteoporotic patients using a scanning transmission electron microscope and found similar bone microarchitecture characteristics in the patient population. In another study using light microscopy, the lamellae were better preserved, and the Haversian canals were smoother in osteopenic patients than in osteoporotic patients, although both patient groups exhibited similar characteristics. 17 In addition, Malgo et al. 10 conducted a study using an in vivo microindentation technique and found no differences in bone material strength between osteopenic and osteoporotic patients with fragility fractures.
As typically seen in osteoporotic patients, patients with osteopenic fractures also have fragile bone structures. 3,7 Abnormal microarchitecture may increase the skeletal fragility and fracture susceptibility in osteopenic patients. It is not always possible to distinguish low-risk patients from high-risk patients using regional BMD measurements alone. 3 Bone density may not be a good predictor of bone because bone density distribution and several variables that influence bone turnover may be excluded from the measurement. 8 In the present study, results from DXA showed that BMD was higher in the osteopenic group than in the osteoporotic group. However, these results do not mean that the bone strength in the osteopenic patients was higher. We observed slight differences in a few mechanical and structural variables. Therefore, these findings suggest that regional bone density is a poor indicator of fracture risk in patients with distinct characteristics. Skeletal microarchitecture is also a critical determinant of bone strength and fracture susceptibility, irrespective of BMD measurements. 3,11,12,14 Moreover, osteopenic bone structure may vary according to its own structure. Boutroy et al. 18 compared microarchitecture in osteopenic women with and without fractures. They found that women with fractures of the radius had lower total, cortical and trabecular volumetric BMD, lower Tb.N and greater Tb.Sp and heterogeneity. In another study, Stein et al. 3 demonstrated several structural abnormalities in osteopenic women with fractures. The authors reported that women with fractures had a less axially aligned trabecular network and less trabecular connectivity as well as worse bone biomechanical properties.
Conclusion
This is the first study to determine whether osteopenic and osteoporotic patients with fractures show differences in trabecular morphology and biomechanical bone properties. There were no significant differences between the groups in terms of some parameters, although both the compression and micro-CT tests yielded higher values in the osteopenic patients than in the osteoporosis patients.
Footnotes
Declaration of conflicting interests
The author(s) declared no potential conflicts of interest with respect to the research, authorship, and/or publication of this article.
Funding
The author(s) received no financial support for the research, authorship, and/or publication of this article.