
Abstract
Purpose:
To assess the accuracy of total knee replacements (TKRs) performed using CT-based patient-specific instrumentation by postoperative CT scan.
Method:
Approval from the Ethics Committee was granted prior to commencement of this study. Fifty prospective and consecutive patients who had undergone TKR (Evolis, Medacta International) using CT-based patient-specific instrumentation (MY KNEE, Medacta International) were assessed postoperatively using a CT scan and the validated Perth protocol measurement technique. The hip-knee-ankle (HKA) angle of the lower limb in the coronal plane; the coronal, sagittal, and rotational orientation of the femoral component; and the coronal and sagittal orientation of the tibial component were measured. These results were then compared to each patient’s preoperative planning. The percentage of patients found to be less than or equal to 3° of planned alignment was calculated. One patient was excluded as the femoral cutting block did not fit the femur as predicted by planning and therefore underwent a conventional TKR.
Results:
Ninety-eight percent of patients were within 3° of planned alignment in the coronal plane reproducing the predicted HKA angle. Predicted coronal plane orientation of the tibial and femoral component was achieved in 100% and 96% of patients, respectively. The sagittal orientation of the femoral component was within 3° in 98% of patients. The planned sagittal positioning of the tibial component was achieved in 92% of patients. Furthermore, 90% of patients were found to have a femoral rotation within 3° of planning. Eighty-six percent of patients achieved good-to-excellent outcome at 12 months (Oxford Knee Score > 34).
Conclusion:
We have found that TKR using this patient-specific instrumentation accurately reproduces preoperative planning in all six of the parameters measured in this study.
Introduction
Traditionally, correct alignment is believed to be of importance in achieving a successful total knee replacement (TKR). 1 Accurate alignment of the axial and rotational planes, precise component placement and careful soft tissue balancing are all believed to contribute to good clinical outcomes and increased implant longevity for patients. 2 Moreover, malalignment (defined as a departure from the mechanical axis which is in excess of 3°) has been reported to be associated with premature component loosening, low functional scores, and patellofemoral problems. 3,4
Conventionally, TKR is performed using mechanical jigs to fix cutting blocks in place. 5 Intramedullary and/or extramedullary jigs can be used. 4 The accuracy of mechanical jig systems has been debated. 6 –8 Traditional alignment methods employing hand-guided techniques can often result in bone cutting errors. 9,10 It has been suggested that, to reduce the cutting errors observed in conventional TKR, instrumentation to allow increased stability for fixation of cutting blocks is required. 10
Computer-assisted (CA) TKR (using navigation) was developed and introduced in an effort to assist surgeons, purporting increased implant longevity, superior function, and improved alignment over conventional techniques. 4 CA-TKR has been shown to reduce malalignment by approximately one-third in comparison to conventional techniques. 11 However, although CA-TKR has been in use for over 10 years, opinion on the technique remains varied. 12 Many reports have criticized the increased operative time, elevated cost, and complications resulting from the use of guidance pins associated with this approach. 1,11
A relatively new method in TKR which utilizes patient-specific instrumentation (PSI) aims to bypass the shortcomings of both conventional and CA-TKR. 13 This technique adopts anatomical cutting blocks which are patient specific, facilitating accurate positioning of TKR components along with helping to guide the marking of bone prior to resection. 11 Some of the proposed benefits of PSI include increased accuracy of postoperative alignment, shorter recovery time, reduced postoperative pain, decreased tissue trauma, and lower incidence of infection. 11,12,14 –16 A consensus on the effectiveness of PSI technology has not yet been reached. Although some studies have reported improved accuracy of component positioning, 11 reduced incision length, 17 fewer blood transfusions, and shorter operating times, 18 others did not observe these advantages and found the technology inferior to conventional techniques. 19 –21 There appears to be a difference in performance of the PSI technologies adopted by various medical device companies. 22 Postoperative radiological assessment of this technology is also nonstandardized and often a combination of scanograms, scout images, and plain radiographs are used by different investigators and therefore direct comparison of these technologies is difficult.
Therefore, current evidence on PSI is inconclusive. As previously stated, a limitation of the existing evidence results from a lack of adequate radiological assessments of PSI in TKR. This study aims to address the paucity of literature in this area by performing a robust radiological assessment of alignment accuracies achieved by PSI, utilizing a validated scanning protocol. 4 This will provide, to our knowledge, the first independent evaluation of the MyKnee® PSI (Medacta International, Switzerland) using a validated CT scanning protocol.
Methods
This study was approved by the University of New South Wales ethics committee and registered on the Australian New Zealand Clinical Trial Registry. Written consent was obtained from all patients. Inclusion was based on patients having a primary diagnosis of osteoarthritis, being over 18 and clinically qualifying for TKR based on physical exam, radiological assessment, and clinical history. Patients with previous fracture of the knee or an osteotomy about the knee were excluded.
EQ-5D 3 L health outcome questionnaire and Oxford Knee Score (OKS) joint function questionnaire were collected from our study cohort preoperatively and at each postoperative follow-up appointment.
Between December 19, 2013 and September 10, 2014, 52 consecutive patients (53 knees) underwent TKR with the use of custom-made cutting blocks. One patient was excluded from the study as a result of previous high tibial osteotomy. One patient withdrew from the study for nonmedical reasons. One patient was excluded as the femoral cutting block did not fit the femur as predicted by planning and therefore underwent a conventional TKR. One patient had bilateral surgery. All cases were performed by one surgeon with the same cemented femoral and tibial prostheses used in all surgeries (EVOLIS, Medacta International). A total of 50 knees were therefore included in the study, 52% being on the right. Forty-nine percent of patients were male. The mean patient age was 65 years old. The average BMI for patients was 33.1. See Table 1.
Summary of patient demographic.
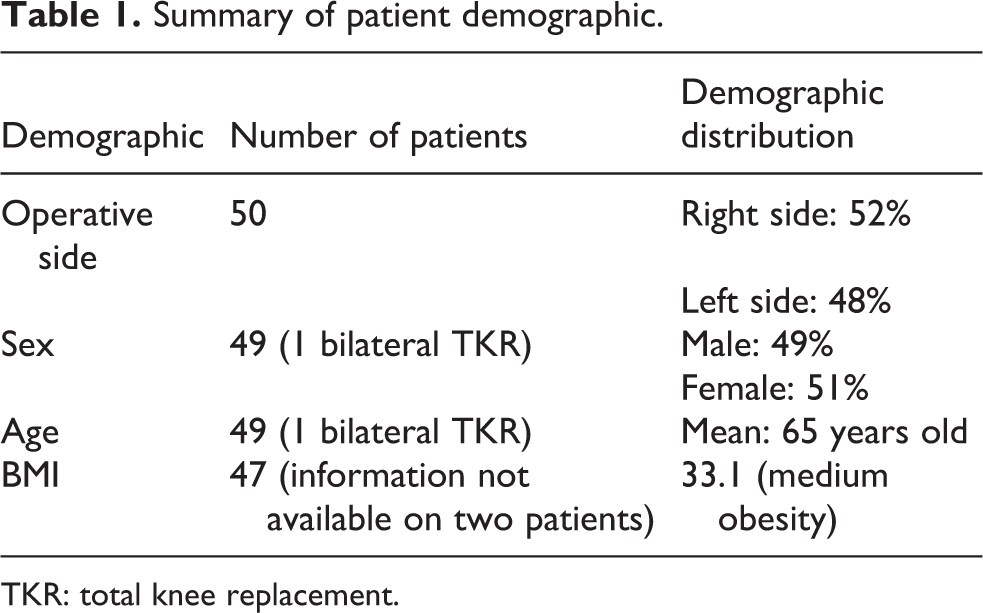
TKR: total knee replacement.
A preoperative CT scan of the knee along with scout images of the femoral head, neck, and ankle joints were obtained. The CT scan was performed with the patient supine and the knee maximally extended and unloaded. These data were used by the implant manufacturer (Medacta International, Switzerland) to create three-dimensional models of the knee.
The anatomical landmarks used for the preoperative planning included the hip center (the center of the sphere that best approximates the femoral head), femur center (center of the intercondylar notch corresponding to the most distal point of trochlea), tibial center (midpoint of a line between medial and lateral intercondylar eminances), and ankle center (center point of a line connecting the medial and lateral malleoli).
The tibial slope was measured on the medial tibial plateau referencing the sagittal mechanical axis. The tibial sagittal plane is defined by the mechanical axis and the axis perpendicular to the tangent to the posterior margins of the medial and lateral articular surfaces of the tibial plateau and passing from the tibial center. The varus/valgus orientation of the tibial base plate is referenced from the frontal mechanical axis.
The femoral flexion/extension angle is measured with reference to the sagittal mechanical axis of the femur. Femoral rotation is assessed with reference to the transepicondylar axis. In the absence of a prominent medial epicondyle, the center point of the medial sulcus is used. The component sizes are automatically proposed by the planning software.
The planning software proposes implantation of the components perpendicular to the mechanical axis of the femur and the anatomical axis of the tibia, 3° of flexion in the femoral component and rotation along the epicondylar axis. The tibial cut was devised to reproduce the posterior slope in each individual with a maximum set at 7°.
The cutting blocks were manufactured from polyamide PA 2200 which is a medical grade nylon, with contact points on the periphery of the joint, preferably in contact with osteophytes (see Figures 1 and 2). These are manufactured through laser sintering technology. The cutting blocks are supplied nonsterile but are sterilized in the same manner as metal instruments. 23
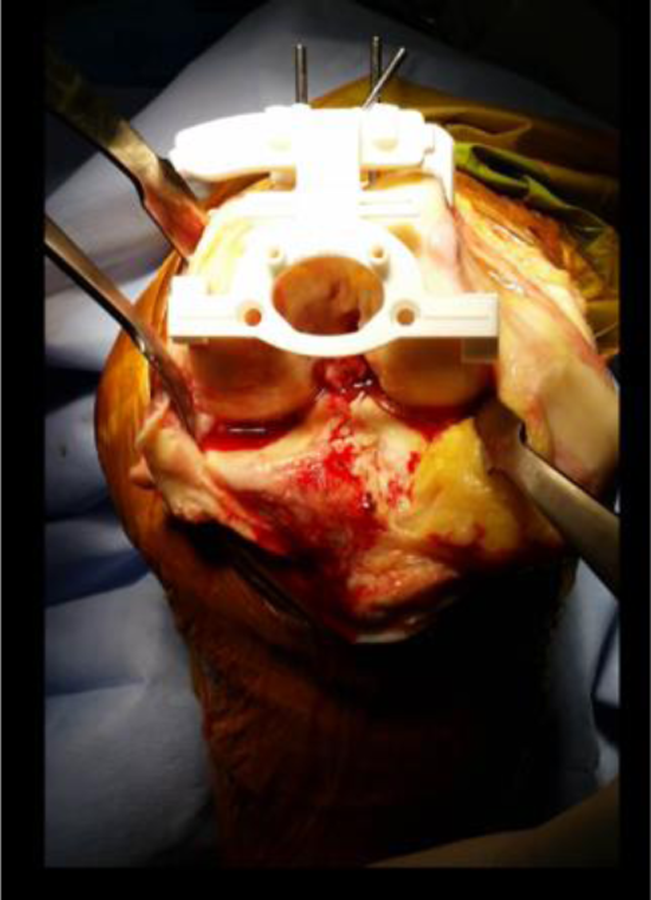
Image of the femoral Myknee cutting block secured with pins to distal femur. The points of contact are the medial and lateral margins of the distal anterior femoral condyles.

Tibial cutting block is applied to the anterior margin of the tibia. Contact occurs along three points and the block is secured with three pins.
Spinal anesthesia and sedation was used in the majority of cases unless contraindicated by coagulopathy or spinal pathology. A midline incision and a medial parapatellar approach were used. In patients with varus deformity, the medial release extended to the posteromedial corner of the tibia at the insertion of semimembranosus. No patients required extended medial release. In patients with valgus deformity, the medial release was kept to the thickness of planned tibial resection. Iliotibial band (ITB) was released from the tibia and the popliteous tenotomized. A lateral collateral release was not required in any cases. Posterior cruciate ligament (PCL) was preserved in all cases. The custom-made femoral and tibial cutting blocks were used to make the bony cuts. A measured resection technique was utilized. The patella was resurfaced with a standard milling guide in both groups. An inset patellar component was utilized in all cases. All components were cemented with antibiotic impregnated cement.
A validated CT scanning protocol was used to measure the HKA angle in the coronal plane, the coronal, sagittal, and rotational orientation of the femoral and tibial components. 4
The postoperative CT scan was performed with the patient supine and with the knee maximally extended and unloaded. The same radiographer performed both pre- and postop CT scans with the use of the same scanner. The protocol utilizes the center of the femoral head, distal femur, tibial plateau, and the ankle joint. These measurements are made in three planes and are linked dynamically using standard CT software.
The HKA is measured by using the mechanical axis of the femur and tibia. The coronal plane orientation of the components was measured by the line along the margin of the tibial and femoral prosthesis and finding the angles created by the intersection with the mechanical axis. The posterior flange of the femoral prosthesis was used to calculate the femoral component flexion/extension relative to the femoral axis. The relationship of the posterior condyles of the femoral component with the transepicondylar axis was used to measure the femoral rotation.
The tibial rotation (femorotibial mismatch) was calculated with the limb in maximal extension by superimposing an axial image of the femoral component onto an axial image of the stem of the tibial base plate. A line was drawn across the base of the femoral component. An intersecting line was drawn through the center of the stem of the base plate. From here, the angle was calculated.
The measurements were made by two independent radiographers. They were blinded to each other’s results. The mean values of the two assessors were calculated and used for the purpose of this study.
The results were then compared to each patient’s preoperative planning. As a free floating technique was used to establish the tibial component rotation, this parameter was recorded but not compared to preoperative planning.
The percentage of patients found to be within 3° or less of planned alignment was calculated.
Results
One patient was excluded as the femoral cutting block did not fit the femur as predicted by planning and therefore underwent a conventional TKR. Interobserver variation in the measurements was calculated. Correlations and bland Altman comparisons were carried out. The HKA correlation coefficient was 0.68 with Bland Altman 95% limits of agreement (LOA) from −1.8 to 1.9. The femoral varus/valgus correlation coefficient was 0.35 with Bland Altman 95% LOA from −3.3 to 3.4. The tibia varus/valgus correlation coefficient was 0.50 with Bland Altman 95% LOA from −2.4 to 3.0. The femoral component flexion correlation coefficient was 0.20 with Bland Altman 95% LOA from −6.2 to 3.6. The tibial slope correlation coefficient was 0.70 with Bland Altman 95% LOA from −2.9 to 3.0. The femoral rotation correlation coefficient was 0.69 with Bland Altman 95% LOA from −3.8 to 3.3. The tibial component rotation correlation coefficient was 0.75 with Bland Altman 95% LOA from −7.6 to 3.9.
Forty-nine of 50 (98%) patients were within 3° of preoperatively planned alignment in the coronal plane, accurately reproducing the predicted HKA angle (Table 2). Ten patients presented with preoperative valgus deformity (mean: 186°). Forty patients had varus deformity (mean: 174°). Overall 76% had HKA malalignment of greater than 3° preoperatively. Postoperatively, the mean HKA angle was 179 (range, 176–180). No patient was in valgus alignment postoperatively (Figure 3).
Percentage of patients within 3° of planned alignment.


Scatter plot illustrating HKA angle in the coronal plane, n = 50. Outliers (beyond ±3° of planned alignment) are in red. Negative values represent varus alignment. Zero values represent neutral alignment.
The flexion/extension of the femoral component was within 3° of preoperative planning in 98% of patients (49 of 50; see Figure 4).

Flexion/extension of the femoral component, n = 50. Outliers (beyond ±3° of planned alignment) are in red. Zero values represent planned alignment.
The planned posterior slope of the tibial base plate was achieved to within 3° of preoperative planning in 92% of patients (Figure 5). The mean preoperative tibial slope was 8°. The predicted preoperative planning tibial slope mean was 6°. The mean postoperative tibial slope was 5° (range, 2–9).

Diagram illustrating the posterior slope of the tibial base plate, n = 50. Outliers (beyond ±3° of planned alignment) are in red. Zero values represent planned slope.
Predicted coronal plane orientation of the tibial component was achieved in 100% of the cases. See Figure 6. The mean tibial component alignment in coronal plane was 1° of varus (range, −3–2). Fifty-six percent of patients had preoperative tibial coronal plane malalignment.

Diagram illustrating coronal plane orientation of the tibial component, n = 50. Positive values represent valgus alignment and negative values represent varus alignment. Zero values represent neutral alignment.
Femoral component coronal alignment was as predicted by planning in 96% of patients with a mean of 0 (range, −4–3; see Figure 7). Thirty-six percent of patients had femoral coronal plane malalignment preoperatively.

Diagram illustrating the positioning of the femoral component in the coronal plane, n = 50. Positive values represent valgus alignment and negative values represent varus alignment. Outliers (beyond ±3° of planned alignment) are in red. Zero values represent neutral alignment.
The angle between transepicondylar axis and the posterior condyles of the femoral component was used to measure the rotation of the femoral component. Three degrees or less was considered acceptable. The mean femoral component rotation was 1° (range, −5–6). Forty-five of 50 patients had a femoral rotation within 3° of planning (90%; see Figure 8).

Figure showing rotation of the femoral component in the coronal plane, n = 50. Outliers (rotation beyond ±3°) are represented in red. Positive values represent external component rotation. Negative values represent internal rotation of the component.
A mean value of 6° was obtained with values ranging from 1° to 15° for tibial component rotation in relation to the femoral component (see Figure 9).

Figure showing rotation of the tibial component relative to the femoral component, n = 50.
Twelve-month follow-up scores were obtained from 45 of the total of 50 surgeries. Patients lost to follow-up were within acceptable limits (<20%). 24,25 Respondents completed a self-rated health appraisal as part of the EQ5D questionnaire. They marked a vertical, visual analogue scale (EQ VAS) from 0 to 100, rating their health from worst to best imaginable. Preoperatively, the mean EQ VAS of the cohort was 53. This rose to 81 at 12 months postop. An improvement in OKS of three to five points is considered clinically important; 26 98% of patients’ OKS improved by at least three to five points from preop to 12-month postop follow-up, with an average improvement in OKS from preop to 12-month postop of 21 points. Eighty-six percent of patients achieved good-to-excellent outcome at 12 months (OKS > 34).
Discussion
Introduction of new technology in a competitive commercial market such as that of joint replacement arthroplasty raises a number of issues about the safety, efficacy, and commercial consideration of the technology.
First and foremost the new technology must cause no harm to our patients and provide a measurable improvement in their outcomes. These outcomes may be radiological, clinical, or ideally both.
The commercial considerations relate to any perceived monetary savings or a favorable cost effectiveness analysis.
Analyses of the potential savings associated with PSI technology have yielded varying results. One study found savings of 58.15 USD per tray were made due to fewer instrument requirements while others found that the cost of preoperative CT scan and cutting guides for PSI overwhelmed any potential savings. 14,22,27 However, costs associated with this technology are variable. In the case of the system utilized in this study, any additional costs associated with the manufacture of cutting blocks are borne by the manufacturer, leaving the patient with no additional out of pocket expenses when compared to conventional TKA.
A number of studies have underscored the importance of neutral alignment in successful TKR. There is general agreement that deviations beyond 3° from neutral reduce implant survivorship. 28 –32 In our study, a HKA angle within 3° of neutral was achieved in 48 of 50 knees (96%). In a study by Noble et al. comparing MRI generated PSI with conventional TKR using full length Anteroposterior (AP) radiographs, a mean HKA angle of 1.7° in the PSI group and 2.8° in the conventional cohort was reported. 17 Similar to this study, we had a postoperative mean HKA of 1.3°.
In a prospective randomized study looking at MRI PSI systems and conventional TKR, the number of outliers in both groups was found to be similar with 31% in PSI and 23% in the conventional group. 14 The number of outliers in our study that deviated beyond 3° of preoperative planning for the HKA angle was just 4%.
Femoral rotation was found to be within 3° of planning in 94% of patients in our study. This is similar to a recent paper by Moonpanar et al. looking at MRI generated PSI, in which 96.2% of patients were within 3° of neutral alignment. 33
A retrospective study by Ng et al. found outliers for component alignment to be similar in both MRI generated PSI and conventional TKR. 11 They found 10% tibial component outliers and 22% femoral component outliers with PSI compared to 7% outliers in tibial component and 18% femoral component outliers when using manual instrumentation. A randomised controlled trial (RCT) including 128 patients comparing MRI-based PSI and conventional instrumentation by Victor et al. found tibial component outliers using manual instrumentation to be as low as 3%; however, the femoral component outliers in the conventional group were as high as 28%. 34 They used a combination of MRI, CT, and radiographs in their analysis of the groups.
Our study has shown less outliers using PSI for both tibial and femoral components compared to above-mentioned studies. We found only 4% femoral component outliers and no tibial component outliers in coronal plane. These results are closer to the accuracy observed in CA surgery 35 (5% tibial, 10% femoral outliers). Satisfactory tibial slope alignment was achieved in 90% of the knees in our study.
Similarly, a study by Helmy et al. found satisfactory tibial slope alignment in 83% of patients using the same PSI system as ours. 36 This study considered a difference between preop and postop tibial slope of 3° or less to be a satisfactory result. In another study, a tibial slope accuracy of 76.6% was achieved. 32 In this case, a slope between 0° and 7° was considered satisfactory whereas our aim was a slope within 3° of preop planning, which was individualized.
It therefore appears that our results compare favorably to available literature and provide an improvement on historical results with standard instrumentation where mechanical axis outliers have reached 25% in some instances. 31,32
We believe a combination of factors result in the high degree of accuracy achieved with this system. The technology is CT based and bony landmarks are easier to identify than MRI-based systems. The surgeon deals with a dedicated engineer who is aware of the surgeon’s preferences and this reduces the risk of error in proposing component placement. The cutting blocks have a minimum of three contact points onto osteophytes or bony landmarks which are marked out on the 3D printed model. This allows accurate placement of blocks which are then fixed with three pins. Usually minimal soft tissue removal is required which adds to the ease and accuracy of placement. The blocks also act as cutting guides and are not merely pin positioners. Our results are mirrored by other authors such as Helmy et al. who also use this particular technology. 36
It is unclear if this radiological improvement will lead to a long term improvement in clinical outcomes. Somewhat counter intuitively a number of studies have questioned the evidence for a coronal “safe zone.” It has been reported in the past that patients whose knees were considered malaligned did not display inferior implant survivorship to those whose knees were aligned to within 3° of neutral. 11,37,38
Nevertheless, accurate implantation of components remains the aim of TKR surgery.
The variability in reported radiological outcomes in literature relates partly to inherent differences in PSI systems as well as nonstandardized measurement techniques.
Cavaignac et al. performed a comprehensive meta-analysis of literature pertaining to the use of PSI when compared to standard instrumentation. 39 Although they found no improvement in radiological outcomes, they conceded that most studies were of poor methodology and used a variety of measurement techniques, which made direct comparison difficult. Often sophisticated CT- or MRI-based measurement techniques and software are used for preoperative planning and manufacturing of instrumentation. However postoperative measurements are often crude and limited to long limb X-rays. Our findings of 86% achieving good-to-excellent outcome at 12 months (OKS > 34) with PSI are favorable when compared to 71% achieving a score of >34 in previous conventional TKR cohorts at 12-month postop. 40
We have utilized a previously validated CT protocol as well as two independent assessors to increase the reliability of our results.
A concern raised by Hananouchi has been the potential effect of PSI on soft tissue balancing in the setting of a cruciate sacrificing TKR. 41 He reported a mean imbalance of 7 mm between the flexion and extension gaps despite no outliers in alignment in his series, The flexion gap being always larger. We believe his findings relate to the methodology used to size the femur. The femoral size was decided by the radius of the femoral component that best approximated to the distal border of the lateral femoral condyle with the center of the prosthesis along the transepicondylar axis. Not surprisingly, the posterior femoral cuts which determine the flexion gap would vary widely depending on the flexion/extension of the femoral component and its position relative to the anterior cortex of the femur. In our series we implemented a measured resection technique where the difference between the distal and posterior femoral cuts from the preserved condyle was within 2 mm. We have not encountered flexion extension gap mismatch as a problem in our series.
The natural progression from PSI is implantation of patient-specific components. Demange et al. reported on implantation of lateral compartment unicompartmental knee replacement. 42 They found improved bone coverage and less overhang of components as well as better prosthesis survival in the short term with patient-specific components and instruments when compared to standard instrumentation.
Strengths of this study include the fact that it is, to our knowledge the first analysis which has utilized a full validated CT scanning protocol for this PSI system. It was a prospective study and two independent CT assessors were used to measure the alignment of all patients. There are also a number of limitations. The sample size was small at 50 patients; however, we had concerns about unnecessary radiation exposure and felt that this number would provide a valid indication of the efficacy of this method. Furthermore, we did not include operative time, length of stay, or blood loss. The aim of this study was simply an accurate radiological assessment. As this was not a comparative study, there was no control group. However, it may have been interesting to compare our results to a cohort of conventional TKAs performed by the same surgeon. Once again ethical considerations with respect to radiation exposure limited this possibility.
Conclusion
This study was designed to assess the accuracy of PSI in TKR. We have found that with this PSI system, preoperative planning measurements can be reproduced with a high degree of accuracy with 86% of patients achieving good-to-excellent outcome at 12 months (OKS > 34) postop. Further larger studies to include implant longevity will be needed to confirm the clinical advantages and benefit of this technology. All procedures performed in this study involving human participants were in accordance with the ethical standards of the institutional, national research committee and with the 1964 Helsinki declaration and its later amendments or comparable ethical standards.
Footnotes
Authors’ note
IRB information: This trial was registered in the Australian New Zealand Clinical Trials Registry (ACTRN12613000936729). Ethics approval was granted by the Human Research Ethics Committee at University of New South Wales (HREC Ref: # HC13273).
Declaration of conflicting interests
The authors declared no potential conflicts of interest with respect to the research, authorship, and/or publication of this article.
Funding
The authors disclosed receipt of the following financial support for the research, authorship, and/or publication of this article: Arash Nabavi received a research grant to conduct this study from Medacta Orthopaedics.