
Abstract
Objective:
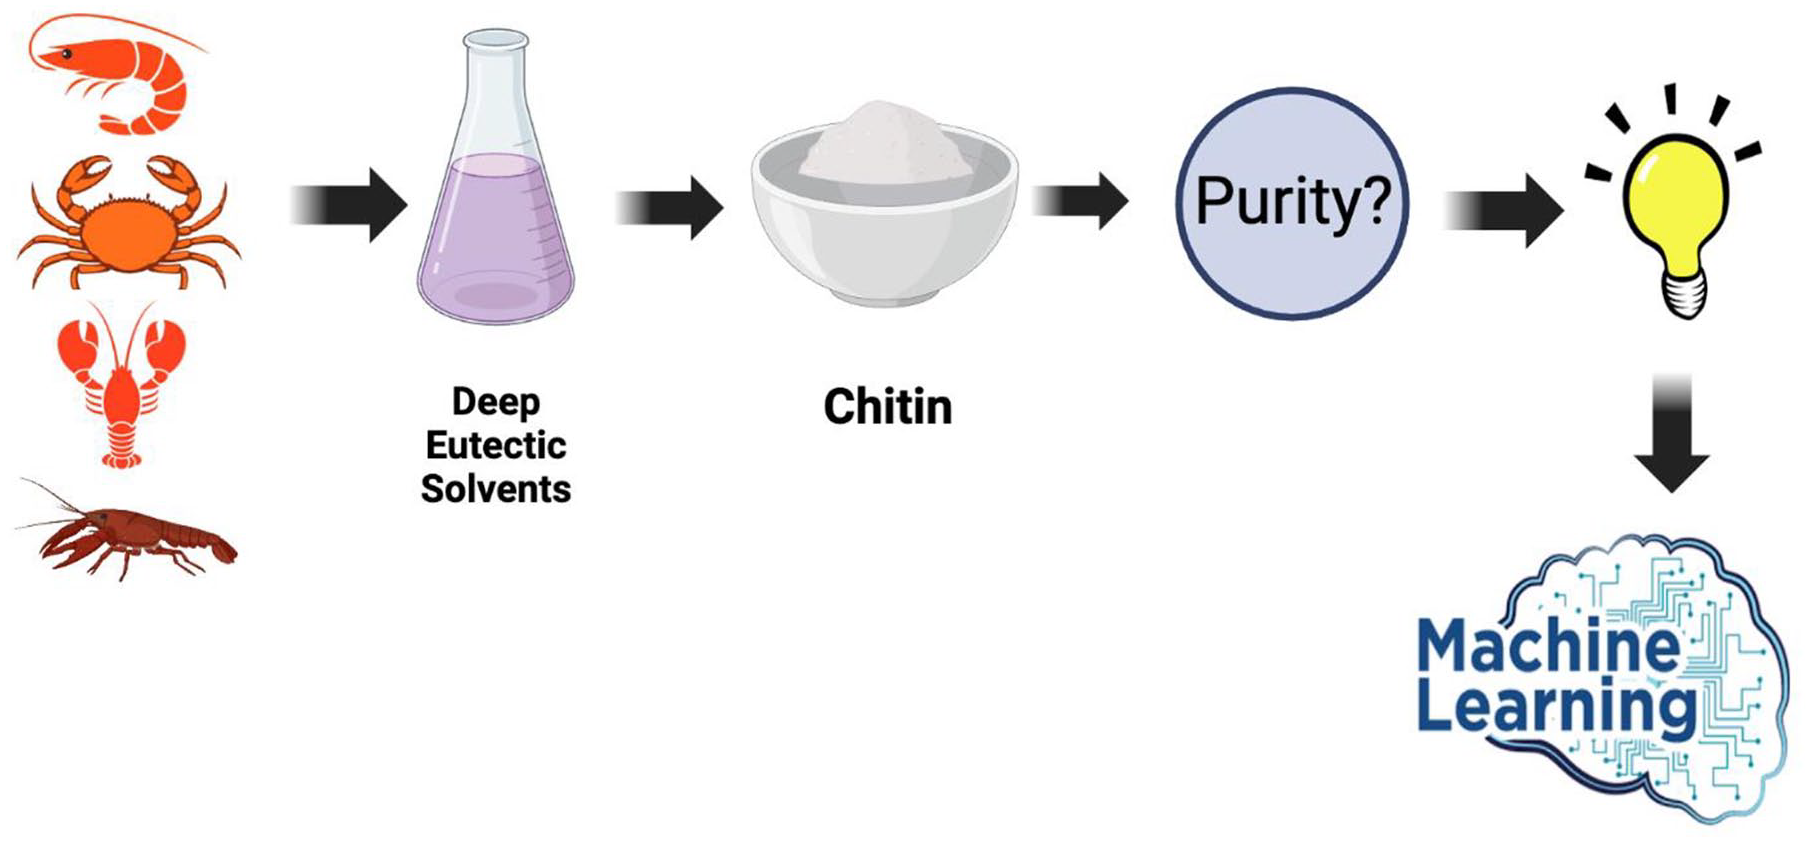
Chitin a natural polymer is abundant in several sources such as shells of crustaceans, mollusks, insects, and fungi. Several possible attempts have been made to recover chitin because of its importance in biomedical applications in various forms such as hydrogel, nanoparticles, nanosheets, nanowires, etc. Among them, deep eutectic solvents have gained much consideration because of their eco-friendly and recyclable nature. However, several factors need to be addressed to obtain a pure form of chitin with a high yield. The development of an innovative system for the production of quality chitin is of prime importance and is still challenging.
Methods:
The present study intended to develop a novel and robust approach to investigate chitin purity from various crustacean shell wastes using deep eutectic solvents. This investigation will assist in envisaging the important influencing parameters to obtain a pure form of chitin via a machine learning approach. Different machine learning algorithms have been proposed to model chitin purity by considering the enormous experimental dataset retrieved from previously conducted experiments. Several input variables have been selected to assess chitin purity as the output variable.
Results:
The statistical criteria of the proposed model have been critically investigated and it was observed that the results indicate XGBoost has the maximum predictive accuracy of 0.95 compared with other selected models. The RMSE and MAE values were also minimal in the XGBoost model. In addition, it revealed better input variables to obtain pure chitin with minimal processing time.
Conclusion:
This study validates that machine learning paves the way for complex problems with substantial datasets and can be an inexpensive and time-saving model for analyzing chitin purity from crustacean shells.
Introduction
Chitin is considered the second most prominent natural polymer after cellulose and finds its importance as a value-added product in its derivative form as chitosan in diverse fields owing to its physiochemical properties such as biodegradability, non-toxicity, biocompatibility, and physiological actions. 1 Chitin is the major element in the exoskeletons of crustaceans such as shrimp, krill, crab, crayfish, lobster, prawns, etc. along with minerals and proteins and exists in α forms which are hard and highly crystalline and are the most stable form. 2 Besides chitin also exists in β form in squid pens, 3 certain insects, mushrooms, 4 and a few fungal cell walls, 5 mollusks and algae, and ɣ forms in a few insects, fungi, and yeasts, and cuttlefish bones.6–8 Chitin consists of repeat units of N-acetyl-D-glucosamine that are connected by β (1→4) bonds. Chitin polymer chains are usually linked by hydrogen bonding enabling it strong which limits its solubility in aqueous and organic solvents 9 and restricts its industrial applications too. Meager solubility and lesser reactivity pose challenging tasks for chitin-based applications. 10
Removal of acetyl groups from the acetyl-D-glucosamine units of chitin results in the formation of chitosan, whenever the deacetylation degree is partial (at least 50%) or complete. 11 Chitosan has quite a solubility in acidic solvents, especially acetic acid, and possesses enhanced reactivity. Generally, deacetylation is achieved via chemical 12 or enzymatic means 13 and makes the polymer chitin as chitosan with huge potential uses such as wound healing, wastewater treatment, tissue engineering, cosmetics, drug delivery, food, gene therapy, and many others.14–16 Chitin extraction techniques and their usability in various fields are schematically represented in Figure 1.
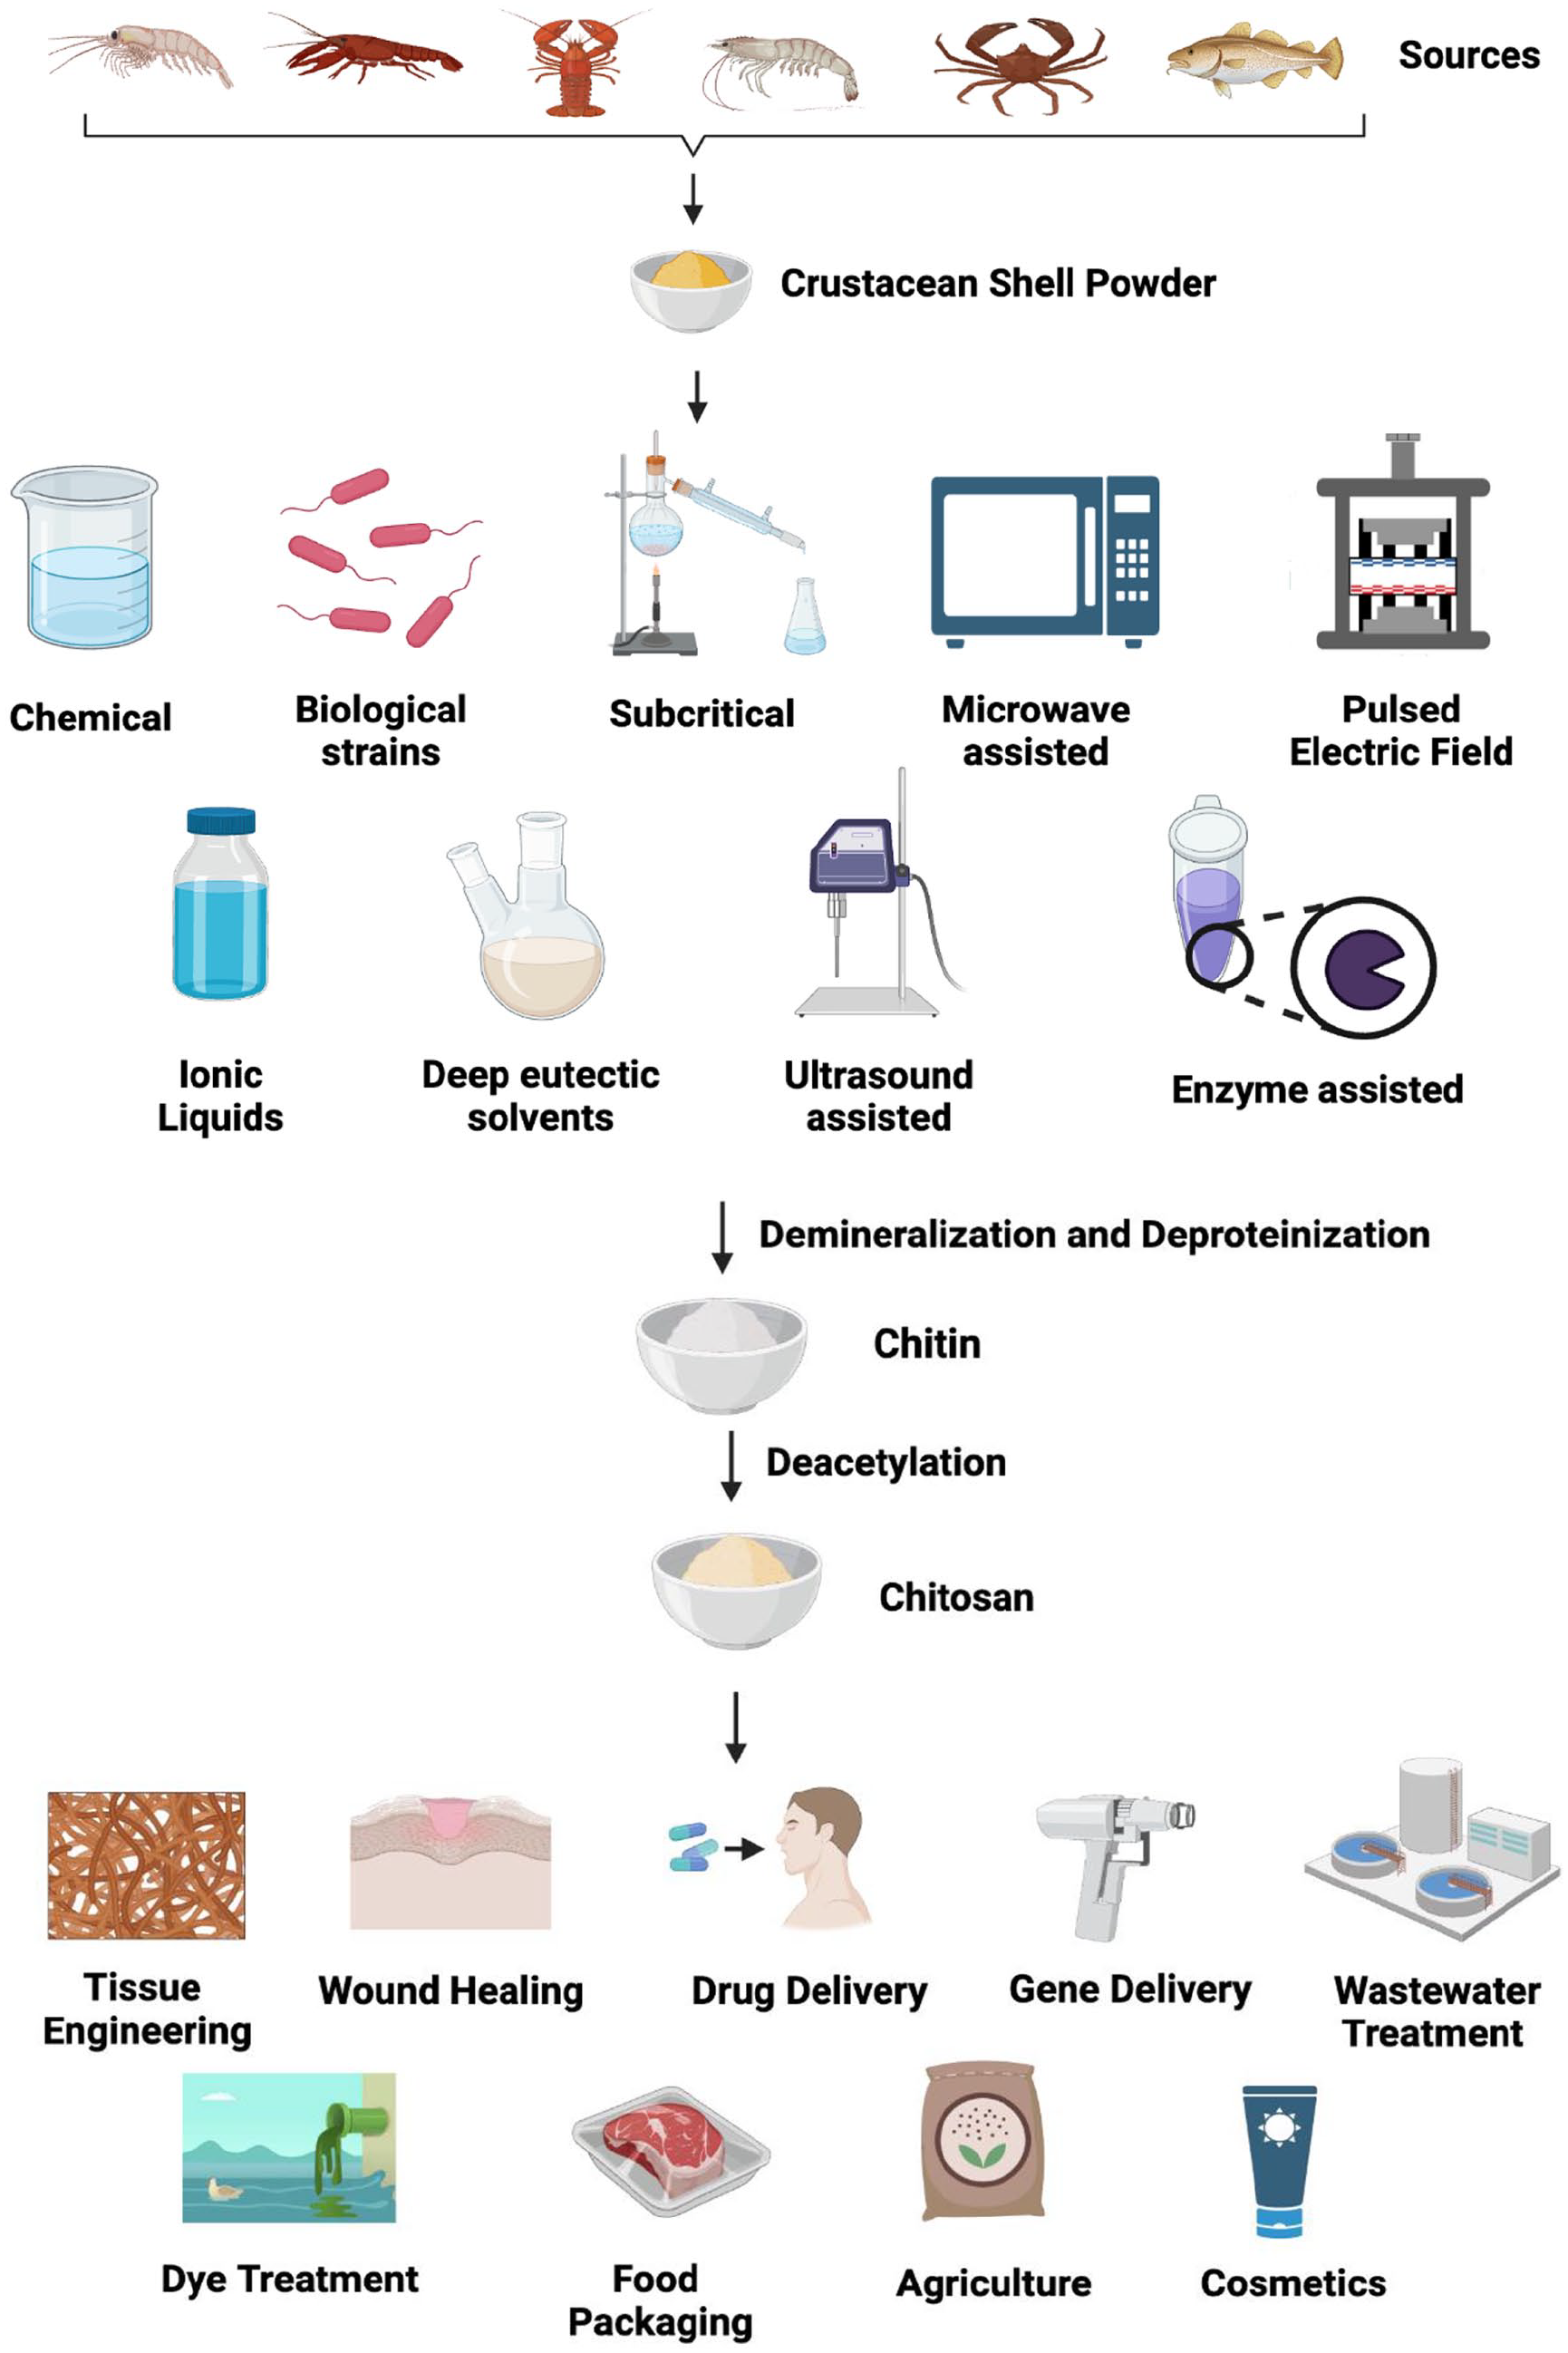
Processes involved in chitin extraction and its application in various fields.
Due to its widespread availability and importance in diverse fields, chitin extraction from various sources has been practiced for many years to bring it to the market for commercial needs. Yet, some critical aspects hamper the chitin production and exploitation. Extraction of chitin from various sources and dissolution of chitin are the prime factors that hinder its application in several fields. 17 A thorough investigation is essential to understand the mechanism of extraction of chitin to make it easily accessible. Several approaches have been tried by many scientists for several years to extract chitin from several sources with high purity. It includes chemical,18,19 biological, 20 enzymatic, 21 ultrasound-assisted, 22 microwave, 23 the pulsed electric field, 24 subcritical, 25 electrochemical, 26 ionic liquids, and deep eutectic solvents. 27
Conventional chemical extraction strategy mainly focuses on demineralization and deproteinization steps to remove minerals and proteins and to recover chitin. However, the use of harsh chemicals such as acids and alkali leads to severe environmental pollution.28,29 Even though it is commercially accepted, the process is time-consuming and uneconomical, and hence alternate strategy is vital. 28 To overcome this, biological and enzymatic approaches have been instigated with the use of biological strains and enzymes for the elimination of proteins and minerals. 30 Although it is environmentally friendly, the process utilizes expensive enzymes and biological strains which delays the extraction process and is time-consuming, and it is not yet practiced for large-scale production.
To enhance the extraction process, improve the product quality and yield, and reduce the processing time, alternative greener approaches such as microwave-assisted, ultrasonication subcritical, pulsed electric field, and electrochemical methods have been preferred to extract the chitin from different sources. 31 Although these strategies have the efficacy in extracting the chitin and eliminating the residual impurities they cannot be scaled up to an industrial scale. In addition a class of natural solvents with low melting points (<100℃) called ionic liquids came into existence for the separation of chitin. However high viscosity, moisture sensitivity and impossibility in recycling, difficulty in synthesis hamper ionic liquids in the production of chitin. 32
By considering the critical factors and drawbacks associated with other approaches, the need for innovative solvents with mild, improved efficiency, simplicity, and cost-effectiveness is very important. To increase the chitin quality and yield, and to reduce the processing time and environmental pollution, researchers exploit the use of novel greener extraction techniques. To be specific, Deep Eutectic Solvents (DES) replaced the usage of conventional solvents and helped in the recovery of chitin in a single step. DES has gained much attention in recent years because of its physicochemical properties. DES is considered a green solvent because it is eco-friendly, recyclable, reusable, non-toxicity, low cost, easily available, biodegradable, and economical.27,33–35 DES comprises of hydrogen bond acceptor and hydrogen bond donor which can form new hydrogen bonding with chitin thereby recovering it and eliminating proteins and minerals. The type of hydrogen bond donor and hydrogen bond acceptor, and its molar ratio, incubation time, and temperature are the major influencing parameters in deciding the purity and yield of chitin.
Deep eutectic solvents have gained attention as new green solvents for chitin extraction in recent years by lots of researchers. In addition, deep eutectic solvents have been utilized for other purposes to enhance the performance of the existing system. Metal-organic frameworks using deep eutectic solvents have been synthesized for the extraction of valuable compounds from a wide variety of systems. For example, Choline chloride-urea-based deep eutectic solvents act as metal-organic frameworks for the solid phase extraction of imidacloprid in tea infusions and water samples. 36 Similarly, another study uses a deep eutectic solvents based metal-organic framework for the extraction of Rhodamine 6G in water and cosmetic products. 37 Deep eutectic and natural deep eutectic solvents are used as adsorbents in environmental analysis. 38 In recent days, they have been utilized as solvent systems for protein extraction and purification. 39 Because of their high conductive ability, it is preferred for gas solubilization 40 and electrochemical applications. 41 Furthermore, therapeutic deep eutectic solvents find their application in health and medicine in different aspects.
The method of extraction and the use of solvents affects the yield of chitin and subsequently chitin purity which is of prime importance in biomedical applications. The presence of residual proteins, minerals, and other pigments limits its applications in diverse fields. As far as purity is concerned, the need for a novel approach to obtain pure chitin is essential. To minimize the cost and to reduce the time accompanying laboratory experiments, the urge for innovative practical tools to predict the process parameters involved in pure chitin extraction is crucial. Currently, machine learning algorithms are being utilized in many areas due to their versatile nature, and outstanding performance with tolerable accuracy and credibility.42-48
Machine Learning (ML) is a prominent technique that tries to devise relations between input and output parameters via numerical calculations and iterations. Machine learning helps to understand the influential parameters and process conditions associated with product development and allows the readers to get insight into the relationship between the parameters. 49 Different ML algorithms have been implemented in the present study, to assess the chitin purity from crustacean sources. So far ML-based models have not previously been reported for chitin purity investigation using deep eutectic solvents. The novelty of this study includes the use of powerful models for managing a comprehensive dataset. Several input variables such as the nature of the source, hydrogen bond acceptor (HBA), hydrogen bond donor (HBD), molar ratio of HBA/HBD, shell and solvent ratio, incubation time, and temperature, have been critically assessed to monitor the output variable purity with the help of prevailing ML models like random forest, extreme gradient boost (XGBoost), decision tree, gradient boost, support vector regressor (SVR), AdaBoost, linear regression, ridge and lasso regression.
Implementation of machine learning as a cutting-edge algorithm for chitin purity analysis from crustacean shells was employed with the aim of (i) developing prevalent machine learning models to predict the chitin purity using deep eutectic solvents, under ambient conditions and (ii) examining the crucial factors involved in chitin purity (iii) to create a handy virtual based user interface for researchers. The machine learning model developed in this study lays the foundations of a strong hypothetical basis to examine the purity of chitin.
Model development
Data collection and variables selection
A substantial dataset comprised of 187 experimental data for chitin extraction via deep eutectic solvents was collected with the help of evident literature as mentioned in the Supplemental file (Table 1). The major process parameters involved in chitin extraction include the nature of the Crustacean shell, Hydrogen Bond Donor (HBD), Hydrogen Bond Acceptor (HBA), HBA/HBD molar ratio, shell solvent ratio, temperature (℃), and incubation time (h). By considering that, these parameters were used as inputs for the models employed in the present study. Similarly, chitin purity is considered as the output parameter for the selected models.
Data pre-processing
Statistical analysis for the collected dataset concerning standard deviation, mean, minimum value, 25%, 50%, 75%, and maximum value of all the input features was performed. Similarly, the correlation between the selected variables (i.e., either positive or negative) was accomplished by Pearson’s correlation matrix using the following equation (equation (1)).
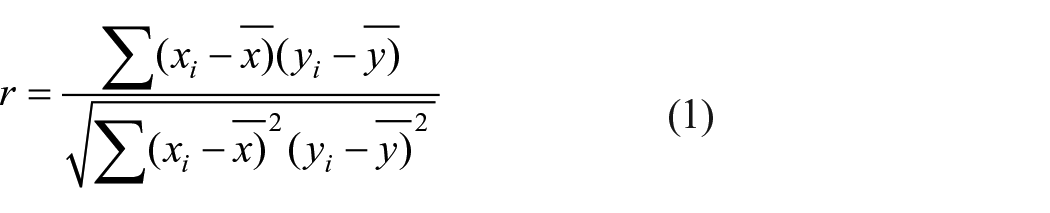
Investigation of the correlation among the inputs will reveal the major input parameters in a strong relationship in determining the output variable. In addition, Exploratory Data Analysis (EDA), was achieved with the visual representation of a pairplot, since it finds the relationship between the variables in bivariate distribution. In addition, outlier detection was also performed to get an insight into the parameters considered for the study.
Models utilized
In this current study, different machine learning algorithms such as random forest, gradient boost, extreme gradient boost, decision tree, support vector regressor, AdaBoost, linear regression, ridge, and lasso were used as models to train the data.
Python, software was chosen for the modeling process and the selected models were trained using 70% of the dataset called the training subset. Similarly, the model was evaluated using 30% of the remaining dataset called the test subset. Machine Learning codes used in this current study were obtained from the Scikit-learn Library.
Theory of the utilized models
Random forest algorithm
Random forest works on bagging supervised learning techniques by considering CART (Classification and Regression Trees).
50
The model is based on ensemble learning which possesses multiple classifiers to derive an output and hence improve the model performance. Random forest contains a lot of decision trees on several subsets of the specified dataset and considers the average to increase the accuracy and model prediction. Final output derived as a result of majority voting of each decision tree. Advantages include lesser training time when compared with other algorithms and it calculates the output with better accuracy even for huge datasets. The training dataset is assumed as D, with n number of observations,
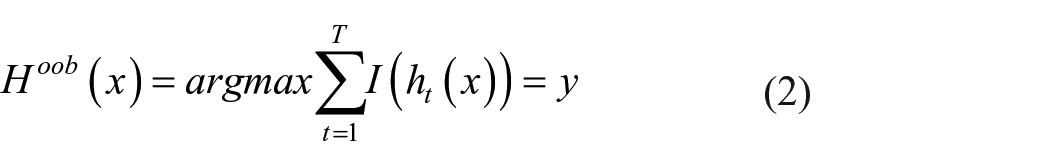
The out of the bag (OOB) learning error can be represented as
Since the process is random, the features are controlled by parameter
where
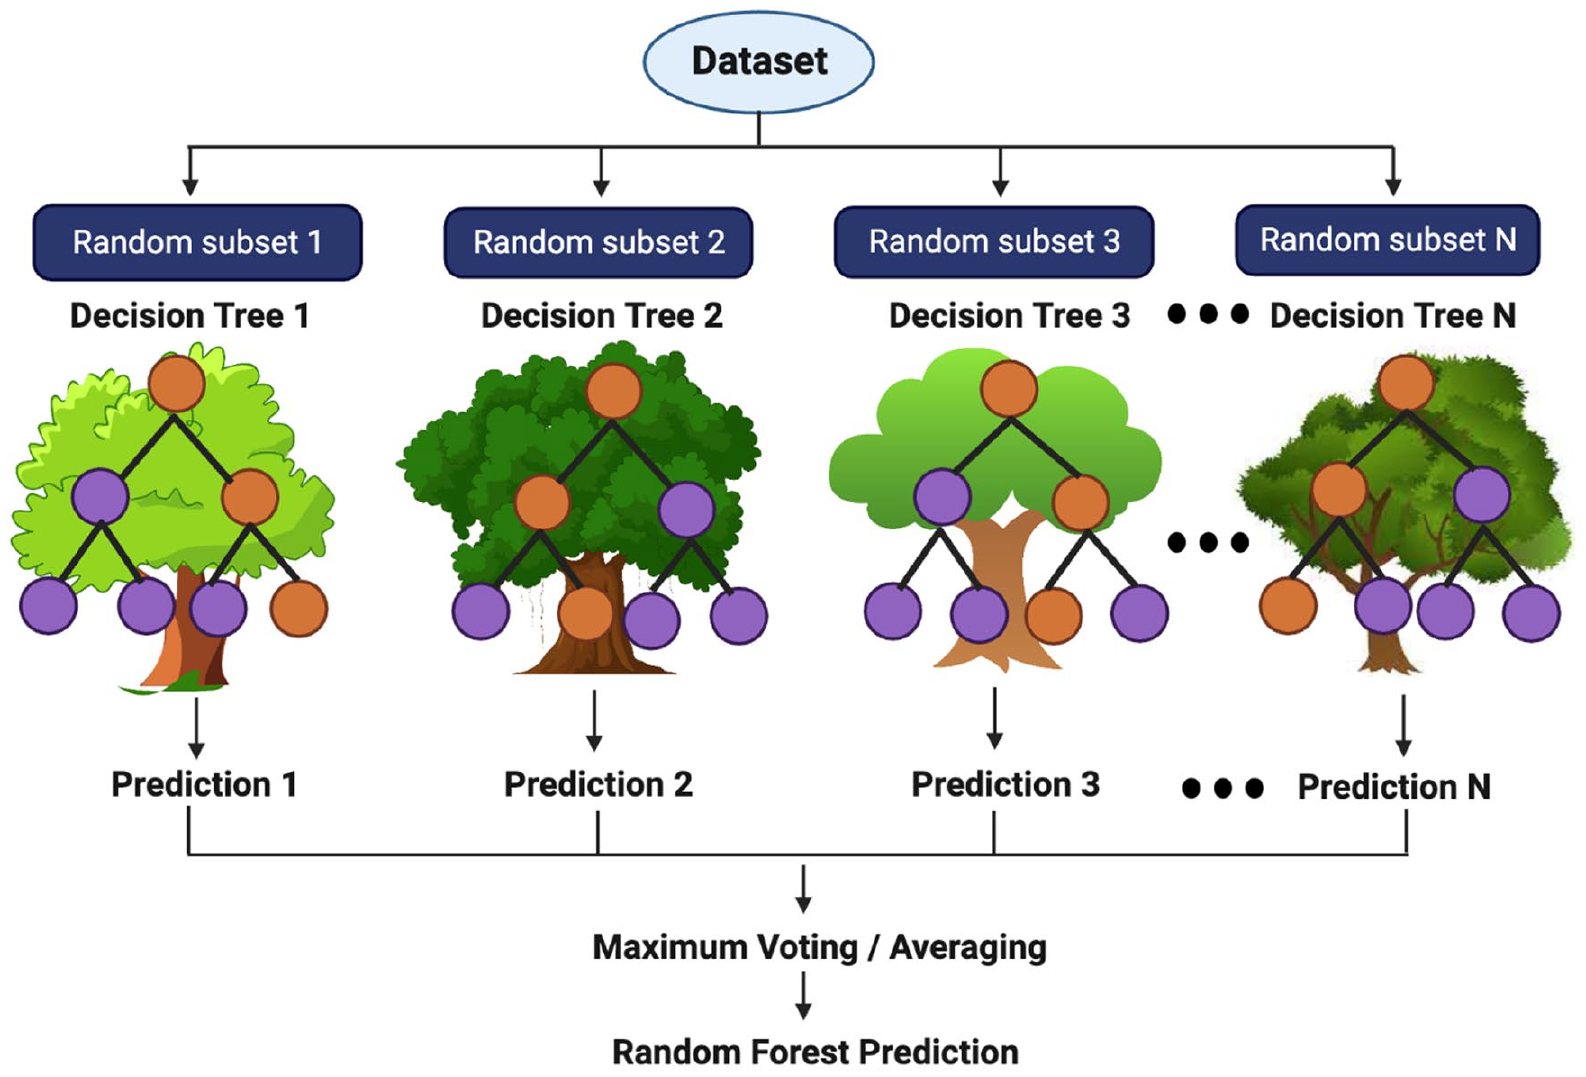
Prediction model in random forest algorithm.
Extreme gradient boost
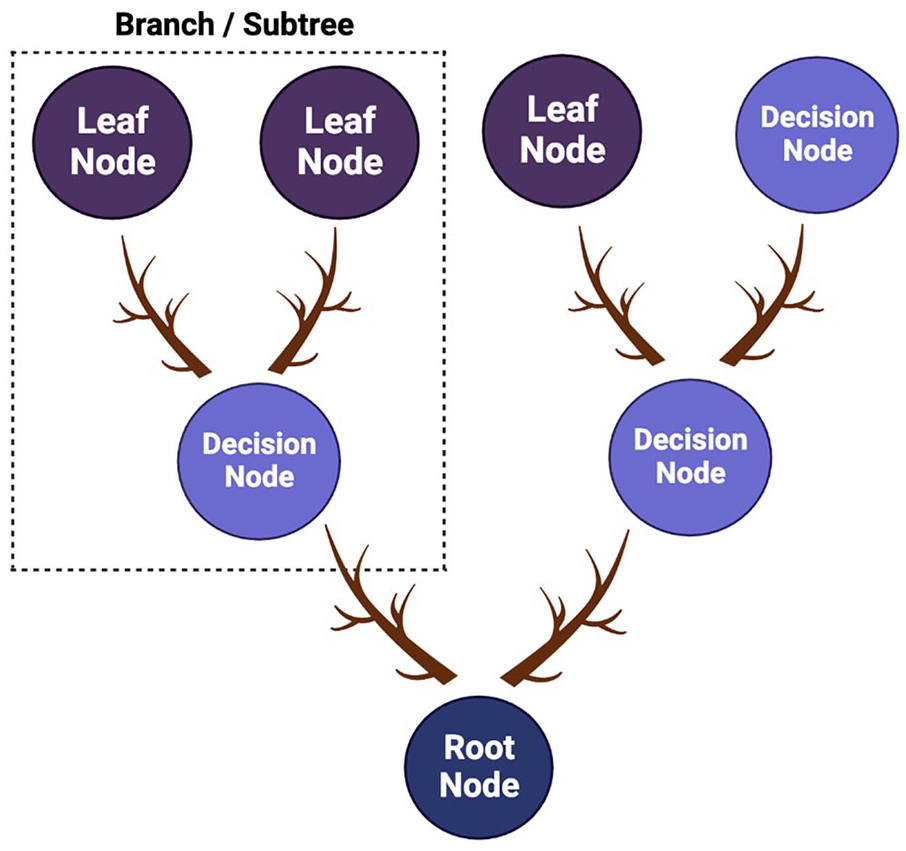
Extreme gradient boost (XGboost) is an ensemble learning technique that uses bagging to train several decision trees thereby pooling the results. The model is scalable and is considered a robust technique for greater accuracy. It is more efficient and can handle large datasets easily. To exploit the tree-based ensemble method, classification and regression trees (CARTs) utilize regularized objective functions to fit the training data. 51 Investigation of the CART structure reveals the presence of root nodes, internal and leaf nodes as illustrated in Figure 3. The entire dataset is represented as a root node which is further divided into internal nodes via binary decision method and the leaf nodes indicate the final class. The sequence of base CARTs is generated at the same time where the weight of each CART has to be adjusted in the training process.
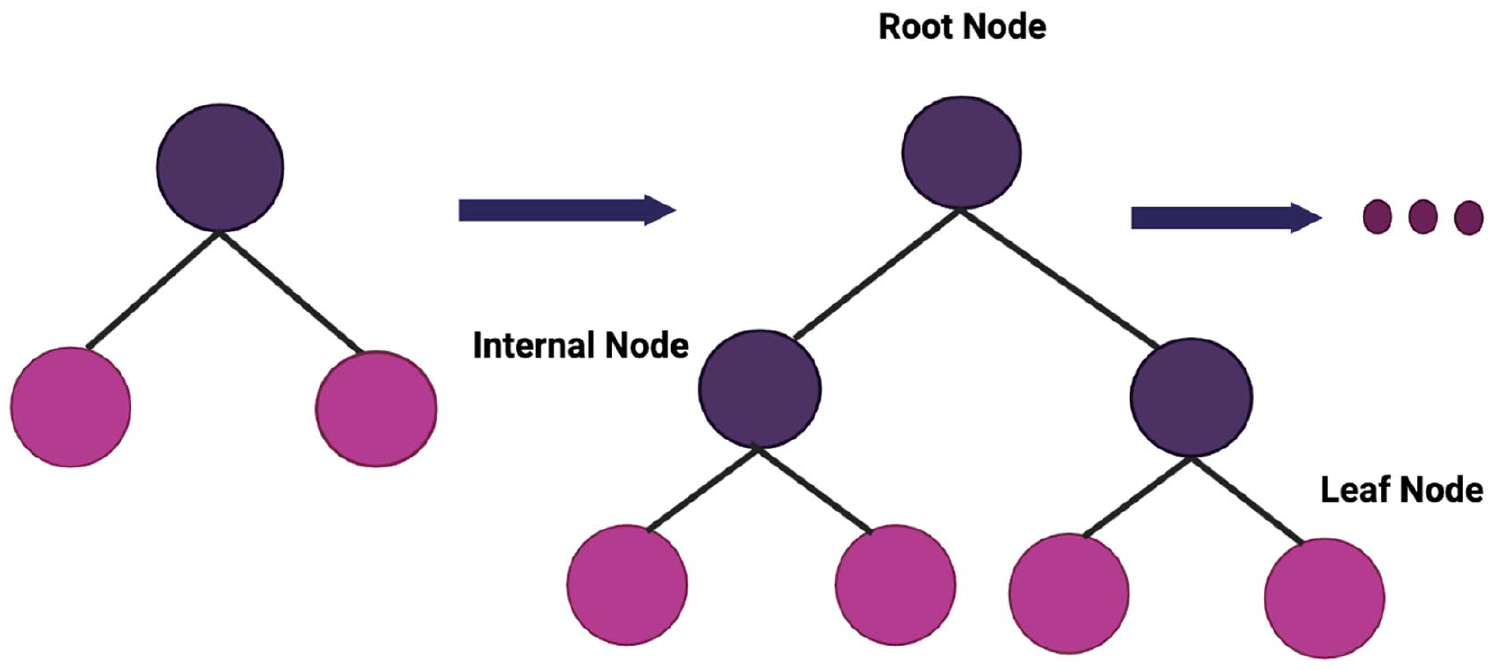
Level-wise growth in extreme gradient boost.
The model has been trained with “n” ensemble trees, to predict the output y for the selected dataset, where m and n represent dimension features and instances respectively.
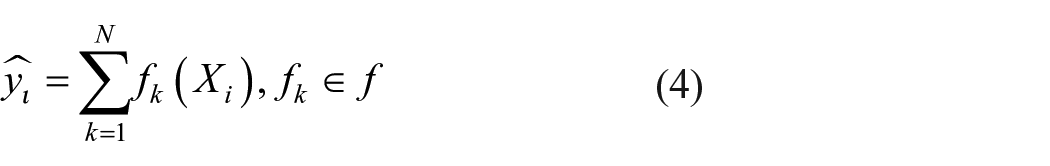
With
where
The ensemble of trees can be determined using the regularized objective function minimization as highlighted in equation (5).
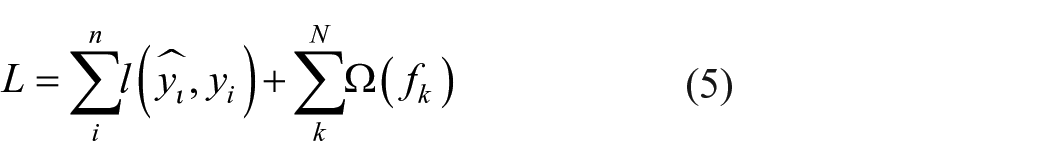
With
where
The objective function of individual leaves is reduced and extra outlets are added sequentially (equation (6)).
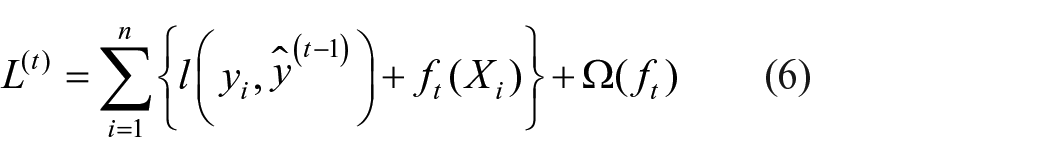

Gradient boosting
Gradient boosting is also an ensemble-supervised learning algorithm that pools several weak learning models to predict new models to reduce the loss function. It helps in developing predictive models by minimizing errors.
53
Consider
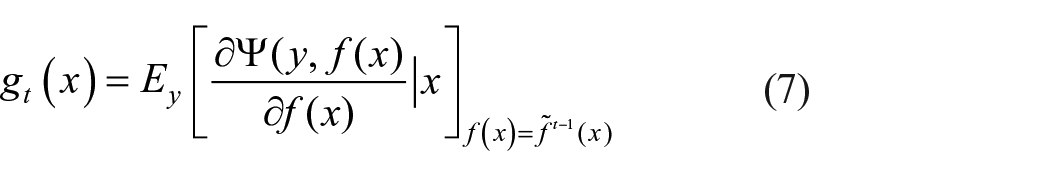
The least-square minimization from a potentially sophisticated optimization problem 54 is achieved by equation (8).
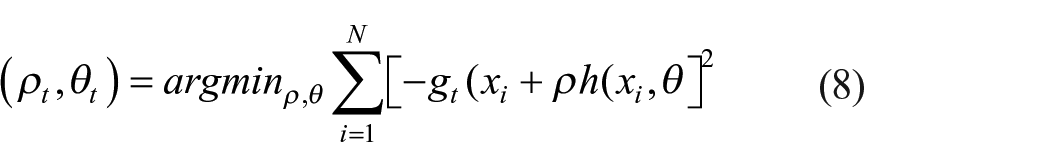
Steps involved in gradient boosting include
(i) Assumption of
(ii) To assess the
(iii) Get the parameter ρi and alter the function as follows 55 :
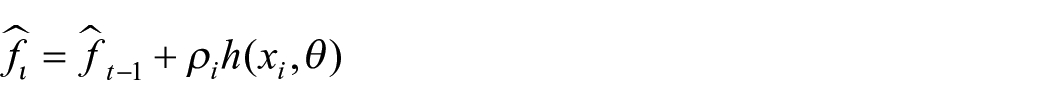
The model initializes through a single leaf to improve the training process for each node and monitors it. 56
Adaptive boosting
Adaptive boosting (AdaBoost) also uses an ensemble supervised learning (meta-learning) approach to increase efficiency. It utilizes an iterative approach to pick up from the errors of weak classifiers and convert them into strong ones. 57 The principle behind this technique is that several weak learners are added stage-wise to achieve strong learners as depicted in Figure 4. It helps to increase the accuracy by turning weak learners into strong ones but the drawbacks include sensitivity to outliers and noisy data. 58
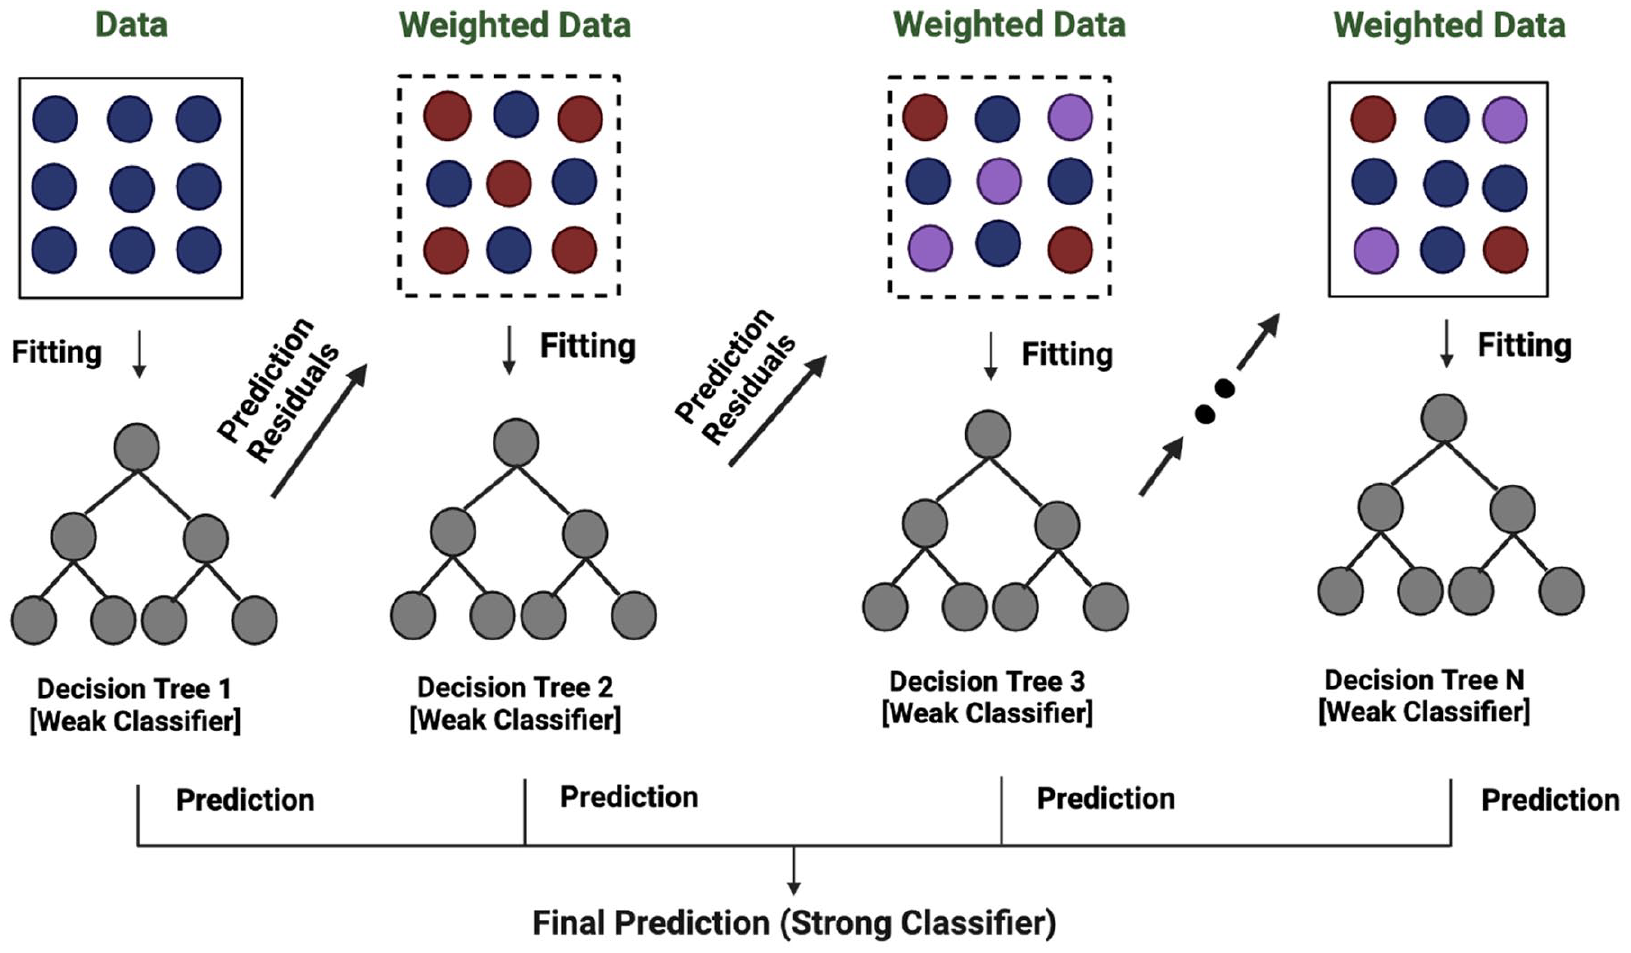
Stage-wise addition strategy in Adaboost.
The stages of the AdaBoost technique are as follows 59 :
1. Definition of weights
2. Consider the weak learner
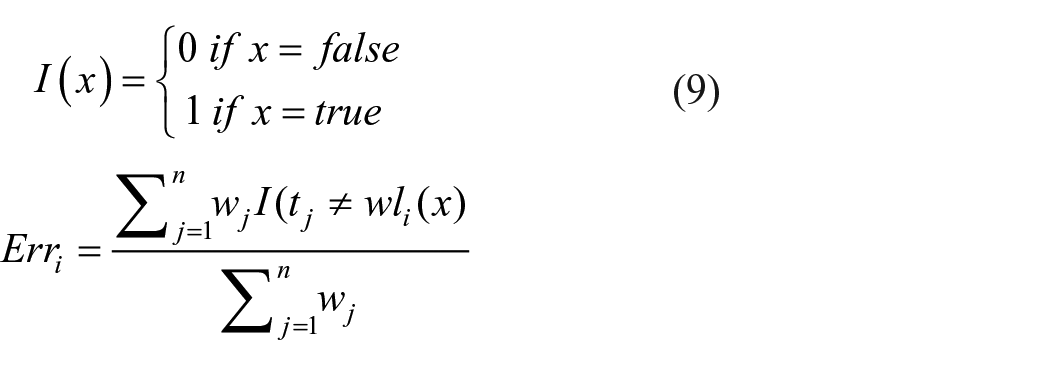
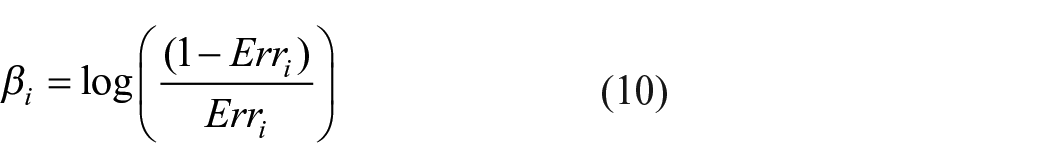
3. Identify the predictor’s weight for each i as stated in equation (10) 60 :
4. Upgrade the weight of the sample for each i to N (by considering N as the learner’s number)
5. To the data, allocate a weak learner, and test
Decision tree
A supervised learning technique that possesses a tree-like structure with internal nodes mainly for features in the dataset, branches designate decision rules, and each leaf node indicates outcome. 61 It is simple and easy to understand as humans make decisions in real life. 62 The decision tree illustration is represented in Figure 5. This algorithm applies to the dataset in deriving decision-related problems. 63
Schematic representation of decision tree algorithm.
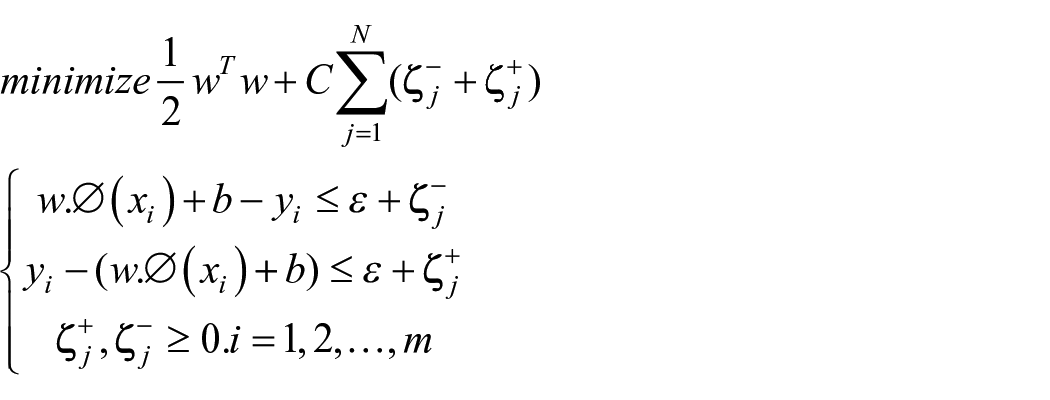
Support vector regression
Support vector regression algorithm in regression finds the hyperplane instead of a line by considering the best fits among the data points. It tries to figure out the hyperplane which passes through many data points. The points that lie near to hyperplane are called support vectors which help to build the boundary line. It helps in processing the non-linear variables using kernel function and is robust to outliers. 64
Assume the given dataset contains a set of n independent samples
The regression function can be identified easily using the following equation (11)

Wherein
where
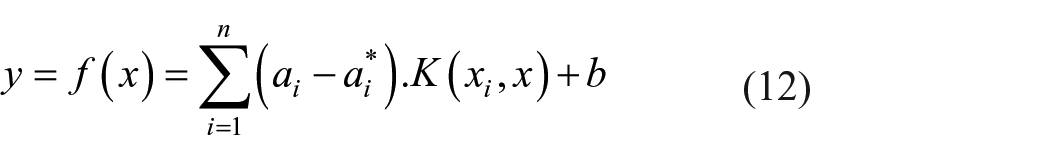
The incorporation of the Lagrange multiplier transforms the above equation into a dual optimization problem as mentioned in equation (12).
Where
Linear regression
Linear regression helps to predict the dependent variable by considering the independent variables. It is easy to perform and finds the best-fit line between the variables (equstion (13)).

where Yi = dependent variable, β = unknown parameters, Xi = independent variable, f = function, ei = error terms.
Ridge regression
It is an extension of linear regression which helps to examine various regression data with multicollinearity. It is a type of regularization technique to minimize the complexity of the model. Since it includes all the features, it reduces model complexity by coefficient shrinkage and prevents overfitting (equation (14)).
Lasso regression
Lasso (Least Absolute Shrinkage Selector Operator) is also a regression analysis that performs regularization and variable selection to enhance prediction accuracy (equation (15).
Features selected to forecast the chitin purity via different machine learning models were schematically illustrated in Figure 6.
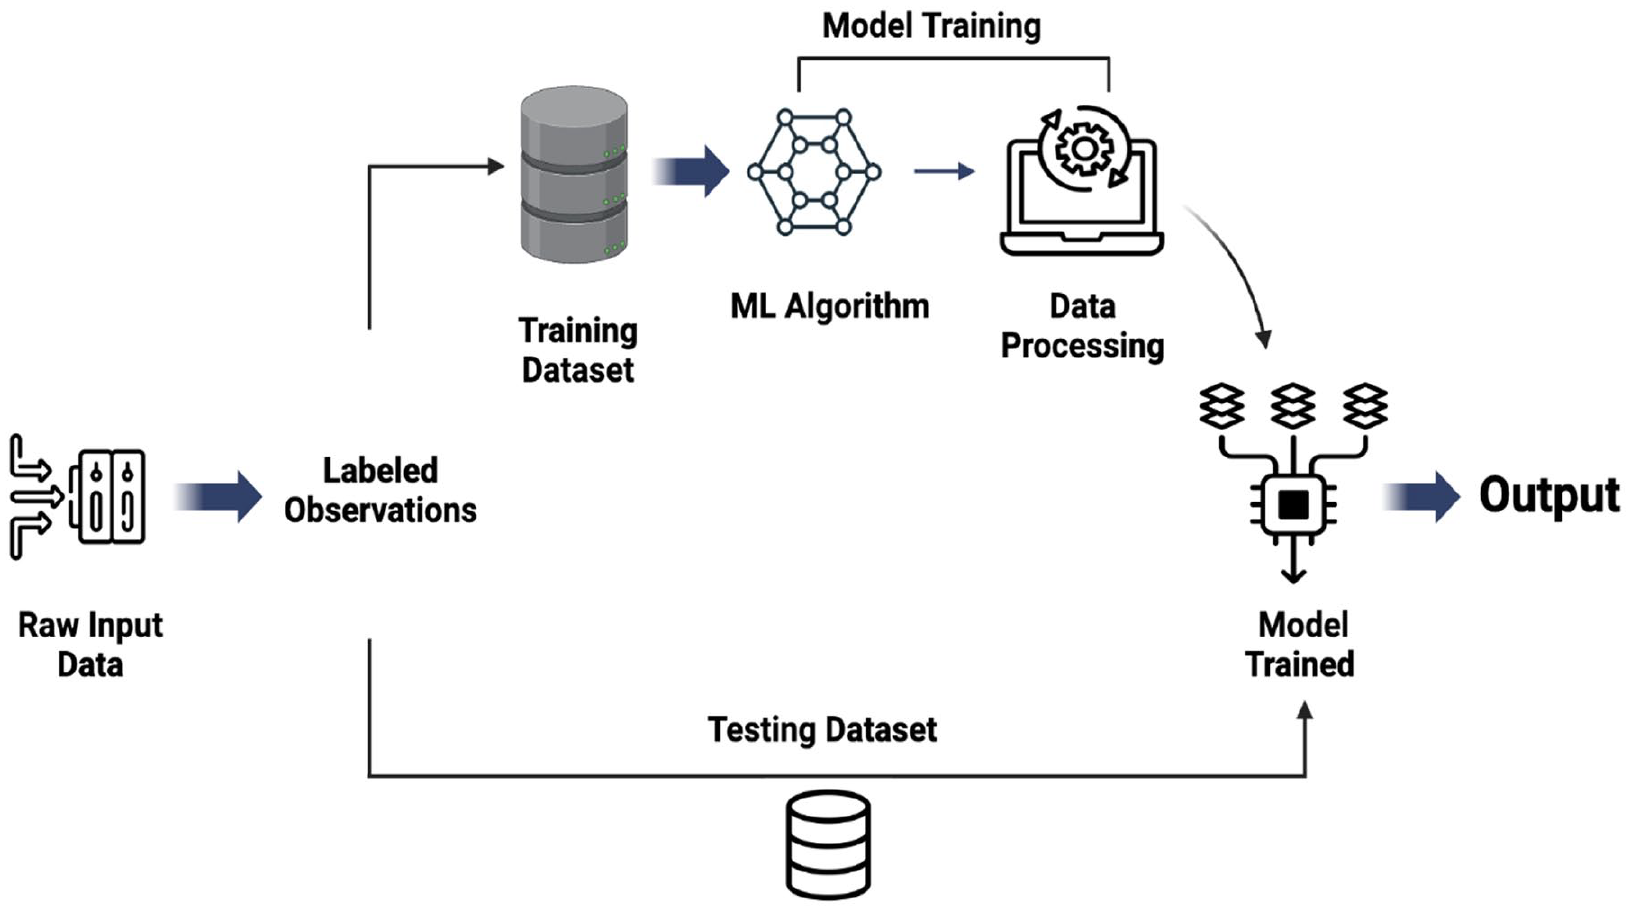
Diagrammatic representation of the proposed model.
Evaluation of modeling performance
Statistical analysis of errors
The reliability of the proposed model was estimated by considering various statistical parameters represented as follows:
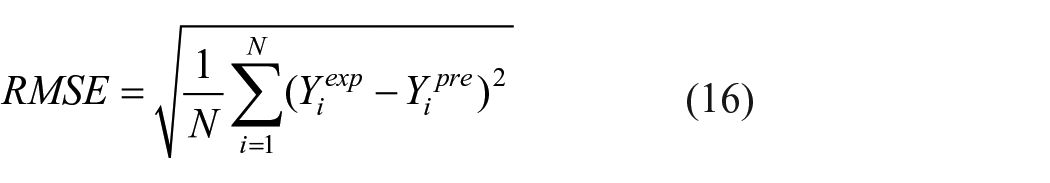
1. An indicative of error dispersion, Root Mean Square Error (RMSE), is calculated using equation (16).
2. The coefficient of determination (R2) as a means of predicting accuracy is calculated using the following equation (17). If the R2 value is adjacent to 1, more precise is the experimental data.
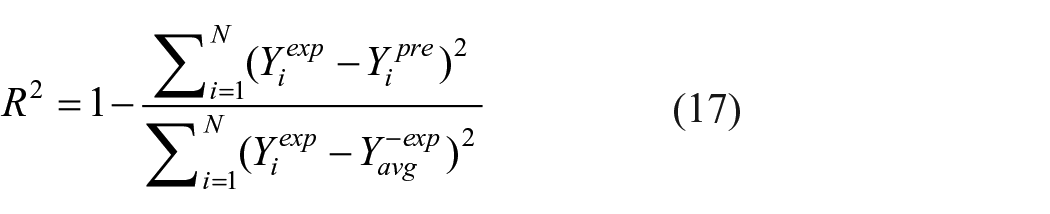
where, Yiexp and Yipred are the experimental and predicted entries respectively and, Yavgexp is the average of the experimental entries.
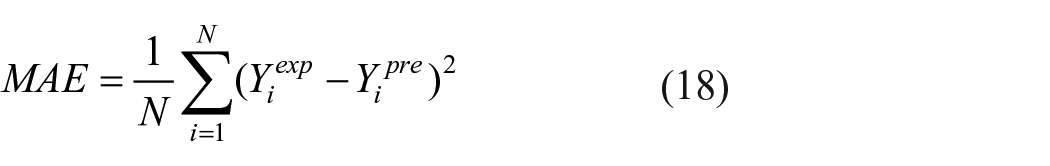
3. Mean Absolute Error (MAE), computes the average difference between the predicted and actual values as stated in equation (18).
The model that displays the highest R2 and lower RMSE and MAE among the various selected models was considered for feature estimation.
Assessing the impact of input features on the target output
A feature importance plot was developed to predict the predominant variables on chitin purity along with scores. The input parameters were ranked in Y-axis based on their influential nature that is, the most significant variable positioned at the top to the least significant parameter at the bottom. Each input feature is represented as a bar on the Y-axis along with SHAP values. Using this feature importance plot, one can find the most significant parameter among the selected inputs. Further, their relations could also be deduced to elucidate the chitin process with enhanced purity.
To study the influence of each input variable on the target output, SHAP (Shapley Additive exPlanations) dependence plots were illustrated to exemplify the key variables involved in chitin purity. Tree SHAP has been constructed to understand the involvement of each input variable in the output variable. The input variables selected for the present study were represented as dots on the y-axis against the SHAP values on the X-axis. The positive or negative effect of each input variable is illustrated along with SHAP values on the X-axis from low to high.
Results and discussion
Data gathering, model employment, and tuning
Data collection was done with the help of evident literature, by considering the experimental data correlated to the extraction of chitin from crustacean sources. The collected dataset was used efficiently to build effective models using the inputs Crustacean source, Hydrogen Bond Donor (HBD), Hydrogen Bond Acceptor (HBA), shell solvent ratio, HBA/HBD molar ratio, temperature, and incubation time to determine the output parameter chitin purity. Retrieved data was pre-processed initially to check data duplication to avoid inaccurate prediction since the same data is considered for both the training and test set. Similarly missing values in the dataset were replaced by plausible values by imputing them with the mode values to avoid bias.
Descriptive statistics of input features
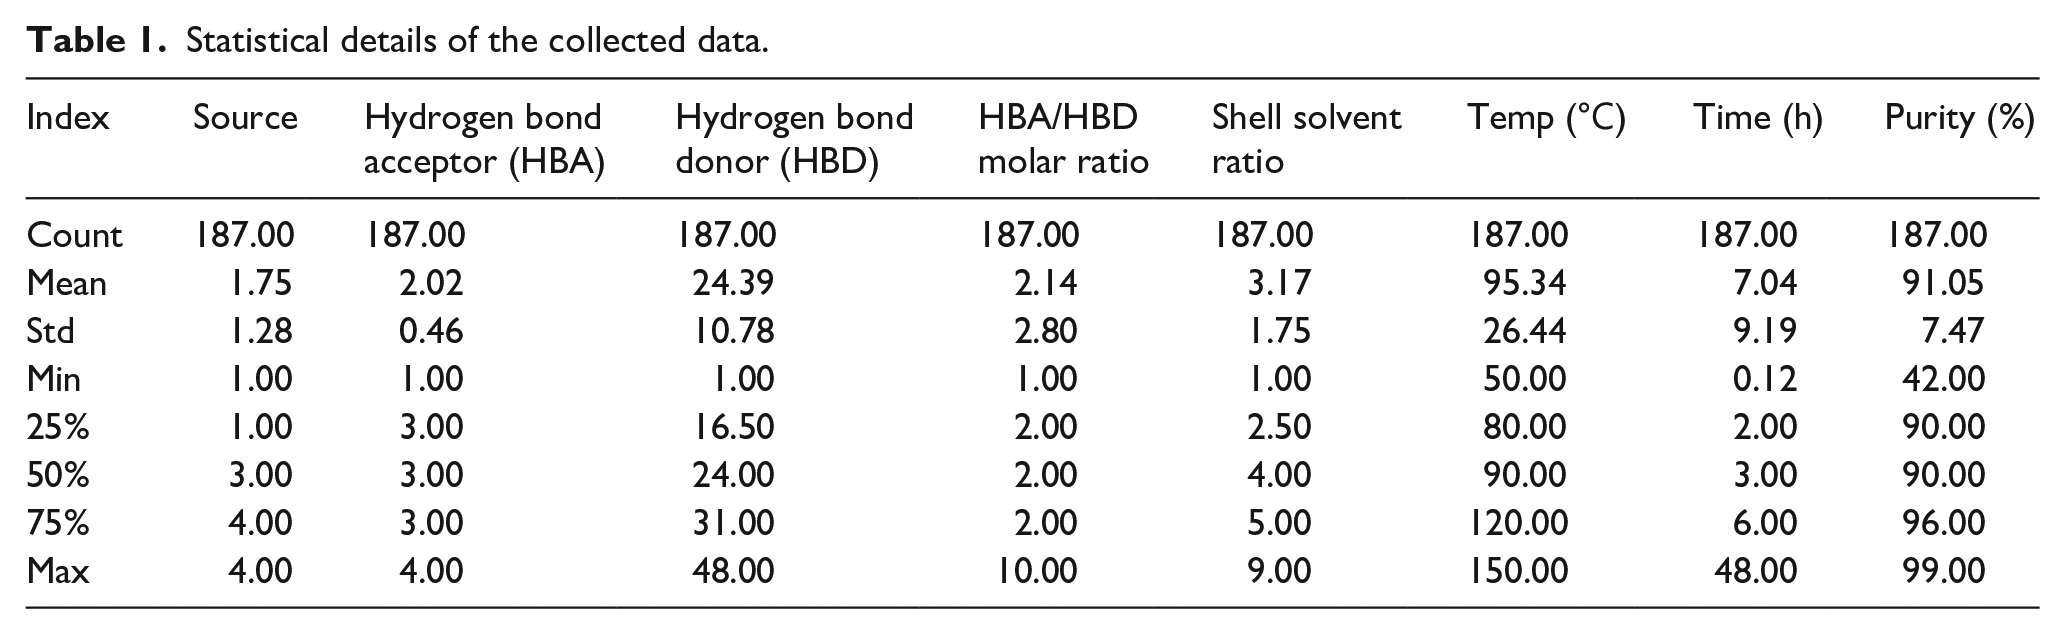
Metrics such as count, standard deviation (std), mean, minimum (min), 25%, 50%, 75%, and maximum (max) have been studied. The descriptive features of the collected dataset to predict the output parameter are depicted in Table 1. Count generally refers to the total number of datasets involved in this study, mean denotes the average of the dataset of each variable, standard deviation indicates the deviation from the mean value. Likewise the minimum and maximum refer to the range of the related parameters. The mean value of the source and hydrogen bond acceptor was found to be 1.75 and 2.02 which is consistent with the gathered dataset. The mean value of temperature and time was observed as 95℃ and 7 h which is comparable to the collected dataset. Similarly, the mean value of the output purity was found to be 91%. A maximum of four crustacean sources such as crab, crayfish, lobster, and shrimp were considered in this present study since chitin extraction using deep eutectic solvents was previously conducted using these sources. Likewise, betaine, betaine hydrochloride, choline chloride, and gluconic acid were employed as the hydrogen bond acceptors. A maximum of 48 hydrogen bond donors, 10 different hydrogen bond acceptor-to-donor ratios, and 9 different shell solvent ratios were considered in this present study. Similarly, the maximum temperature was 150℃, maximum time was 48 h. The maximum chitin purity was found to be 99%.
Statistical details of the collected data.
Evaluation of correlation among the input variables
Pearson’s correlation coefficient attempts to correlate the relation between two variables and displays values in the range between −1 and 1. The value close to 1, denotes a positive relationship, and the value close to −1, depicts a strong negative relation between the variables. If the value is 0, then there is no correlation among the variables. To analyze the relationship between the input and output variables of the gathered dataset, Pearson’s correlation coefficient matrix was constructed and the values are represented in Figure 7. Among the selected inputs, the hydrogen bond donor and acceptor and its molar ratio, shell solvent ratio, temperature, and time were found to have a strong positive relationship. Considering the values, it was clear that these input variables would predict the output variable chitin purity. In addition, the relative importance of each feature is further analyzed in the later sections. An in-depth study of positively correlated variables to obtain pure chitin was further studied by machine learning models.
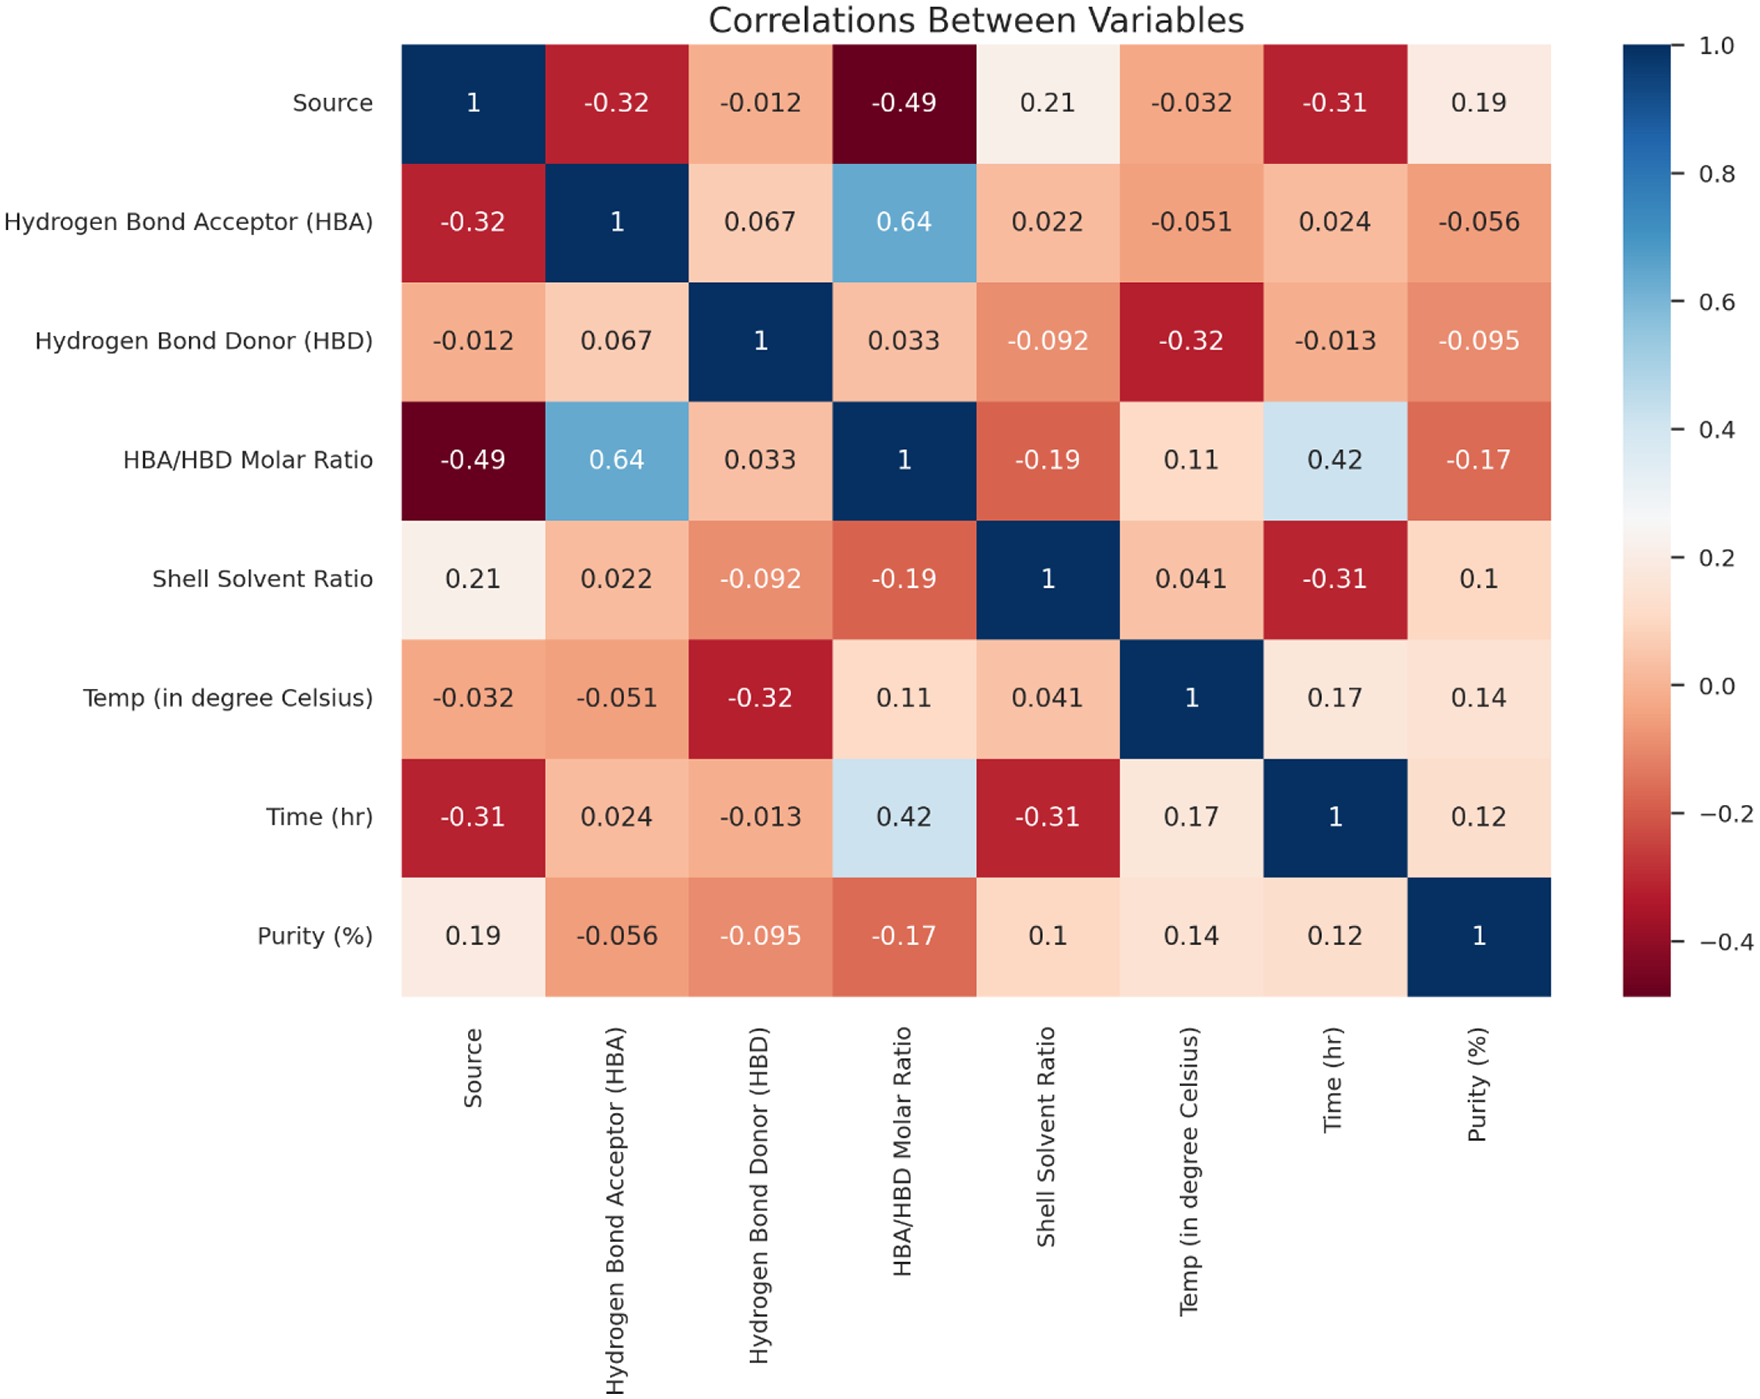
Correlation map of the gathered dataset and its significant levels. The correlation of features is color-coded as provided in the color scale to the right. Dark blue indicates a strong positive correlation whereas dark brown indicates a strong negative correlation.
Box and whisker plot for outlier’s detection using interquartile range
The detection of outliers is essential to understand the values that differ in the dataset. Because outliers will pose an impact on model fitting and lead to a higher rate of error metrics (e.g., RMSE and MAE). Considering that boxplot distribution of the dataset with the selected input variables was constructed to predict the variables with outliers (Figure 8). Boxplots provide a visual representation of the dataset with minimum, maximum, 25 percentile, 75 percentile, and median values. It also helps to figure out the outliers and skewness in the dataset. The box represents Inter Quartile Range (IQR) and the vertical line down the middle of the box exemplifies whiskers which helps to indicate the variability in comparison to IQR. Similarly, the data points which lie outside the whiskers are outliers.
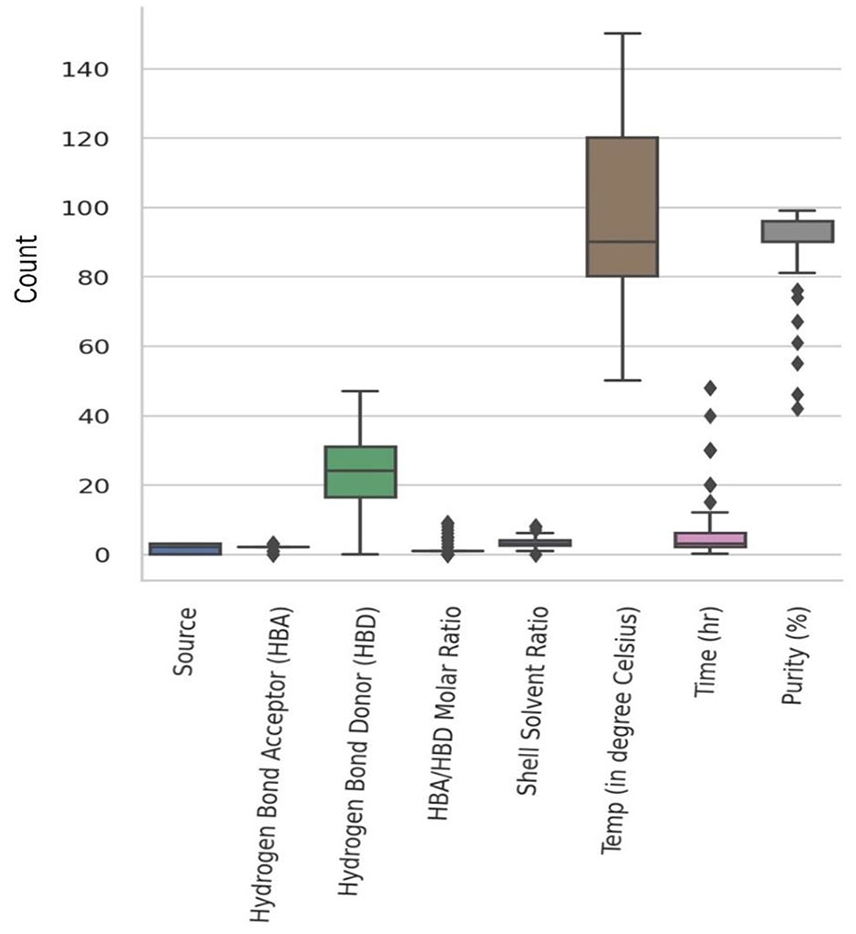
Boxplot distribution of the variables. The points are the outliers.
Hydrogen bond acceptor to donor ratio, shell solvent ratio, and time were found to have outliers with great impact on chitin purity. Likewise, the percentage of purity ranges between 80 and 91 with the selected input variables. Dispersed experimental values in the data might vary chitin purity from the normal range. Chitin purity mostly lies in the range of 80%–90% and lesser purity is shown as outliers as a result of few experimental datasets. A thorough understanding of the outliers helps to forecast the values that differ from the normal range among the input parameters. In addition, it will provide insight to minimize errors and help to build machine learning models with greater accuracy.
Exploration of the best set of features by pairplot
Pairplot is another way of visual representation that helps to understand pairwise rapport between the variables in a dataset. The bivariate distribution of two variables can be studied in a single plot. It is one of the powerful plots that rapidly inspects the distribution of single variables and relationships between two variables. Herein the distribution of variables is schematically represented in Figure 9. The pairwise relation among the selected variables is depicted in grids of axes on the Y and X.
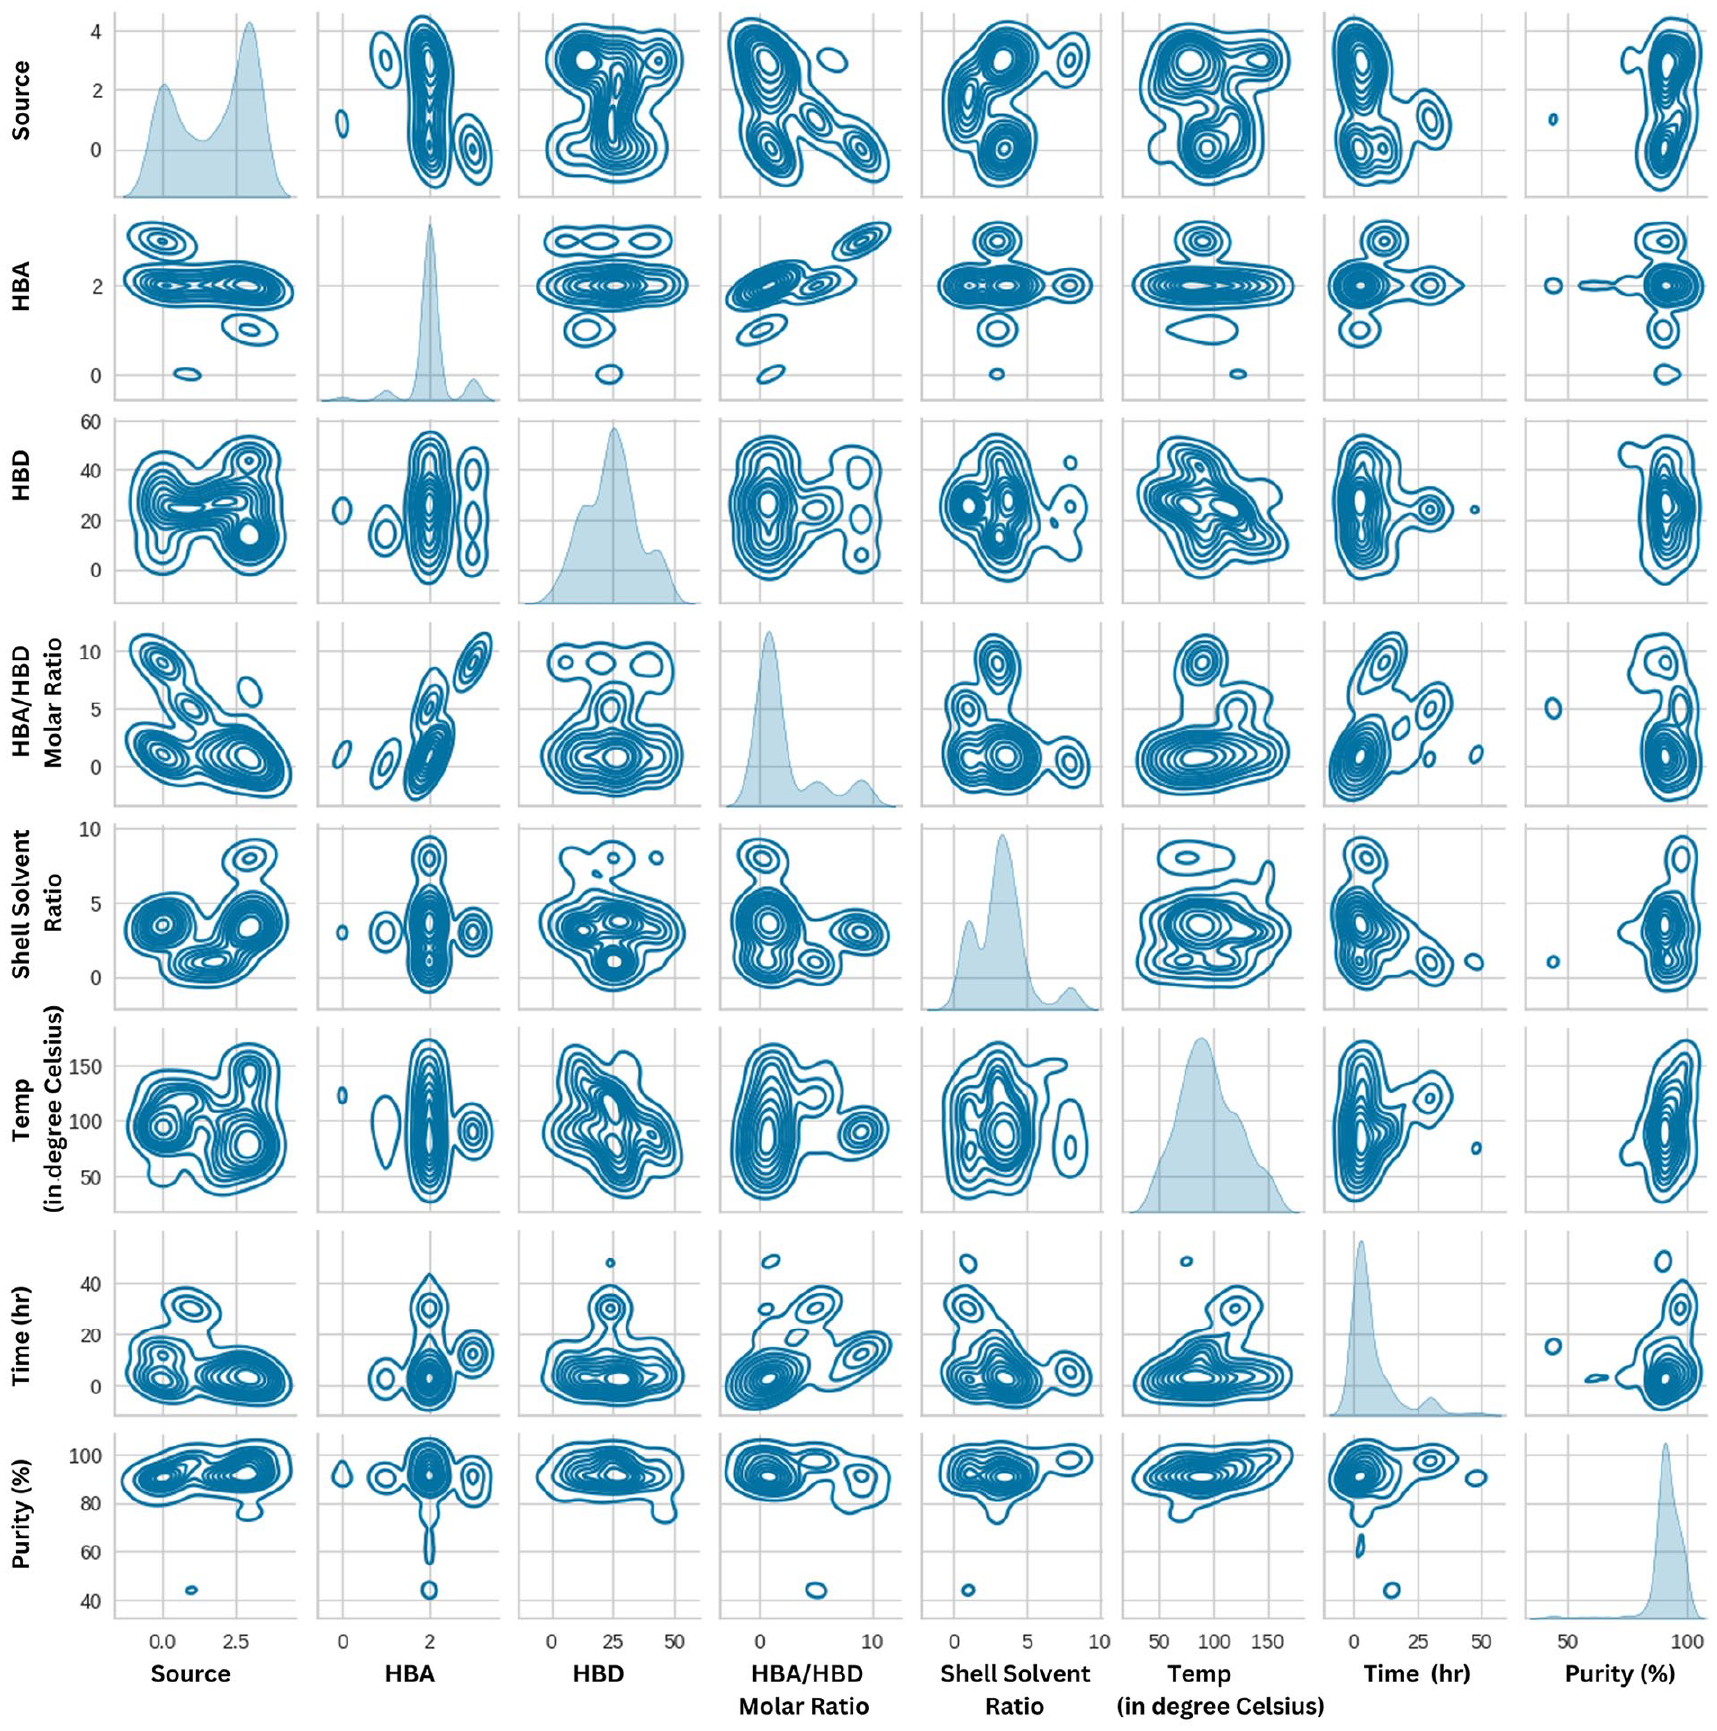
Kernel Density Estimate (KDE) plot of the selected variables. X and Y axes have selected variables.
Statistical details of the evaluated models
The performance metrics such as R2, RMSE, and MAE of the selected models were initially collected to screen the models with better accuracy and with minimal error rates. The performance of the proposed models is described with statistical indices as listed in Table 2.
Statistical description of the performance of the models.
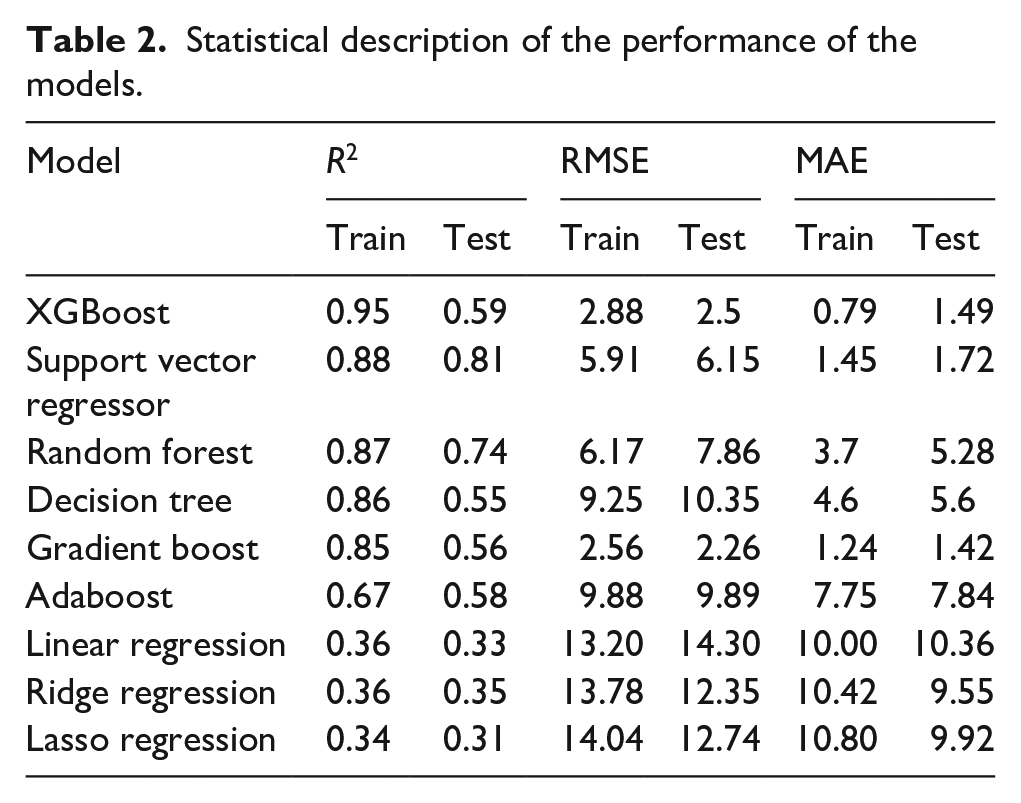
Performance metrics of the proposed models
Machine learning models developed were carefully examined for their accuracy by considering the highest R2 value. Among the proposed models it was clear that the R2 score for the training set was found to be high for XGBoost with a value of 0.95 followed by Support Vector Regressor with a value of 0.88, followed by Random forest, decision tree, gradient boost, and Adaboost with the values such as 0.87, 0.86, 0.85, and 0.67. The basic models such as linear regression, lasso regression, and ridge regression have also been executed to study the R2 score and it was observed that values lie in the range of 0.36. XGBoost outperformed well when compared with other models. Based on the results, the predicted models can be ranked based on the accuracy as follows: XGBoost > SVR > Random Forest > Decision Tree > Gradient Boost > Adaboost > Linear Regres-sion, Ridge Regression > Lasso Regression. The ranking of the proposed models was schematically represented in Figure 10.
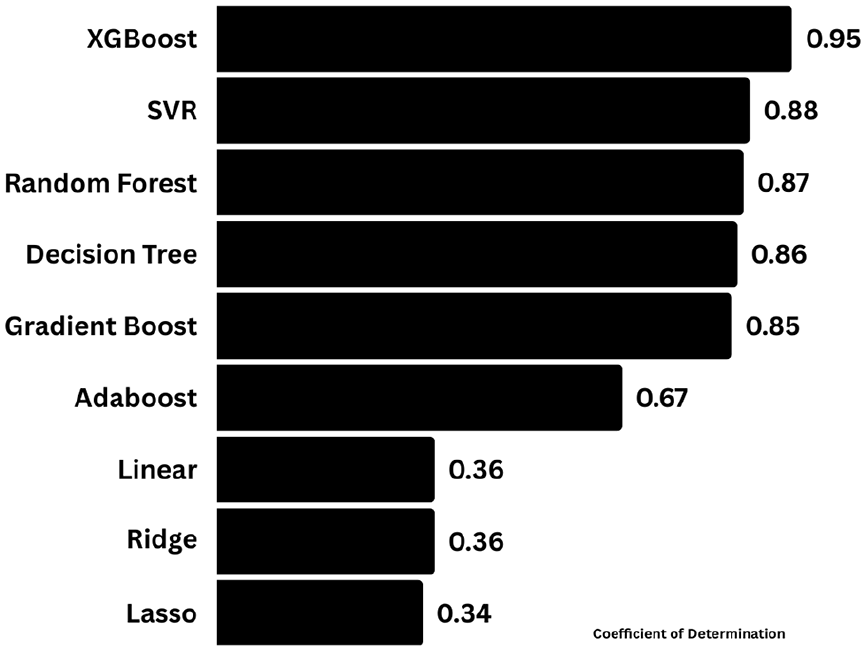
Coefficient of determination (R2 score) of the training dataset by the proposed machine learning models.
Error plots of the models utilized
Models with greater accuracy and lower root mean square error and mean absolute error values were found to be accurate. Accordingly, gradient boost and XGBoost ranked first and outfits well for the dataset with minimal RMSE values of 2.56 and 2.88 as illustrated in Figure 11(a) and with mean absolute errors of 1.24 and 1.28 as depicted in Figure 11(b). By considering the R2 value, RMSE and MAE, XGBoost, Random Forest, Gradient Boost and Decision tree work superior with other proposed models and it was further studied.
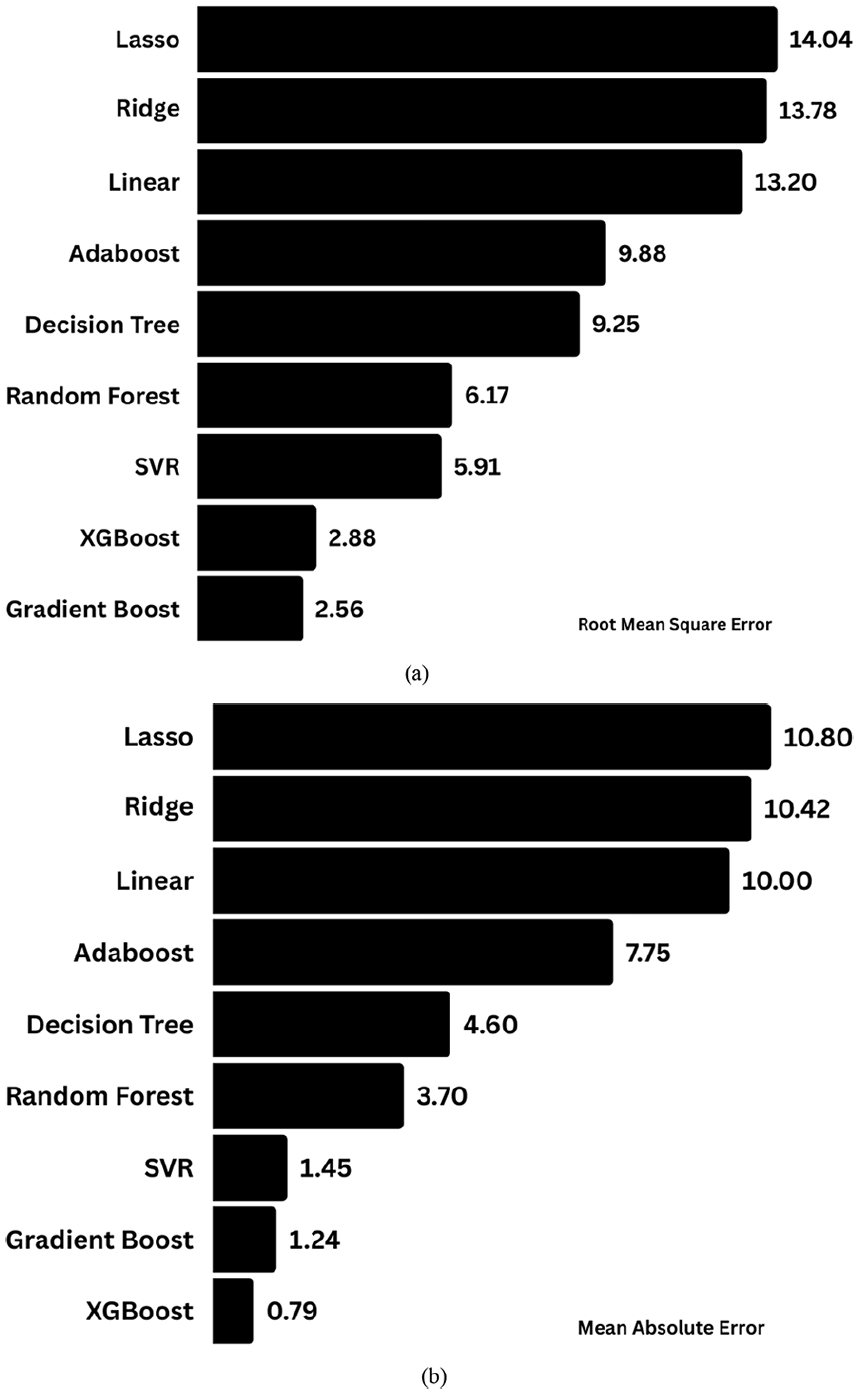
(a) Root Mean Square Error of the proposed models of the training dataset. The values obtained in each model were proposed along the length of the bar, (b) Mean Absolute Error obtained in the training dataset of the developed models.
Investigation of the relative effect of input features on chitin purity
The relative importance of each input variable on chitin purity has been depicted through SHAP dependence plots. The models will provide an in-depth knowledge of control parameters and optimize the control parameters. Further, to explore the influence and weight employed by each input variable, in predicting the target output SHAP dependence plot has been examined by machine learning models screened by their accuracy and error (Figure 12). Plots revealed that hydrogen bond donor, crustacean source, hydrogen bond acceptor to donor molar ratio, temperature, and time have contributing effects on chitin purity. HBA/HBD molar ratio in lower values was found to have a positive effect on chitin purity. Similarly, the temperature in the median range contributes a positive effect, and higher temperature has a negative effect. While considering the hydrogen bond donors, lactic acid, malic acid, and malonic acid have contributed much to determine the degree of purity. Among the sources considered for evaluation, crab and shrimp provide better results, and the higher the time higher the purity. From the SHAP dependence plot, it was observed that almost all of the input variables selected for the present study have significant effects in deciding the chitin purity either at their higher or lower level.
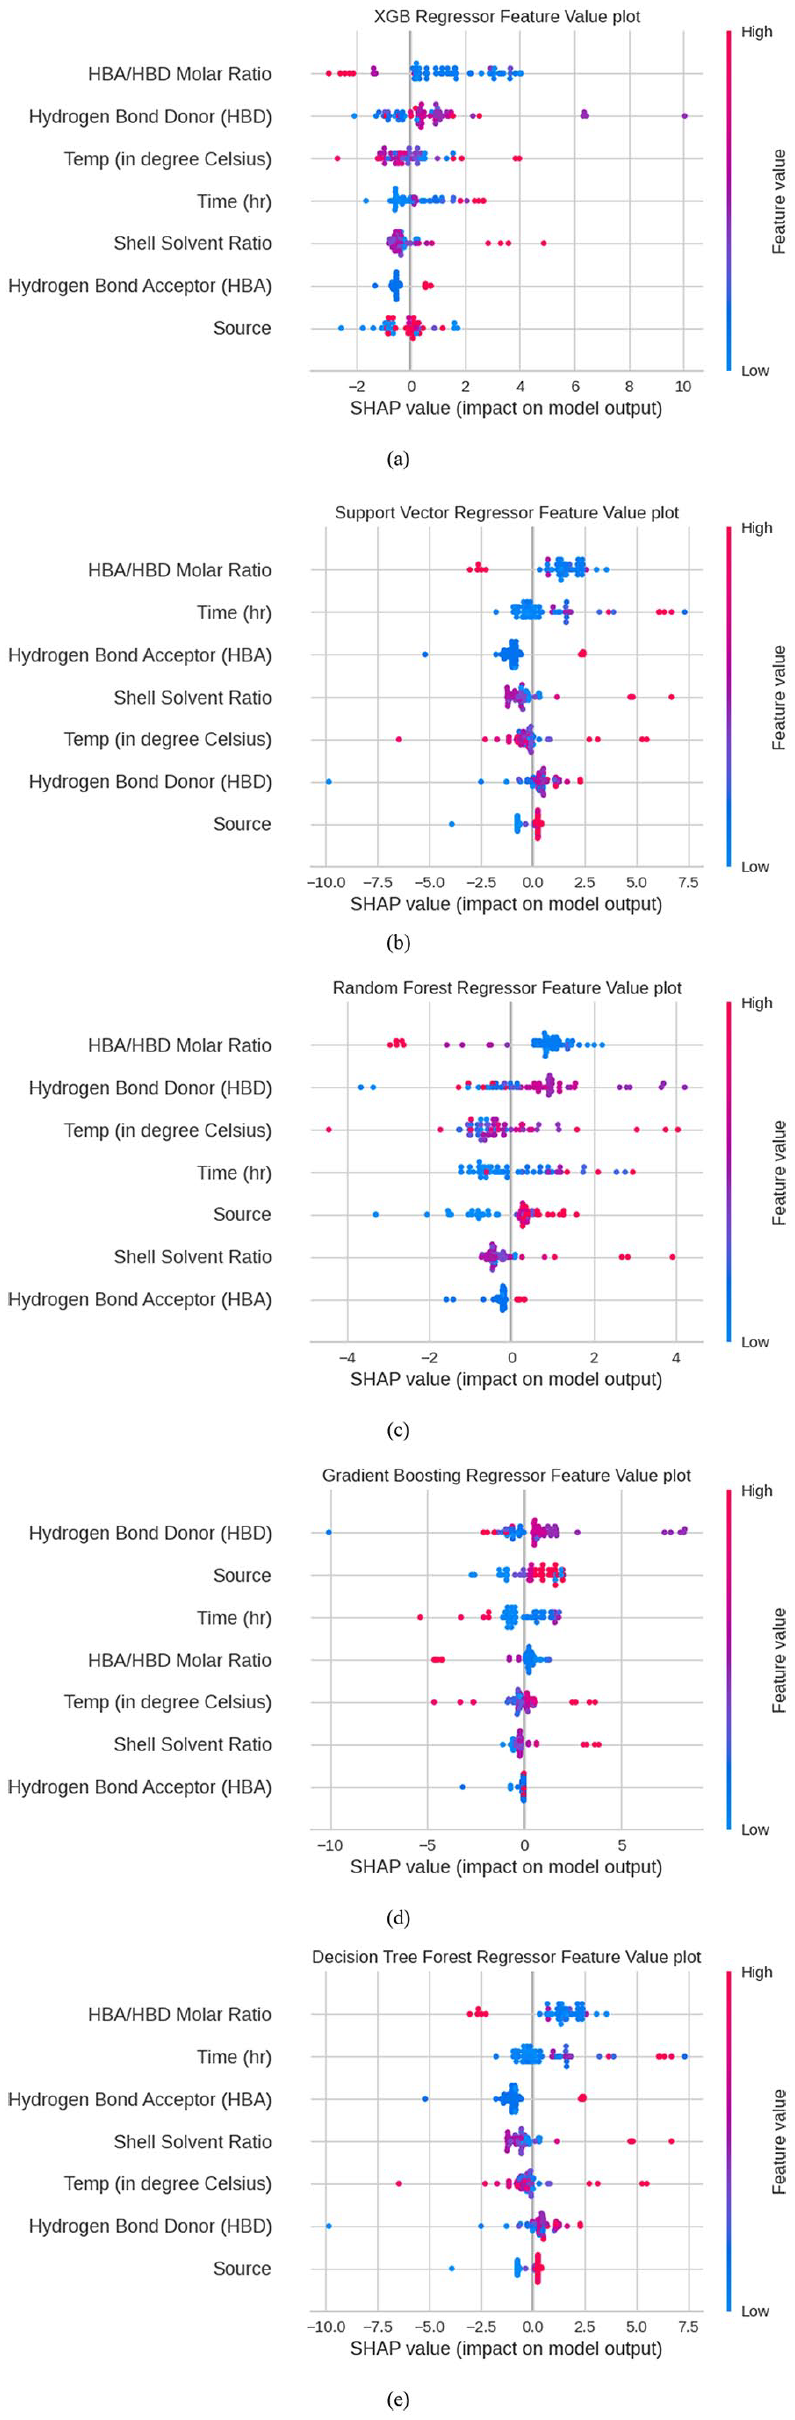
SHAP summary plots by different machine learning models. The color is coded from blue (lower value) to pink (higher value) on the right side of the plot: (a) XGB Regressor feature value, (b) Support vector Regressor feature value, (c) Random Forest Regressor Feature value plot, (d) Gradient Boost Feature value plot, and (e) Decision Tree feature value plot.
Analysis of input features on the output chitin purity
The most contributing factors in predicting the chitin purity were analyzed by different models and the SHAP values were noticed. Almost many of the models state that hydrogen bond donor, crustacean source, hydrogen bond acceptor to donor molar ratio, temperature, and time are the predominant factors. Hence the significance of each feature on the output chitin purity according to the XGBoost model is represented as a SHAP waterfall plot in Figure 13 as it stands first to other models. In the feature importance plot, the X-axis has the values of target variable purity, which is a dependent variable with the input features in the Y-axis. f(x) is the predicted value of the model with the given input variables, and E(f(x)) is the expected output of the target variable none other than purity. The mean of all predictions was found to be 91 based on the input variables. The SHAP value of each input variable is observed by the length of the bar. The plot depicts the prominent and least variables involved in the chitin purity along with the SHAP value. The absolute SHAP value indicates the effect of a single feature on the output prediction. From the SHAP waterfall plot, it was noticed that hydrogen bond donor, hydrogen bond acceptor to donor molar ratio, and temperature have a greater positive influence in determining the chitin purity.
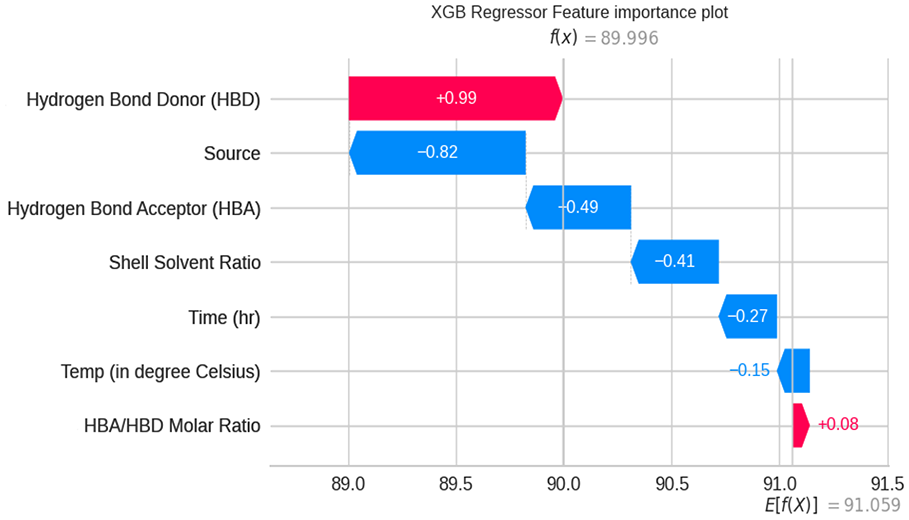
SHAP waterfall plot for predicting the contribution of the feature. Positive influential features for higher prediction are displayed in red and the features with negative impact are marked in blue.
The predominant variables can be predicted based on the ranking of each input variable. Figure 14 illustrates the SHAP bar plot based on the absolute values of each input feature considered for the study. It was observed that the hydrogen bond donor stands first in determining the chitin purity, followed by time, temperature, hydrogen bond acceptor to donor molar ratio, source, etc.
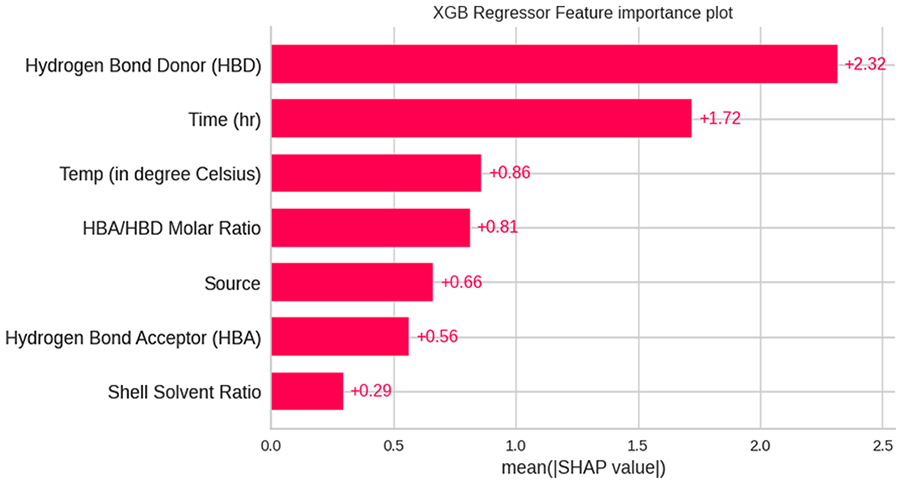
SHAP Bar Plot with absolute mean value of each feature.
Effect of input variables on the output target purity
Several machine learning models have been critically examined to predict chitin purity using several input variables. Even though the significant variables and their correlation and their effect with other features were investigated, further study related to the optimal conditions of each parameter is essential to have in-depth knowledge of the exact conditions necessary to obtain pure chitin on the selected variables. From this perception, each input variable is prudently focused to determine the chitin purity. In this aspect, a joint plot was illustrated schematically to understand the relation of each variable on chitin purity (Figure 15). Among the different sources like crab, crayfish, lobster, and shrimp, chitin obtained from crab and shrimp showed quality chitin. Likewise among the hydrogen bond acceptors choline chloride followed by gluconic acid exhibited better results rather than betaine and betaine hydrochloride. 48 different hydrogen donors have been included in this present study to identify the better donors in combination with acceptors for pure chitin. It was observed that lactic acid, malic acid, and malonic acid provided good results when compared with others. The hydrogen bond acceptor to donor molar ratio is one of the prominent influential factors as predicted in the feature importance plot. Molar ratio of 1:1 and 1:2 is ideal apart from other ratios like 1:3, 1:4, 1:5, 1:10, 1:40, 2:1, 3:1, and 5:1. Crustacean shell source and deep eutectic solvent ratio is vital for chitin extraction since their ratio determines chitin yield. Yet there is another important fact that it has a positive role in determining purity. The present data contains various shell solvent ratios such as 1:5, 1:10, 1:15, 1:20, 1:25, 1:29, 1:30, 1:40, and 1:50. Results clearly stated that shell and solvent in the ratio of 1:20 is superior with others. Incubation temperature and time are other factors that are involved in the extraction of chitin. Even though time and temperature didn’t contribute much, the SHAP waterfall plot and dependence plot provide insight into how these parameters have a negative effect on chitin purity. Almost all the conditions in the gathered dataset mostly result in more than 90% purity. In addition, longer incubation times and higher temperatures have suboptimal effects. From the dataset, it could be understandable that temperature at 90℃ and incubation time of less than 4 h are more notable than others.
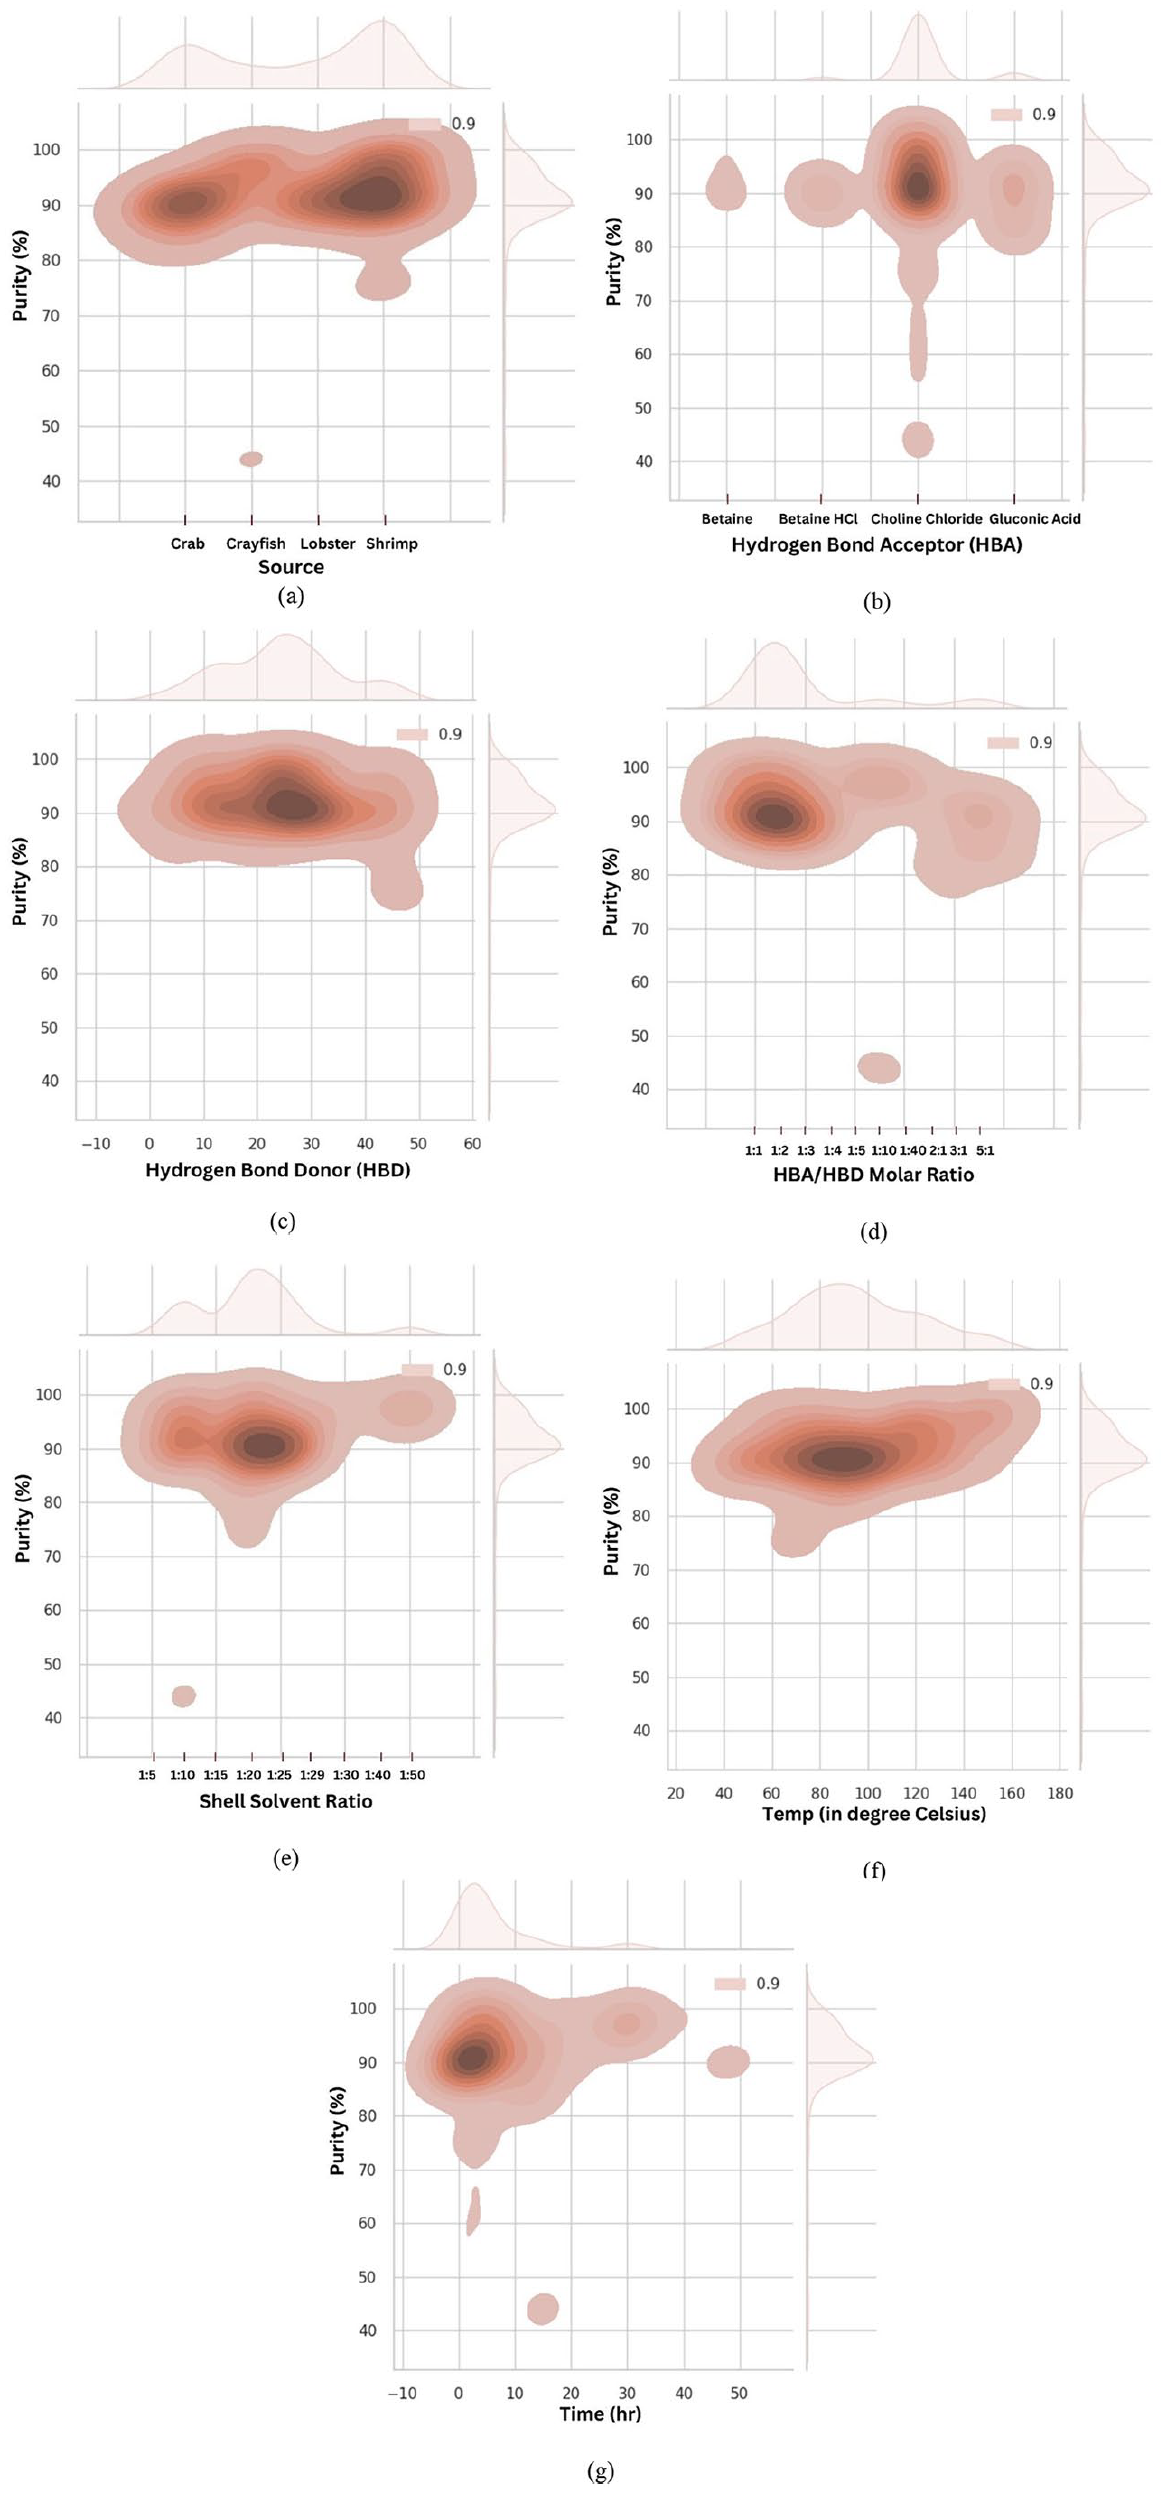
Prediction of output target using specific variables of the collected dataset: (a) source, (b) hydrogen bond acceptor, (c) hydrogen bond donor, (d) HBA/HBD molar ratio, (e) shell solvent ratio, (f) temperature (℃), and (g) time (h).
Significance of the present study
The objective of this present study is to develop a robust model with the selected input variables to predict chitin purity. It was implemented with the assistance of machine learning techniques since it is a computational approach and provides the desired results with high accuracy. It paves a new way to predict the chitin purity and offers the possible outcomes using pre-established conditions. It also helps the researchers to minimize the laborious time associated with experiments in determining the results. A preliminary study was performed to observe the correlation among the input variables and to detect the outliers. Among the proposed machine learning techniques, a model with better accuracy and minimal RMSE and MAE values was screened for further analysis. XGBoost stands first when comparing the others and hence a depth study was carried out. The influence of input variables and their impact on chitin purity was examined using feature importance and SHAP dependence plots. It was noteworthy that selected variables have strong interaction either positive or negative on the target output. The primary factors in deciding the chitin purity are the hydrogen bond donor and its molar ratio with the acceptor. Likewise, time and source are other variables that could be considered while planning the process conditions. Each input feature is further investigated to conclude the parameters that have shown higher purity.
Conclusion
The current study effectively developed a model for chitin purity determination via extensive learning-based methodology. The major research outcomes are as follows:
The XGBoost algorithm substantiates an efficient and accurate model in predicting chitin purity with an R2 value of 0.95 when compared with other models selected.
Minimal error rates such as RMSE and MAE were achieved in the XGBoost algorithm which confirms the model’s reliability.
Essential parameters in predicting the output variable purity were examined by SHAP summary plots which further support the model’s decision. Among the variables, the hydrogen bond donor combination is relatively significant and stands first followed by incubation time and temperature.
It is evident that the input variables hydrogen bond donor, time, and temperature exert a strong influence on the chitin purity.
The model proposed in this study will elucidate the importance of selecting the right source, hydrogen bond acceptor and donor and its molar ratio, shell and solvent ratio, incubation time, and temperature to reduce the experimentation and expedite the researchers with suitable conditions to produce quality chitin which eventually useful for biomedical applications.
Supplemental Material
sj-docx-1-jbf-10.1177_22808000241248887 – Supplemental material for Exploring the purity of chitin from crustacean sources using deep eutectic solvents: A machine learning approach
Supplemental material, sj-docx-1-jbf-10.1177_22808000241248887 for Exploring the purity of chitin from crustacean sources using deep eutectic solvents: A machine learning approach by Sasireka Rajendran and Madheswaran Muthusamy in Journal of Applied Biomaterials & Functional Materials
Footnotes
Code availability
Codes used for the study are taken from the Sci-kit learn library.
CRediT authorship contribution statement
Sasireka Rajendran: Conceptualization, Methodology, Writing – original draft, Writing – review and editing. Madheswaran Muthusamy: Investigation, Data curation, Formal analysis, Writing – review and editing.
Data availability
The datasets used for the present study are available in the supplementary.
Declaration of conflicting interests
The author(s) declared no potential conflicts of interest with respect to the research, authorship, and/or publication of this article.
Funding
The author(s) received no financial support for the research, authorship, and/or publication of this article.
Supplemental material
Supplemental material for this article is available online.
References
Supplementary Material
Please find the following supplemental material available below.
For Open Access articles published under a Creative Commons License, all supplemental material carries the same license as the article it is associated with.
For non-Open Access articles published, all supplemental material carries a non-exclusive license, and permission requests for re-use of supplemental material or any part of supplemental material shall be sent directly to the copyright owner as specified in the copyright notice associated with the article.