
Abstract
A tissue preparation method will inevitably alter the tissue content. This study aims to evaluate how different common sample preparation methods will affect the tissue morphology, biomechanical properties, and chemical composition of samples. The study focuses on intervertebral disc (IVD) tissue; however, it can be applied to other soft tissues. Raman spectroscopy synchronized with nanoindentation instrumentation was employed to investigate the compositional changes of IVD, specifically, nucleus pulposus (NP) and annulus fibrosus (AF), together with their biomechanical properties of IVD. These properties were examined through the following histological specimen types: fresh cryosection (control), fixed cryosection, and paraffin-embedded. The IVD tissue could be located using an optical microscope under three different preparation methods. Paraffin-embedded samples showed the most explicit details where the lamellae structure of AF could be identified. In terms of biomechanical properties, there was no significant difference between the fresh and fixed cryosection (p > 0.05). In contrast, the fresh cryosection and paraffin-embedded samples showed a significant difference (p < 0.05). It was also found that the tissue preparations affected the chemical content of the tissues and structure of the tissue, which are expected to contribute to biomechanical properties changes. Fresh cryosection and fixed cryosection samples are more promising to work with for biomechanical assessment in histological tissues. The findings fill essential gaps in the literature by providing valuable insight into the characteristics of IVD at the microscale. This study can also become a reference for a better approach to assessing the mechanical properties and chemical content of soft tissues at the microscale.
Introduction
Tissue preparation and preservation of histological tissue are generally accomplished through paraffin embedding or cryopreservation (freezing). 1 Each approach has its own set of benefits and drawbacks. While paraffin embedding is expected to maintain morphological features better, cryopreservation is thought to better preserve enzyme and antigen expression. In addition to pathological analysis, histological tissue specimens have been used to observe the biomechanical properties of both cryosection2–5 and paraffin-embedded.6,7 However, to our knowledge, there is no study on the differences in the biomechanical properties of histological tissue using different preparation methods.
The effect of organ or tissue disease can lead to many physical changes in a sample, which emphasizes the importance of developing accurate tools for assessing tissue composition and biomechanics at the microscopic scale. Changes in gross content and biomechanical characteristics significantly impact organ function and, as a result, morbidity and death. Mechanical testing and in vitro experiments are necessary for biomechanics to acquire material characteristics or validate numerical models. These tests should be carried out in an in vivo setting. However, testing fresh samples directly is precarious because the tissue structure can become damaged and denature during handling if the process takes too long. To mitigate this adverse effect, tissue and derivative specimens are frequently frozen. 8 Another way to preserve the tissue is through formalin-fixation of tissues. Formaldehyde, either 4% or 10% buffered formalin, commonly maintains the morphology of human tissues before the examination and for research reasons. 9
The different sample preparation intuitively may change the tissue’s protein structure and biomechanical characteristics and compositions. Therefore, in this study, we design the experiment to assess the biomechanical characteristics and tissue composition of different histological specimens of soft tissue with the intervertebral disc (IVD) tissue, especially as the focus of the study. IVD is an avascular organ composed of (1) Annulus Fibrosus (AF): a fibrous ring made of organized fibrillar collagen; (2) Nucleus Pulposus (NP): a gelatinous structure that consists of a bulk of proteoglycan and water and lies in the loosening collagen.10,11
To analyze the different histological preparation effects on the biomechanical properties and the composition changes in the IVD tissue, the experiment employs nanoindentation testing integrated with a Raman spectrometer. Nanoindentation has been successfully applied in measuring mechanical properties of biological tissues in different types of sample preparations such as cryosection of the blood vessel, 2 paraffin-embedded brain tissue, 6 and monolayer cell culture for cell assessment in the mammalian cells. 12 Nanoindentation will be more powerful if combined with other instrumentation, such as confocal microscopy. 13 The instrumented indentation will use a nano-dynamic mechanical analysis (nanoDMA) mode in this study, a novel method made possible using a depth-sensing technique to obtain the viscoelasticity of the IVD tissue.14,15
Raman spectromicroscopy was used parallelly with nanoDMA in this study, combining Raman spectroscopy with microscopy to serve as a powerful tool to get more information from biological samples. Raman spectroscopy has begun to emerge as a promising tool for biomedical analytics and clinical diagnostics, such as the detection and staging of cancer. It has been validated in ex vivo studies.16–19 Raman spectroscopy is a powerful technique that provides sub-micron spatial resolution and has the specificity to capture tissue compositional variation at the molecular level along tissue dimension length ranges. Raman mapping and imaging provide a high spatial resolution map of compositional tissue properties, including protein and lipid, which is impossible with conventional molecular biology techniques. Moreover, In the current case, we evaluate the chemical composition and the intermolecular interactions (H-bonding, helix, sheet formation, coiling, etc.) in the IVD material by determining Raman band peak positions and widths.20,21
A synchronized detection system combining nanoindentation and Raman spectroscopy used previously in our study22–24 can be a powerful method to assess biological samples. In this case, it can give a comprehensive data set as the biochemical changes and tissue biomechanical properties can be evaluated and correlated for different tissue preparation methods. Furthermore, this study will give the recommended histological preparation method for biomechanical testing especially nanoindentation and composition analysis of the tissue.
Methods
Sample preparation
The rat tail samples were rat remains that our colleagues kindly gave: Assistant Prof. Yan-Jye Shyong from the Institute of Clinical Pharmacy and Pharmaceutical Science after their experiments. As of the animal ethic committee (AEC) and the animal care and protection act 2001, approval is not necessary for the rat remains/cadaver used for this study. The rat tails were cut off and maintained in the plastic bag filled with PBS on the ice during transportation to the laboratory, and then the skin and tendons were taken off to expose the coccygeal vertebrae. There are 12 samples (n = 12) in each kind of sample preparation.
Fresh cryosection sample
The cut coccygeal was embedded in an optimal cutting temperature (OCT) medium and frozen at −80°C for 24 h. These frozen samples were prepared as cryostat chucks with OCT and sectioned to a nominal thickness of 35 μm using a microtome (Leica CM3050 S). The samples were mounted on an APS-coated glass slide (Matsunami APS-11 Adhesive Glass Slide, Japan) and soaked in PBS solution to maintain hydration. The cryosection of the fresh sample was set as the experiment’s control because it has fewer processing steps than the others. The OCT is a noninfiltrating supportive medium that will not affect the biomechanical property; therefore, before the Raman spectrum of the fresh cryosection is comparable to fresh tissue. 25
Fixed cryosection sample
The cut coccygeal was placed in 4% paraformaldehyde for 5 days. Then the samples were embedded in an OCT medium and frozen at −80°c for 24 h. These frozen samples were prepared as cryostat chucks with OCT and sectioned to a nominal thickness of 150 μm using a microtome (Leica CM3050 S). The samples were mounted on an APS-coated glass slide (Matsunami APS-11 Adhesive Glass Slide, Japan) and soaked in the PBS solution to keep them hydrated.
Paraffin-embedded sample
The coccygeal vertebrae of the rat tails were fixed in 4% paraformaldehyde for 5 days, then vertebra samples were cut on the middle of the disc for cross-section. The paraffin-embedded section was done at the Human Biobank Research Center of Clinical Medicine, NCKUH. Tissue samples were processed for fixation, dehydration, clearing, and infiltration in an automatic, programmed machine (Sakura Tissue-Tek® VIP®). Each step was done for 1 h. The process used 10% formalin for the second fixation, 100% ethanol for dehydration, xylene for tissue clearing, and melted paraffin for tissue infiltration; After the tissue was thoroughly infiltrated with melted paraffin, the samples were brought to the machine for paraffin embedding (Leica HistoCore Arcadia). The melted paraffin was dispensed into the stainless steel base molds, then the tissue samples were sunk into the bottom of the base molds. After that, the blocks from the base molds were placed on the cold plate to make the paraffin solidify. After the full solidification of paraffin, the molds were taken off. The paraffin blocks were clamped on the paraffin microtome and cut into 5 μm of thickness. The slices were put in warm water to unfold. After that, the slices were mounted on the glass slide. After that, the samples were mounted on glass slides and deparaffinized in three Coplin jars with xylene, for 5 min, then they were rehydrated with 100%, 95%, and 70% ethanol solution. After that, they were rinsed under running tap water for 5 min and then soaked in PBS solution to maintain hydration.
Raman spectroscopy
Raman spectroscopy was used to make measurements on the same samples used to measure the parameters of viscoelastic properties. The collection parameters were optimized to protect the sample from potential photothermal damage caused by exposure to the probe laser. The following parameters were used: Ambient conditions – Room temperature; Laser wavelength; 532 nm, microscope objective; 100x, laser power;1.3 mW, spot size; 1 µm, spectral range 200–4000 cm−1, grating; 1800 lines/mm. The time of exposure to obtain individual Raman spectra is 20 s, with 12 scans taken.
Instrumented nanoindentation
DMA was used to analyze the behavior of various materials in the presence of sinusoidal stress or strain oscillation. Specimens were tested in the nanoDMA test to assess tissue that exhibits viscosity and elasticity (viscoelastic material). NanoDMA makes it possible to analyze data as both dynamic forces and as quasi-static forces.
The DMA test can yield the following parameters.26,27
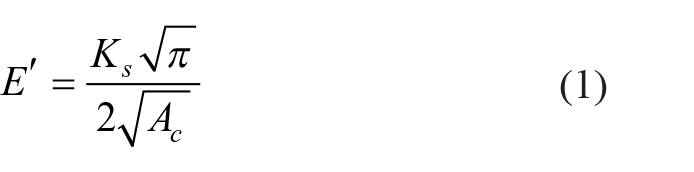
(1) Storage Modulus (E′) indicates a viscoelastic material’s stiffness and is proportional to the energy accumulated during a loading cycle. It can be computed using the following equation.
(2) Loss modulus (E″) represents energy dissipation during one loading cycle and is frequently associated with internal friction. It is sensitive to different modes of molecular motion. It can be calculated using the following equation.

(3) Damping ratio/tan delta (tan δ) is defined as the ratio of E′ and E″. It reflects mechanical damping or internal friction in a viscoelastic system and is a measure of energy loss represented as recovered energy. The higher the elastic characteristics of the material, the smaller the loss factor.

(4) hardness(H) shows the resistance of samples to different types of permanent changes in shape when the load is applied. H is defined by the following equation.

(5) the elastic modulus of the (Er) represents the sample resistance to elastic deformation when a load is applied. It can be measured using the following equation.

Where ω, Ks, Cs, P, Ac, vi, vs, Ei, Es are the frequency, stiffness of the contact, damping of the contact, contact load, contact area, Poisson ratios of the specimen, Poisson ratios of the probe, elastic moduli of the specimen and elastic moduli of the specimen probe respectively. The Ks and Cs can be calculated using the following equations.
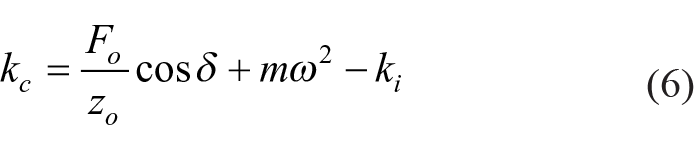

Where Fo, Zo, m, ki, Ci are force, displacement amplitude, the mass of the indenter, stiffness of the indenter, and the damping of the indenter, which are all known parameters.
Specimens (AF and NP) were tested in the nanoDMA to assess the tissue’s viscosity and elasticity (viscoelastic material). NanoDMA makes it possible to analyze data as both dynamic forces and as quasi-static forces. In dynamic analysis, viscoelasticity is represented by storage modulus (E′), loss modulus(E″), and tan δ 26 in the static analysis, we can determine the hardness(H) and Young’s modulus (Er) of samples. To perform NanoDMA in this experiment, the Hysitron Triboindenter TI 980 with nanoDMA III and Berkovich diamond tip was used in the load-controlled experiment. The system is equipped with an optical microscope (IEEE 1394 CCD camera) to assist in localizing the NP and AF and capture the morphology feature of the samples. The setting of the camera used TriboScan zoom setting 1, 0.5x camera digital magnification, 20x fixed optical magnification, 10x total magnification, 626 μm of horizontal size, and 548 μm of vertical size.
A preload of Po = 1 μN superimposed to a constant force, Pmax = 80 μN was applied, and sinusoidal cyclic compression at different frequencies in the range of 10–200 Hz was applied. The experiment was conducted at 25°C. Figure 1 illustrates the general experimental layout and schematic of the indention system. Samples prepared using all three described preparation techniques were mounted on a glass slide with known biomechanical properties (Er = 74.744 GPa, and H = 8.076 GPa).

Experimental setup: Integration of indentation test, Raman spectroscopy, and XRD.
Phase analysis
In order to check the phase changes due to sample preparation, phase analysis of the IVD sample was carried out by the X-ray diffraction (XRD) technique using a two-dimensional X-ray diffractometer D8 Discover with GADDS (Bruker AXS Gmbh, Karlsruhe, Germany). Three representative samples in each condition were tested. The 2Ѳ scanning range was from 5°to 80°. The measurement condition was as follow, CuK-α radiation: 1.54184 Å (0.154184 nm), Power: 40 kV and 40 mA; Beam size: 1.0 mm (the collimator system allows the analysis of 1000 μm2 surface areas); detector type: Vantec-2000 (14 cm×14 cm area and 2048 × 2048-pixel density); Sample to detector distance: 15.03 cm; exposure time: 300 s/frame.
Statistical analysis of biomechanical properties
Statistical analysis was performed, and data are expressed as the mean ± standard deviation. The values of the standard deviations are expected to react to biological variability and experimental error. Statistically significant differences between groups were determined using one-way analysis of variance (ANOVA), followed by Tukey’s test for multiple comparisons using OriginPro 2018. A probability of p = 0.05 was used to distinguish significant differences in all statistical evaluations. The charts are presented in box plots to present the data variability.
Results
Tissue morphology
The tissue microstructure in each tissue preservation was assessed using an optical microscope integrated with the nanoindentation instruments. Both the NP and AF can be localized in the cryosection of fresh, fixed, and paraffin-embedded tissue under the optical microscope. The microstructure of the fresh cryosection can be seen in Figure 2(a) and (b). Both AF and NP can be distinguished in the optical microscope images of fixed cryosection tissue as shown in Figure 2(c) and (d). This means that the AF microstructure can be differentiated clearly. Figure 2(a) and (c) show that the AF lamellae structure of collagen fiber is clearer in the fixed cryosection sample compared to the structure of the fresh section. Figure 2(d) shows the NP structure of the cryosection of the fixed sample. There was no significant difference between the NP of the fresh cryosection and that of the fixed cryosection. Figure 2(e) and (f) show the microstructure of the paraffin-embedded disc tissues. The series of concentric rings or lamellae with collagen fiber lying parallel within each lamella of AF tissue can be seen in Figure 2(e). Moreover, the NP structure looks more uniform as shown in Figure 2(f).

Microstructure of disc tissues (a) AF of fresh cryosection, (b) NP of fresh cryosection, (c) AF of fixed cryosection, (d) NP of fixed cryosection, (e) AF of paraffin-embedded, and (f) NP of the paraffin-embedded sample. The red arrow indicated in the AF images shows the visible collagen structure. The yellow arrow indicated in the NP shows the uniform structure of the extracellular matrix.
Chemical content
The water content and proteins in a biological tissue matrix play an important role in the resulting biomechanical properties. Raman spectroscopy allows us to identify the water content and assess changes in protein structures in the samples for each tissue preservation method, as shown in Figures 3 to 5.

Raman spectrum of some proteins and liquid content of different tissue preparation. Each spectrum was acquired by averaging the spectra of all samples (n = 12 in each kind of preparation). The spectra were normalized between 0 and 1.

Intensity Amide I (I1656/I1006) and III (I1280/I1006) of the samples. A = fresh cryosection, B = fixed cryosection, C = Paraffin-embedded sample (n = 12 in each kind of preparation). NS: statistically different (p > 0.05), *: p < 0.005 and **: p < 0.001.
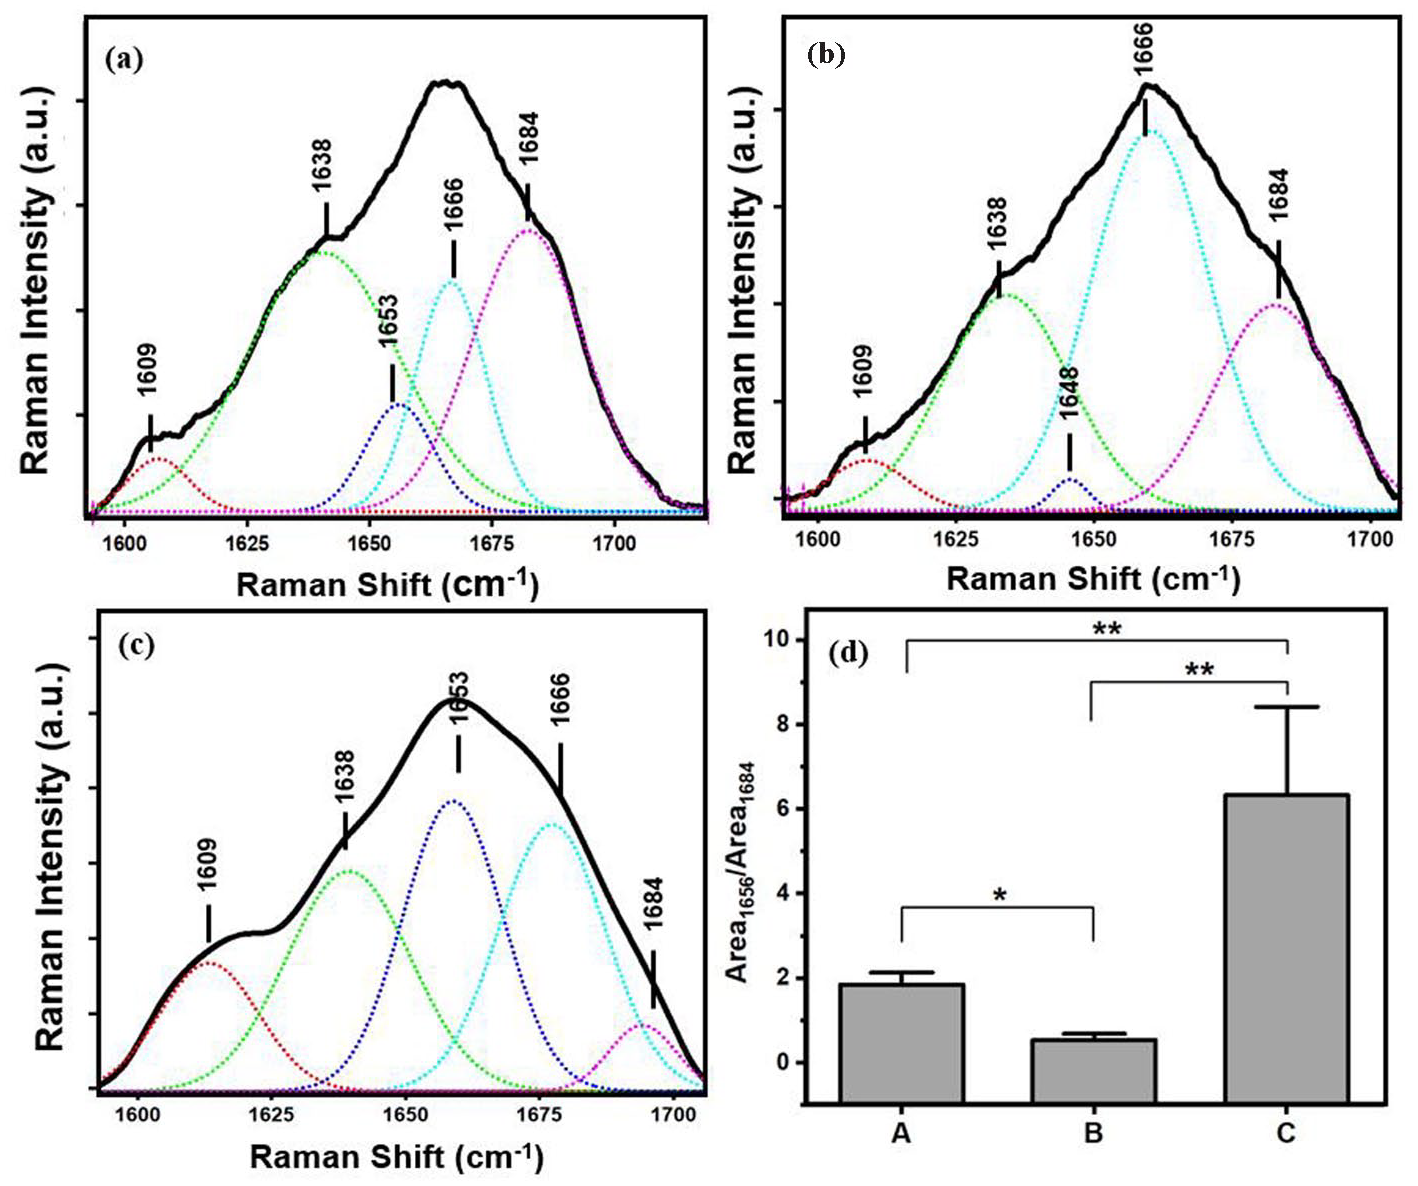
Deconvolution of Amide I spectrum: (a) fresh cryosection, (b) fixed cryosection, and (c) paraffin-embedded sample. Red = Antiparallel β-sheet, green = Parallel β-sheet, blue = Random coil, cyan = α-helix, purple = Turns. (d) Collagen crosslinking ratio defined as the area ratio of Raman bands at around 1656 to 1684 cm−1. A = fresh cryosection, B = fixed cryosection, C = Paraffin-embedded sample (n = 12 in each kind of preparation). * indicates p < 0.005 and ** indicates p < 0.001.
The spectra represented are for the matrix composition of the outer part of the disc (AF). The overall spectra are different in each sample. The broad OH stretch bands at 3100–3600 cm−1 corresponded to water. The similarity in these bands means that all samples have similar levels of hydration. 28 These OH bands are overlapped with the Amide A (N-H stretch) at 3400 cm−1. There were slight changes in the ratios of peaks in the CH2 and CH3 bands at ~2900 cm−1. These bands are a good measure of the overall organic content.29,30 As can be seen, the overall ratio of organic bands to water bands is similar for all samples. The amide III (collagen) at 1280 cm−1,31–33 has a very different spectral shape in the paraffin-embedded sample compared to the fresh and fixed cryosection samples. The CH2 scissor bands ~1456 cm−1 indicating organic content was also slightly different in each sample. The spectra also exhibit differences in the Amide I (collagen) at 1654 cm−1. 34 The Raman sharp peak at 1001 cm−1 is characteristic of phenylalanine. 34 All of these differences indicate that the choice of sample preparation method can affect the underlying chemical condition of the sample and will be further explained below.
Reduction of protein due to sample preparation
Information about collagen intensity changes can be seen from the amide band. Amide I peak at 1656 cm−1 and amide III peak at 1280 cm−1 can be one of the indicators to assess if there is any intensity changes due to the sample preparation. The quantity of Amide III was determined by using at 1280 cm−1 compared to phenylalanine peaked at 1001 cm−1. Phenylalanine is one of the aromatic molecules that is not sensitive to the local chemical environment 34 and could therefore be used as a reference to calculate the relative content of amide I and amide III. The ratio of the peak 1656 and 1683 cm−1 (I1656/I1006) is 1.62 ± 0.07, 1.60 ± 0.1, and 1.43 ± 0.13. The ratio of the peak 1280 and 1683 cm−1 (I1280/I1006) is 1.60 ± 0.08, 1.61 ± 0.1, and 1.24 ± 0.2 in fresh cryosection, fixed cryosection, and paraffin-embedded sample respectively and seen in Figure 4. Overall, the intensity of amide I and III in fresh cryosection and fixed cryosection is not statistically different (p > 0.05). In paraffin-embedded, the intensity of amide I and III is statistically different with fresh cryosection (p < 0.05 and p < 0.001, respectively).
Alteration of protein secondary structure
Figure 5(a) to (c) shows a detailed analysis of the Amide I spectrum that consists of amide bonds with different H-bonding interactions in α-helices, β-sheets, random coils, and turns that are used to investigate the spectral changer in the secondary structures of collagen upon tissue preparation of IVD. Each conformation has different intensity among the different sample preparations. Any evidence of the denaturation of proteins during the preparation of the samples will show up in this spectral region because denaturation will lead to structural changes in the proteins, such as unfolding. Taking the fresh cryosection as the control, which should be the least denatured, we can see that the other two preparations are both different. The area under the around 1656 to 1684 cm−1 secondary structures in the amide I spectral region, which corresponds to the non-reducible (trivalent) to reducible (divalent) collagen crosslinking ratio, can be used to determine the collagen quality metric.35,36 The ratio of area 1656 and 1684 cm−1 (Area 1656/Area1684) is 1.85 ± 0.2, 0.54 ± 0.1, 6.33 ± 1.2 in fresh cryosection, fixed cryosection, and paraffin-embedded sample respectively and seen in Figure 5(d). Overall, the protein secondary structure of all samples is statistically different.
Increasing of alkoxy group due to oxidation
Figure 6(a) to (c) shows a more detailed analysis of the CH2CH3 stretching region. Compared to the fresh cryosection sample, a new peak appears at 2848 cm−1 in fixed cryosection and paraffin-embedded. This peak may be due to alkoxy groups, indicating that some oxidation could have occurred during processing. 37 The intensity of the peak 2848 cm−1 is 0.98 ± 0.21 and 2.21 ± 0.42 fresh cryosection, fixed cryosection, and paraffin-embedded sample, respectively, as seen in Figure 6(d). There is a statistical difference between the fixed cryosection and the fresh cryosection regarding the alkoxy group intensity.

Deconvolution of CH2CH3 group (organic content) (a) fresh cryosection, (b) fixed cryosection, (c) paraffin-embedded sample. (d) Alkoxy group area comparison after curve normalization from 0 to 1. A = fixed cryosection, B = Paraffin-embedded sample (n = 12 in each kind of preparation). There is no alkoxy group peak found in the fresh crysection. *: p < 0.005.
Biomechanical properties
We can interpret the nanoDMA data for quasi-static load and dynamic load analysis. The term “quasi-static load” refers to a load that is applied so slowly that the structure deforms at the same rate (very low strain rate), and thus the inertia force is very small and can be ignored. A dynamic load, on the other hand, causes a structure to vibrate, and the inertia force is significant enough to be taken into account.
Quasi-static analysis
Figure 7 shows plots of nanoindentation results as the mean H and Er of each sample. The mean H of fresh, fixed cryosection and paraffin-embedded tissue are 0.122 ± 0.020, 0.134 ± 0.015, and 0.137 ± 0.016 GPa, respectively. The mean Er of the fresh, fixed cryosection and paraffin-embedded tissue are 3.670 ± 1.47 GPa, 4.599 ± 1.08 GPa, and 5.149 ± 1.42 GPA respectively. The overall plot shows that there is an increasing trend in the value of Er and H from fresh to fixed cryosection to paraffin-embedded samples. However, for fresh and fixed cryosection, there were no significant differences between on mean of H (p > 0.05) and the Er (p > 0.5). In contrast, the fresh cryosection and paraffin-embedded showed significant differences both in H (p < 0.05) and Er (p < 0.05).

H and Er of different sample preparation of IVD tissues. A = fresh cryosection, B = fixed cryosection, C = paraffin-embedded (n = 12 in each kind of preparation). NS: not statistically different (p > 0.5) and *: p < 0.05.
Dynamic analysis
The viscoelastic property of IVD is governed by two distinct mechanisms, namely a flow-dependent mechanism and a flow-independent mechanism. The first mechanism causes the frictional drag force to act on the interstitial fluid as it flows through the porous solid matrix of the cartilage tissue, whereas the other mechanism controls the time-dependent deformability of the solid matrix. Figure 8 shows the dynamic result for the E′, the E″, and the tan delta (tan δ) of the paraffin-embedded sample and cryosection sample. The mean E′ of the fresh cryosection sample, fixed cryosection sample, and paraffin-embedded sample are 4.370 ± 0.883, 4.683 ± 0.829, and 5.312 ± 1.095 GPa respectively. The mean E″ of the fresh cryosection sample, fixed cryosection sample, and paraffin-embedded sample are 0.727 ± 0.278 GPa, 0.871 ± 0.259 GPa, and 0.893 ± 0.357 GPA respectively. Moreover, the tan δ of the cryosection of the fresh cryosection sample, fixed cryosection sample, and paraffin-embedded sample is 0.251 ± 0.080 GPa, 0.211 ± 0.052 GPa, and 0.184 ± 0.049 GPA respectively.

E′, E″, and tan delta of different sample preparation of IVD tissues. A = fresh cryosection, B = fixed cryosection, C = paraffin-embedded (n = 12 in each kind of preparation). NS i: not statistically different (p > 0.05) and *: p < 0.05.
The E′ and E″ plots show the increasing trend from cryosection of fresh, fixed to paraffin-embedded sample, but the tan δ gives a decreasing trend. The fresh cryosection sample and fixed cryosection sample, there were no significant differences between the mean of E′ (p > 0.05), E″ (p > 0.05), tan δ (p > 0.05). Interestingly, between the fresh cryosection sample and the paraffin-embedded sample, it was found that there is no significant difference in the mean of E″ (p > 0.05) whereas, for the other properties, like the E′ and tan δ, significant differences were still found with p < 0.05 and p < 0.05 respectively.
IVD composition phase in XRD Pattern
The structure of the IVD tissue was also characterized using X-ray diffraction (XRD), and the XRD patterns of a representative sample are shown in Figure 9. Figure 9(a) shows as-collected XRD data. It is noted that the three samples in each kind of sample preparation showed identical spectra. Since the background signal from the glass substrate present in the collected spectra, the XRD pattern of the glass is properly subtracted from the collected spectra. The peak fitting of the subtracted spectra using the Voigt function is presented in Figure 9(b). The XRD pattern of the samples looks similar to that of collagen, as the IVD tissue mostly composes collagen. The characteristic peaks of collagen in the XRD pattern are reported to be a weak diffraction peak at ~8° and a broad hump at ~22°, indicating that the collagen sample has low crystallinity. 38 A broad reflection peak at ~21.5° corresponding to amorphous scatter from unordered components of collagen fibers, and the smaller peak at ~32° corresponding to the typical of the triple helical structure, are combined into this broad hump centered at around 22°. 39 The other broad and weak peak at ~43° also matches well with the reported XRD spectra for collagen.38,40 The peaks corresponding to collagen at ~ 8°, 21.5°, 32°, and 43° are shown with green areas in Figure 9(b). A sharp peak at ~50.3° could be seen in the spectrum of the paraffin-embedded sample is well-defined diffraction peaks of hydroxyapatite (HAP) 41 corresponding to (410) crystal plane with a hexagonal structure. The source of HAP should be the bony structure of IVD carried out during the sample preparation. Although the broad reflection peak for fresh cryosection at ~21.5° slightly shifts to ~21° for the fixed cryosection sample, the rest of the peaks do not shift. However, the shift for this peak for the paraffin-embedded sample is larger as this peak is centered at ~23°. Again, all other peaks do not shift for this sample. Interestingly, this broad reflection peak gets wider from fresh cryosection (width of 11.2°) to fixed cryosection ((width of 20.1°)). The highest value of width for this peak belongs to the paraffin-embedded sample with a width of 23.3°. The peak at 32° is attributed to the unit height assigned to the triple helix structure and for the paraffin-embedded samples, it is indicating disruption of the triple helix structure. 39 The other collagen peak at 43°gets a narrower width in paraffin-embedded compared to others. Overall, there is part of collagen components that gets more amorphous and the other part gets more crystalline.

The X-ray diffraction patterns of IVD tissue, (a) as-collected spectra and (b) after substrate background subtraction and deconvolution of the spectra. Three representative samples in each different sample preparation were measured. The XRD pattern of the tissues is comparable to that of collagen.38,39
Discussion
It was found that all types of tissue preparation methods employed reveal different tissue microstructures. Specifically, the preservation fixation affected fiber architecture in disc tissue, where the fiber can be seen more clearly than the fresh cryosection. Paraffin-embedded samples that show the clearest image might be advantageous to characterize different tissues of the disc using only optical microscopy equipped with the indentation instrumentation. The infiltration in the embedding process and defiltration in the deparaffinized process were expected to make the structure of the disc tissues in the paraffin-embedded sample easier to localize compared to the alternate preservation method.
Histological preparation was also found to alter the tissue composition, including the protein and other organic contents. Figure 3 shows the spectra containing bands of some proteins and water content in the samples. The presence of OH stretch in all samples at 3300 cm−1 indicated that the tissues soaked in the PBS solution had been hydrated during the biomechanical test. This hydration process can mimic the natural environment of the tissue.
The relative intensity of amide I and amide III peaks at 1656 and 1280 cm−1 relative to the phenylalanine peak at 1006 cm−1 reveals that sample preparation may reduce the intensity of the protein content. The intensity of fresh and fixed cryosection is comparable because the formaldehyde used for fixation can preserve the protein. 42 Significant changes were found in the paraffin-embedded samples compared to other preparation. We expected the reduction of protein intensity due to the polar solvent, such as ethanol used in the paraffine-embedded sample preparation because it makes the protein become soluble. 43
Deconvolution of Amide I at 1600–1700 cm−1 as shown in Figure 4 reveals the protein secondary structure changes in conformation that happened during the sample preparation. The secondary protein structures, α-helices, β-sheets, random coils, and turns were all modified. If the fixation process did not denature the secondary protein structure, 44 the Amide I spectra should be identical. However, this study shows significant spectral changes in the region assigned to the Amide I conformation. Formaldehyde is a reactive chemical, so the fixing process could result in chemical reactions leading to denaturation and altering the protein secondary structure even though it can preserve the protein quantity. 42 Similarly, alcohol in the paraffin embedding process strongly affects the protein, and it can denature the protein and harden the tissues. 45
The CH2CH3 stretching bands at 2800–3060 cm−1 indicate the organic content of the samples. Changes in these bands suggest that the samples were affected during the sample preparation. The presence of a new peak in fixed and paraffin-embedded samples at 2848 cm−1 as shown in Figure 5 indicates that the fixative solution resulted in reactions leading to changes in the spectra. The percentage area of the peak 2848 cm−1 of the paraffin-embedded sample is higher than for the fixed cryosection samples. It is possible that the residual alcohol during the paraffin embedding and deparaffined process also affected this CH2CH3 group. The increasing peak of the alkoxy group may indicate more alteration in collagen due to oxidation. 46
In terms of biomechanical properties, it can be said that there is no significant difference between the fresh cryosection sample and the fixed cryosection sample. The fixation is the only process that differs from the fresh and fixed cryosection samples. The OCT compound used to produce the tissue sections was made up of water-soluble glycols and resins and was solely utilized to stabilize the tissue during sectioning. It is a noninfiltrating supportive medium that is not present on the tissue surface when sectioned. As a result, it is not likely to have any effect on the biomechanical characteristics of the tissue. Therefore, it can be concluded that the formaldehyde used in fixed cryosection did not affect quasi-static properties (H and Er) and viscoelastic properties (E′, E″, and tan δ) of the tissues despite some changes in the protein secondary structure.
The biomechanical properties of the paraffin-embedded tissue changed most of all after the paraffin embedding process compared to fresh cryosection with its fewer processing steps. The paraffin-embedded tissue was processed in several stages of preparation such as dehydrating, paraffin embedding, chemical clearing, and deparaffinized. This caused the tissue to harden and denature. These steps were anticipated to be the excessive modification of the tissue matrix content and affect the biomechanical properties.
The phase of tissue structure was revealed by XRD analysis, shown in Figure 9. The peaks at 7.8° and 21.8° to the amorphous scatter of unordered components of collagen indicate that the unordered components of collagen fibers are sensitive to the preparation method and slightly increasing width indicating a more amorphous structure (except for the fixed sample, that slightly improves its crystallinity at 7.8°). The peak at 32° is attributed to the unit height assigned to the triple helix structure and for the paraffin-embedded samples, it is indicating disruption of the triple helix structure which means the collagen loses its flexibility. 47 The peak at 43°o indicated the components of collagen slightly gets more crystalline. We imply that the changes of the crystallinity in some components of collagen and the disruption of the triple helical structure of collagen can lead to the tissue altering its stiffness, and it is more prominent in affecting the mechanical characteristic of tissues. The presence of hydroxyapatite peak in the samples due to the bony structure contains nothing-to-do with the biomechanical properties. It is suspected that the structure coming from the outermost side of the section (part of rat vertebrae) was carried out during sample preparation. During the mechanical testing of the sample, the tissue part whether it is IVD tissues or bony structure can be clearly differentiated by an optical microscope. The XRD analysis of the samples provides supportive data that different sample preparation leads the changes in tissue structure that may affect the biomechanical properties.
It is very important to make sure that the preserved tissues should be comparable to fresh tissue in terms of their biomechanical properties and composition assessment. Sometimes, the use of a preservative solution is necessary to prevent tissue decay due to enzymatic and bacterial activity during the handling process. Formaldehyde, ethanol, and xylene used in this study are popular solutions for cell or tissue preservation.48,49 As discussed above, the use of solvents during sample preparation has the potential to modify tissue characteristics. In order to avoid the dramatic changes, especially in biomechanics and composition characteristics of tissue due to the preservative solution, the concentration of the solvent 42 and how long the tissue 50 is preserved should be taken into account.
The less processed cryosection of the fresh sample was intended to model, as close as possible, the authentic condition of unharvested tissue (in vivo). From this current study, therefore, fresh and fixed cryosection are more recommended for measuring the biomechanical properties of histological specimens for nanoindentation. The finding also suggests that nanoindentation will be more powerful if it is used with the Raman instrumentation in this study. By implementing this method, there is possible spatial characterization to assess the heterogeneity behavior of the tissues, especially in their biomechanics and composition. The limitation of this study is that the laser used in the Raman spectroscopy may still induce some damage to the tissue due to heat exposure. A laser can raise the temperature of the tissue, and it may cause the denaturation of proteins and collagen. 51 To improve the method in the future, the cooling system integrated with the Raman instrumentation should be built to reduce the temperature effects on the tissues.
Besides having the recommendation of tissue preparation for biomechanical and composition assessment, this study also reveals the biomechanical characteristics of IVD tissue on the microscale. The value of the Er can be compared to the results from previous research, which assessed the biomechanical properties of rat IVD on a macro scale. Table 1 shows the comparison of the Er in different testing. On the macroscale, the Er of rat IVD ranges from hundreds of kPa to MPa, whereas on the nanoscale, The Er of rat IVD is in the GPa range.
Er comparison of rat IVD in the different testing method.
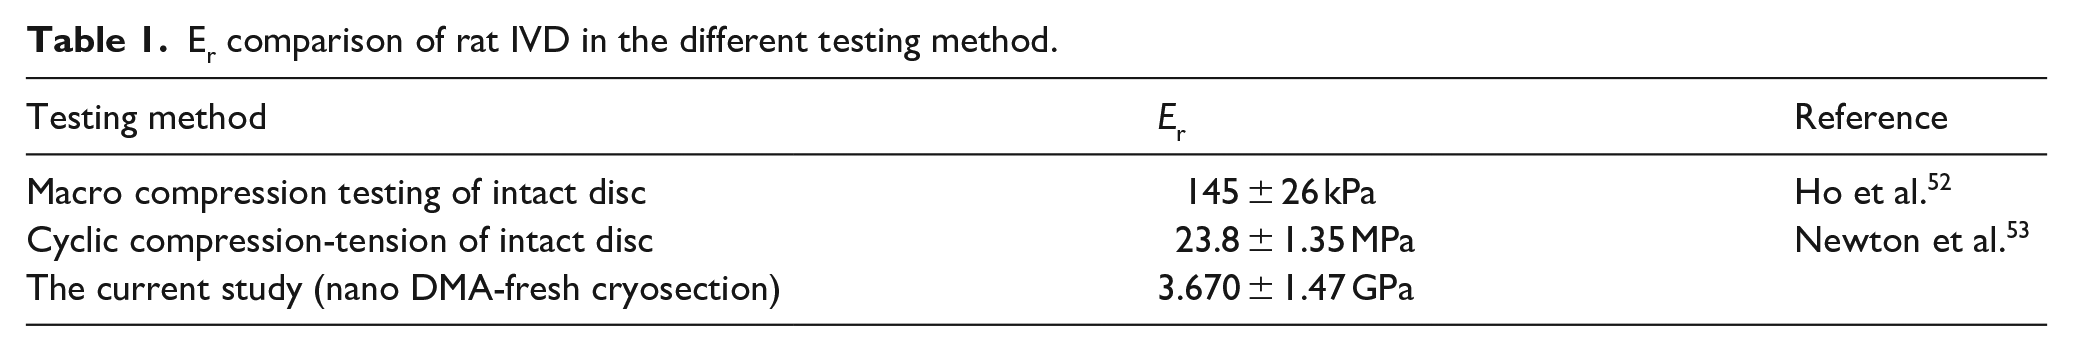
These differences may be because the IVD is considered a composite material where the matrix is composed of collagen fiber, elastin, and proteoglycans. Elastin has been reported to have an Er of approximately 1.1 MPa, 54 meanwhile a single collagen fiber has an Er ranging from 1.245 to 5.4 GPa. 55 The Er in this current study is in the range of a single collagen fiber Er value. This is because IVD is a collagen fiber-rich tissue, and the collagen fibers have a significant impact on the biomechanical properties of the tissue.
In summary, sample preparation is an unavoidable step used to characterize the biomechanical properties and the tissue composition, especially on the microscale. Developing accurate tools for assessing tissue composition and biomechanics at the microscopic scale is very important. The understanding of the biomechanical behavior of tissue at the microscale correlated with the composition will expand our capacity to analyze, investigate, and modify biological materials such as proteins, cells, and tissues, opening the gateway to a greater understanding of the mechanisms of action leading to better healthcare solutions.
Conclusions
The findings of this work give important information on how histological tissue preparation affects biomechanical characteristics and the resulting chemical composition at the microscale in soft tissue exemplified for rat IVD. Fresh and fixed cryosection samples are more promising to work with for biomechanical assessment in histological tissues. Moreover, the findings provided in this work fill an essential gap in the literature by providing valuable insight into the characteristics of IVD at the microscale. This study can also become a reference for a better approach to integrating the mechanical properties and chemical content of tissues, especially for IVD tissues. The future output of this study will be useful to assess the microscopic-biomechanical properties and tissue composition of different levels of IVD degeneration using ethical animal models. Correlating compositional changes, under different levels of degeneration, to the absorbing ability of the intervertebral disc will provide vital insight into clinical diagnosis and tissue engineering. The fundamental knowledge gained also can be applied in human research in different soft tissue.
Footnotes
Acknowledgements
We would like to acknowledge the Medical Device Innovation Center (MDIC) and Intelligent Manufacturing Research Center (iMRC) from The Featured Areas Research Center Program within the framework of the Higher Education Sprout Project by the Ministry of Education (MOE) in Taiwan and AC2T research GmbH (AC2T) in Austria (COMET InTribology, FFG-No.872176). The author also would like to thank the Human Biobank Research Center of Clinical Medicine, NCKUH for providing access to sample preparation.
Author contributions
A.A. and K.Y.H. performed study concept and design; A.A., K.Y.H., J.H., W.L.L., and M.R. performed development of methodology and writing, review and revision of the paper; A.A., J.H., and M.R. provided acquisition, analysis, and interpretation of data and statistical analysis; Y.R.J. provided technical and material support. All authors read and approved the final paper.
Declaration of conflicting interests
The author(s) declared no potential conflicts of interest with respect to the research, authorship, and/or publication of this article.
Funding
The author(s) disclosed receipt of the following financial support for the research, authorship, and/or publication of this article: This work was financially supported by the Ministry of Science and Technology of Taiwan (MOST108-2221-E-006-228-MY3, 109-2923-E-006-005-MY3, 110-2124-M-006-005-, and 111-2321-B-006-013-), National Cheng Kung University Hospital (Grant number: NCKUH-11002021 and NCKUH-11102057) and Air Force Office of Science Research (AFOSR) under contract no. FA4869- 06-1-0056 AOARD 064053.