
Abstract
The interaction of semiconductor nanoparticles with bio-molecules attracts increasing interest of researchers, considering the reactivity of nanoparticles and the possibility to control their properties remotely giving mechanical, thermal, or electrical stimulus to the surrounding bio-environment. This work reports on a systematic comparative study of the protein-corona formation on aluminum doped zinc oxide and gallium nitride nanoparticles. Bovine serum albumin was chosen as a protein model. Dynamic light scattering, transmission electron microscopy and X-ray photoelectron spectroscopy techniques have been used to demonstrate the formation of protein-corona as well as the stability of the colloidal suspension given by BSA, which also works as a surfactant. The protein adsorption on the NPs surface studied by Bradford Assay showed the dependence on the quantity of proteins adsorbed to the available sites on the NPs surface, thus the saturation was observed at ratio higher than 5:1 (NPs:Proteins) in case of ZnO, these correlating with DLS results. Moreover, the kinetics of the proteins showed a relatively fast adsorption on the NPs surface with a saturation curve after about 25 min. GaN NPs, however, showed a very small amount of proteins adsorbed on the surface, a change in the hydrodynamic size being not observable with DLS technique or differential centrifugal sedimentation. The Circular Dichroism analysis suggests a drastic structural change in the secondary structure of the BSA after attaching on the NPs surface. The ZnO nanoparticles adsorb a protein-corona, which does not protect them against dissolution, and in consequence, the material proved to be highly toxic for Human keratinocyte cell line (HaCaT) at concentration above 25 µg/mL. In contrast, the GaN nanoparticles which do not adsorb a protein-corona, show no toxicity signs for HaCaT cells at concentration as high as 50 µg/mL, exhibiting much lower concentration of ions leakage in the culture medium as compared to ZnO nanoparticles.
Introduction
Most of the colloidal suspensions tend to adsorb proteins on their surface when they are inserted into a biological fluid, thus leading to the formation of a superficial layer of proteins known as protein-corona. 1 The protein-corona can have a crucial impact on the stability of colloidal suspensions, avoiding the agglomeration of nanoparticles (NPs) and controlling their active surface area, which determine the diffusion characteristics of NPs. 2
Protein-corona can also alter the physiological properties of the NPs and their interaction with other molecules once in contact with the biological environment,3,4 affecting the process of cellular uptake.5,6 Mazzolini et al. 7 have demonstrated that lung-derived cells uptake of ceria NPs coated with serum proteins can be improved and a lower cytotoxic effect was evidenced. Depending on the NP size, chemistry or surface potential, the proteins can have different affinity for the NP surface, leading to the formation of a hard or a soft protein-corona, 8 which are defined by different dissociation constant, it being higher for the hard protein-corona, with respect to soft one.9,10 The wettability properties of the NPs can also affect the formation of protein-corona by changing its relative affinity, association, and dissociation rates. 11
In this study, we investigate the formation of the protein-corona on aluminum doped zinc oxide (ZnO) and gallium nitride (GaN) semiconductor NPs by using bovine serum albumin (BSA). This choice takes into account the fact that among all the proteins present in human plasma, albumin is the most abundant one and is vital for the maintenance of plasma colloidal osmotic pressure and transport of certain drugs and nutrients. 12 Several studies demonstrate that protein-corona is mainly due to albumin coating on NPs.13–15
The use of semiconductor NPs in biomedical applications has been actively explored in the last period, especially due to the potential utilization of NPs in controlled drug delivery and better imaging systems. Nevertheless, the knowledge about the interaction of NPs at biomolecular level is still rather limited and the subject requires deeper investigations.
The ability to remotely control the physical, chemical, or biological properties of some nanomaterials (NMs) using electromagnetic fields opens the way to the development of novel applications in nanomedicine. Functionalizing the NMs with specific biomolecules and integrating these materials within the artificial bio-scaffolds for tissue engineering, one can build “intelligent” prostheses and electronic skin,16–18 provide controlled drug release19,20 and other applications expected to facilitate advancements in human-machine interaction with a higher power independence and data communication.
One of the most promising materials at the intersection of nano-electronics and nanomedicine is GaN, a wide-band-gap semiconductor compound widely used in lighting technologies and nano-opto-electronics. Properties like biocompatibility, 21 high thermal stability, chemical inertness, 22 and piezoelectricity 23 make it a very promising material for biomedical applications such as biosensor platforms for High Electron Mobility Transistors (HEMT) able to detect cancer markers, 24 biological molecules as cytochrome-c, biotin, 25 C3G proteins by antibody-antigen conjugation, 26 or other specific molecules. The specified biosensor platforms usually require the functionalization of the transistors gate by specific molecules which allows for selective detection of the target of interest. However, there is a need for more detailed studies on the GaN NPs interaction with biomolecules aiming at exploring the protein-corona formation and interaction with living cells.27,28
ZnO represents a semiconductor compound with similar physical properties as of GaN, but in contrast ZnO has a very poor chemical stability, which might be of interest for avoiding bioaccumulation of NPs in smart drug delivery systems or improved imaging applications. ZnO represents a II–VI wide-bandgap semiconductor material with Eg = 3.37 eV at 300 K widely applied in practice due to its optical, mechanical, electrical, and piezoelectric properties. 29 One of the major advantages of ZnO is that it can be easily synthesized in different shapes like one- (1D), two- (2D), and three-dimensional (3D) nano-structures. Some of them include nanorods, 30 -helixes, 31 -springs and -rings, 32 -needles, 33 -ribbons, 34 -tubes, 35 -wires, 36 -sheets, 37 and tetrapods. 38
Due to the low cost and accessibility of a large variety of 3D shapes inherent to ZnO nanostructures, the material is intensively investigated in antimicrobial39,40 and other biomedical applications such as cell imaging, biosensing, and drug delivery.41,42 However, ZnO causes the release of Zn2+ ions, which have the ability to interact with enzymes, causing cytotoxic effects by inducing oxidative stress, mitochondrial dysfunction and lysosomal-induced degradation. 43 Moreover, Zn2+ ions are also involved in the cell apoptosis mechanism 44 which made it incompatible for biomedical applications despite its easy handling and low cost. Nonetheless, it was recently demonstrated that aluminum doping of ZnO NPs can improve the chemical stability of the material in biological medium, considerably reducing the Zn2+ ion release compared to pure ZnO NPs. 45
In this paper, we apply different techniques for qualitative and quantitative characterization of NPs-BSA complexes. We employ the Circular Dichroism (CD) to investigate structural changes of the proteins once adsorbed on the NP surface compared to the protein alone, X-Ray Photoemission Spectroscopy (XPS) for the characterization of the pristine and BSA coated NPs surface chemistry, dynamic light scattering (DLS) for the characterization of NPs size distribution and zeta potential. The NPs-BSA morphology was studied with electron microscopy techniques SEM and TEM and the quantitative BSA adsorption on NPs was measured by Bradford protein assay. Additionally, we explore the stability of the NPs in Dulbecco’s Modified Eagle’s Medium (DMEM), which then was used to grow Human keratinocyte cell line (HaCaT) and investigate the biocompatibility of our NPs by Colony Forming Efficiency assay.
Materials and methods
The aluminum doped ZnO (CAS: 1314-13-2), further referred in the text as ZnO, and GaN (CAS: 25617-97-4) NPs were purchased from Sigma Aldrich in the powder form. The BSA used in the experiments was purchased from Sigma Aldrich in lyophilized powder form with purity >96%.
ZnO suspension preparation
The solvent used for the preparation of ZnO suspension consists of ultrapure deionized water (Millipore, MilliQ System) with the conductivity of 18.2 MΩ × cm and the pH of 5.9.
A stock suspension of NPs with concentration of 10 mg/mL was prepared initially in an Eppendorf tube. 1 mL of DI water was added to 10 mg of NPs. The suspension was sonicated for 15 min in a Hielscher Vial Tweeter at 75% amplitude and 50% Duty Cycle. Further dilutions were prepared in fresh diluent (DI water). Prior to each dilution, the stock suspension with NPs was sonicated again for 1 min and vortexed for 30 s. The stock suspension was used only until the level dropped down to 0.2 mL.
GaN suspension preparation
The GaN suspension was prepared in 0.5 mM aqueous solution of sodium citrate (Na3C6H5O7). The prepared 10 mg/mL suspension was sonicated for 15 min in a Hielscher Vial Tweeter at 75% amplitude and 75% Duty Cycle in order to destroy larger clusters. The suspension was left for self-sedimentation for 12 h and then a 50% volume of the supernatant with smaller particles was collected and transferred or diluted for further experiments. According to the Inductively Coupled Plasma Mass Spectrometry (ICP-MS) measurements, the collected supernatant had a concentration of 1.55 mg/mL of NPs compared to 10 mg/mL as it was in the initial suspension.
BSA solution preparation
A BSA stock solution was prepared with concentration of 10 mg/mL in ultrapure deionized water, mixed gently in order to exclude foam formation and kept in the fridge at 4°C overnight before the complex preparation. In the final step, the desired concentration of BSA from the stock suspension was added to the suspension with NPs in an Eppendorf tube. The incubation time was 60 min at room temperature, with the complex mixed in a rotary mixer at 30 rpm.
TEM analysis
For transmission electron microscopy (TEM) analysis of NPs and NP-Protein complexes, the TEM instrument JEOL JEM 2100 (JEOL, Italy) was used operating at 120 kV. Three microliter of each suspension were dropped on a Formvar Carbon coated 200 mesh copper grids (Agar Scientific, USA) and kept in a desiccator overnight for water evaporation. The size distribution was assessed by ImageJ/Fiji software (open-source, https://imagej.net/software/fiji) using NanoDefine ParticleSizer plugin (Thorsten Wagner, https://imagej.net/plugins/particlesizer) and the data were elaborated by Origin software (OriginLab, Northampton, MA, USA).
Hydrophobicity quantification
In order to have a complete physicochemical characterization, the hydrophobicity of ZnO and GaN NPs was assessed through a method based on dark field microscopy (DFM), successfully applied with other NMs. 46 Briefly, this technique allows quantifying the surface energy components by measuring the NMs binding affinity to different engineered surfaces (hydrophilic and hydrophobic collectors), in terms of number of particles adsorbed as a function of time, and mathematically deriving their polar component of the surface free energy using the eXtended Derjaguin Landau Van Overbeek (XDLVO) theory. 47
The NM’s surface energy, in particular the hydrophobicity degree, was determined by comparing the NPs binding affinity for three different collectors (hydrophobic, hydrophilic negatively charged, and hydrophilic positively charged).
For this purpose, the prepared suspensions were diluted in a 10 mM phosphate buffer (PB) pH 7.18, to partially neutralize the surface charges from the NPs and to avoid water interference between the sample and the hydrophobic surface, before the dark field acquisitions.
These measurements were performed in a static mode by injecting 20 µL of the samples in a channel of a microfluidic cell mounted on the surfaces.
The analysis of the images was performed through the software ImageJ and its Trackmate Plugin. The whole process consists in an automatic detection of the particles for each frame, and the tracking of their positions within the sequence of frames. This automatic calculation allows obtaining the number of bound particles per unit of time, corresponding to the adsorption rate of the material on the collector. The analysis was done on six different areas for each image sequence for statistical analysis.
The last step of the data analysis and the calculation of the equivalent contact angle values, using the XDLVO theory, was performed with Microsoft Excel®.
This analysis was done through a programed solver based on different macros imported in an Excel file. The main operation of this process is the linear fitting of the binding curves, previously calculated by TrackMate. These values were used to solve an equation system based on the XDLVO theory. The calculation tool returns the value of the polar component of the surface free energy of the particles (γNAB), which is directly related to the hydrophobicity degree of the particles and is converted in an equivalent contact angle value (CAeq).
Size distribution and Zeta potential measurements
The equipment used for average hydrodynamic size distribution and Zeta Potential measurement was a dynamic light scattering (DLS) ZetaSizer Nano ZS (Malvern Panalytical, UK). For the size distribution determination, 400 µL of prepared suspension was used. For every measurement, the acquisition was realized during 10 runs with 10 s each run at 25°C in the backscattering geometry at 173°. The Zeta Potential measurements were conducted in DTS1070 cells during 10 runs with 10 s for each measurement and a delay of 10 s between the measurements. Measurements were performed after suspension dilution in water until the attenuation factor of the instrument was between 6 and 8.
Protein adsorption determination on NP surface by Bradford assay
The concentration of BSA adsorbed on the NP’s surface was determined by Bradford Assay colorimetric method using the indirect quantification. The samples were prepared as it was described above. After 1 h incubation time at different NPs:BSA ratios, keeping the BSA at constant concentration of 50 µg/mL, the samples were centrifuged at 15,000g for 15 min in order to sediment the formed NP-BSA complex. For investigation of the adsorption speed of proteins on NPs surfaces, suspensions consisting of NPs and BSA at 5:1 ratio were used. An 800 µL of supernatant which consists of unbound proteins, was collected and analyzed with a Thermo Scientific Evolution 350 UV/Vis spectrophotometer. The calibration curve for determining the protein concentration from the solution was obtained by micro assay protocol according to the Bradford manufacturer. The protein concentration was determined by measuring the absorption at 595 nm.
Surface analysis by XPS
The surface chemistry was assessed by X-Ray Photoemission Spectroscopy (XPS) using an Axis Ultra-DLD spectrometer (Kratos Analytical, UK), as described in previous works. 48 Briefly, the samples were prepared by drop casting 100–150 µL of suspension on a clean silicon wafer or, in case of powders, by fabricating pellets (1 cm in diameter) using a mechanical press (5 MPa).
Three wide scan spectra (0–1200 eV binding energy) and two core level spectra were recorded on each sample. The survey scan was carried out in hybrid mode, “slot” and FoV2 at 80 and 160 eV pass energy, whereas core level spectra were recorded in “hybrid” mode using pass energy of 20 eV.
Moreover, selected samples were also analyzed after ion cleaning (Ar+ 2 keV, p = 8 × 10⁻⁷, I = 1.5 µA). The spectra were processed with CasaXPS software (www.casaxps.com). Samples compositions were obtained from the survey scans using the relative sensitivity factors (RSF) provided by Kratos Analytical, whilst peak fitting was performed after a Tougaard U3-type background subtraction and without preliminary smoothing.
Structural changes of BSA
The changes of the secondary structure of the proteins after their interaction with NPs were investigated by Circular Dichroism (CD) technique. The instrument used for analysis was a Jasco J-815 CD Spectropolarimeter with the samples placed in a quartz cuvette with 5 mm optical path. The concentration of BSA (50 µg/mL), was kept constant in the sample (NP:BSA 2:1 ratio) and in the control sample (protein alone).
NP:BSA complex was incubated for 60 min at room temperature on a rotating wheel, then centrifuged at 15,000g for 15 min. Supernatant with unbound proteins was removed and replaced with the same volume of ultrapure deionized water. Then, the suspension was sonicated in the Sonication Tweeter for 20 s at 40% amplitude and 40% Duty Cycle. Finally, 500 µL of suspension were transferred in the quartz cuvette for measurements. The data from CD spectra were fitted with known models on the Dichroweb – online-based service in order to have a quantitative estimation of the secondary structure of proteins.49,50
ICP-MS analysis
ZnO and GaN NPs suspensions either in ultrapure deionized water or culture media were centrifuged at different time-points at 30,000g for 20 min and supernatants were collected for elemental analysis and biocompatibility testing. The supernatants were then diluted 1:10 in ultrapure deionized water and analyzed through ICP-MS using a PerkinElmer Nexion 300D quadrupole ICP-MS (PerkinElmer, Waltham, MA, US) operating in standard mode. The dissolved ionic standard for Zn and Ga were purchased from Sigma-Aldrich (St. Louis, MO, US). The six-points calibration curves for both the analytes were built by diluting ionic standards in ultrapure deionized water with concentrations ranging from 0 to 200 μg/L. Analytes concentrations in the supernatants were reported as means of five consecutive measurements.
Cell culture and Colony Forming Efficiency assay
In vitro experiments were performed on HaCaT (immortalized human keratinocyte cell line), kindly provided by Prof. Norbert E. Fusening, Deutsches Krebsforghungszentrum.
Cells were seeded in 12 well plates at a density of 200 cells/well (9.6 cm2 bottom surface area, Falcon, Italy; six replicates for each treatment, 3 runs in total) in 1 mL of complete culture medium/well (DMEM supplemented with 10% heat-inactivated fetal bovine serum, 5 mM L-glutamine, 100 U/mL penicillin-streptomycin) and exposed for 48 h to 0.5, 1, 5, 10, 25, and 50 µg/mL of GaN or ZnO NPs, to evaluate their biocompatibility as previously described. 51 The solvent obtained from the stock suspension after a centrifugation at 30,000g for 20 min was used as negative control. An internal positive control to confirm complete cell death was also included. Data analysis was performed by one-way ANOVA (GraphPadPrism4 statistical software, GraphPad Inc., CA, USA) and expressed as Colony Forming Efficiency (CFE) % of negative control (100% cell survived).
Results and discussion
Figure 1(a) and (d) illustrates the TEM images of ZnO and GaN NPs. The primary size distribution graph of ZnO NPs in Figure 1(b), shows a large amount of NPs with dimensions in the range of 10–15 nm. However, the material shows a noticeable polydispersity with NP sizes up to 120 nm.
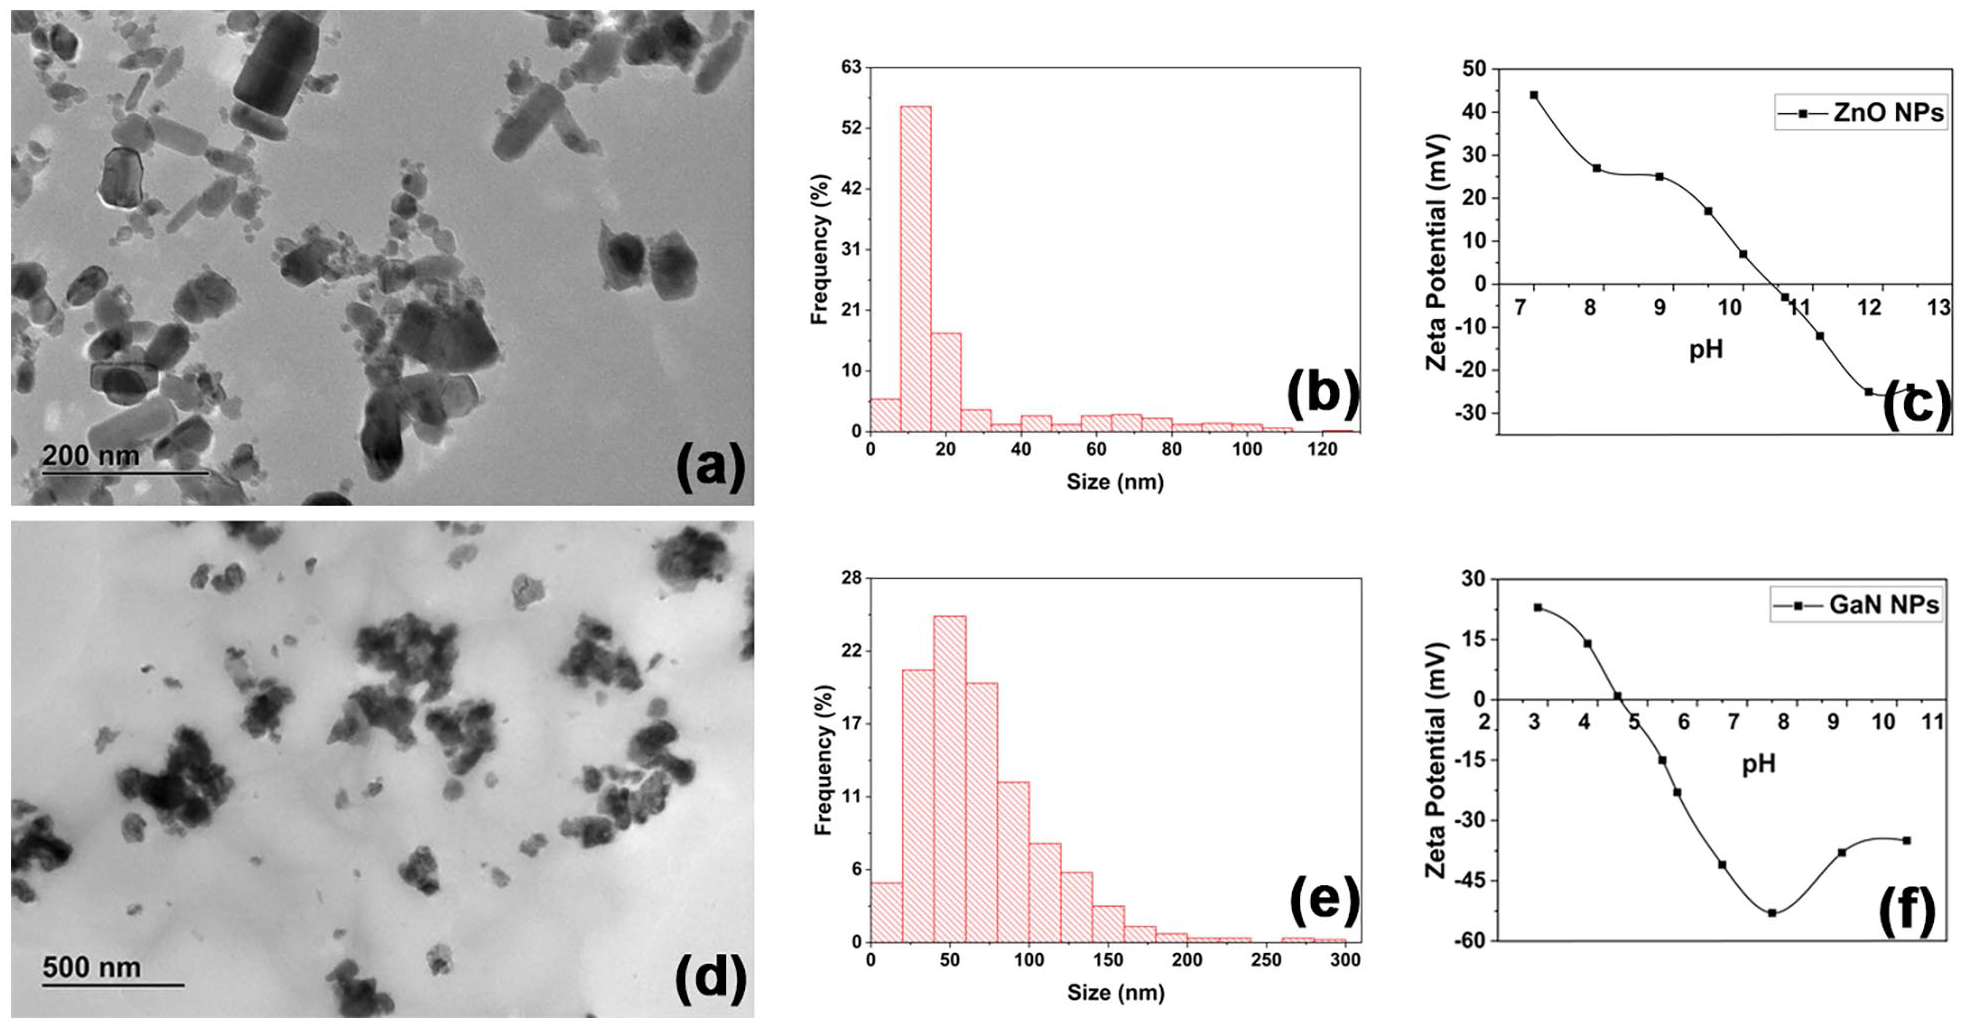
Characterization of nanoparticles: TEM images of ZnO (a) and GaN (d) NPs; size distribution histograms (b and e); Zeta Potential versus pH titration of NPs (c and f).
In case of GaN NPs (Figure 1(e)), even after sedimentation of bigger clusters, large particles with dimensions up to 300 nm are still present. However, the maximum number of particles show a size of about 50 nm.
In order to assess the suspension stability, titration curve was performed for both NPs suspensions by adjusting the pH with 0.1 M HCl or 0.1 M NaOH. The isoelectric point (IEP) of ZnO and GaN suspension was at pH of 10.5 and around 4.5, respectively, as shown in Figure 1(c) and (f). ZnO NPs were dissolved at pH below 6.5, and it was not possible to measure the zeta potential.
Hydrophobicity measurements
The characterization of ZnO and GaN NPs hydrophobicity was performed by recording the dark field image sequences and by measuring the NPs adsorption rates to the three different collectors in three runs. These NMs, in order to measure their hydrophobicity, were dispersed in PB, which guarantees an adequate ionic strength to the samples. The analysis was performed through a combination of ImageJ software and Microsoft Excel®, equipped with an automatic solver. This tool returns the value of γNAB, the polar component of the surface free energy of the NPs, which corresponds to the hydrophobicity degree of the particles, expressed as equivalent contact angle (CAeq).
The results, together with NPs size and ζ potential values determined from DLS measurements, are reported in Table 1.
Hydrophobicity tests of ZnO and GaN NPs.

The collected data reveal a more hydrophobic character for the ZnO compared to GaN NPs. Note that a NM is considered hydrophobic when the CAeq is higher than 90° or γNAB value is near to 0 mJ/m2, while is hydrophilic when the CAeq is lower than 40° or γNAB value >5 mJ/m2.
Hydrophobicity, among all the physical and chemical characteristics, has a crucial role in the chemicals risk assessment and in the prediction of the NM fate interacting with a biological system (e.g. aggregation, bioaccumulation, biocorona formation, etc.). Moreover, as stated by the OECD in 2018, hydrophobicity can provide important information on the affinity of nanomaterials to complex environmental matrices and organisms. Protein adsorption on hydrophobic surfaces is driven mostly by the attraction of nonpolar sections of protein toward the surface. 52 Yu et al. 53 demonstrated that by tuning the hydrophobicity degree of gold NPs with different ligands, it is possible to control the amount of adsorbed proteins on the NP surface. Indeed, the more hydrophobic the NP’s surface is, the more it can attract proteins (even to double their amount), compared to the more hydrophilic NPs. Also it was observed that protein exchange rate can be higher in case of hydrophilic NPs than hydrophobic ones.
Size distribution and Zeta potential
The hydrodynamic size distribution of the samples was measured after diluting the NPs at concentration of 100 µg/mL. In Figure 2, the hydrodynamic size distribution of ZnO NPs dispersed in ultrapure deionized water as well as Zeta Potential (ZP) are shown. The ZnO control sample shows an average hydrodynamic size of 123 ± 53 nm and ZP of +26 ± 6 mV. The larger average size observed with DLS compared to primary size from TEM images, can be attributed to the presence of the Stern layer, particle’s aggregation or to the Mie scattering effect. Since a short sonication process results in the presence of NPs aggregates, and longer sonication would lead to temperature increase of the suspension (which also stimulates formation of aggregates), the best average size distribution was found by using the described above protocol for suspension preparation. After incubation of NPs with BSA at ratios of 1:1 and 1:5 by mass (NP: BSA) the size increased by about 14 nm suggesting that the ZnO NPs are fully covered by proteins. The ZP changed to negative value of −17 ± 4 mV, suitable for the interaction with cell membrane. By contrary, increasing the ZnO concentration to 5:1 ratio and higher, a larger size distribution was observed, which suggests that the NPs are not fully covered and agglomeration starts. Note that the “dispersal of a high concentration of NPs in solution containing certain proteins such as fibrinogen, may lead to agglomeration due to the formation of proteins inter-particle bridges,” as previously reported.54,55

Hydrodynamic size distribution and Zeta Potential measurements of ZnO (a and c) and GaN (b and d) nanoparticles-BSA complexes at 1:1, 1:5 and 5:1 ratio. The control measurement of bare nanoparticles is presented in black.
In case of GaN suspension, no changes were seen in the average size distribution, however the ZP changed from −54 ± 6 mV of the control sample to −21 ± 6 mV once the proteins were added at the mass ratio 1:5 (GaN:BSA).
Quantitative analysis of proteins adsorption on NPs
The amount of BSA adsorbed to NPs surface at different ratios (1:1, 1:2, 1:5, and 1:10) is shown in Figure 3(a). A saturation level can be observed at the ratio of 1:5 (BSA:NPs) in case of ZnO, however a much less quantity of BSA was adsorbed on GaN NPs even at higher ratios.

Quantitative analysis of BSA adsorption on ZnO surface at different NPs-BSA ratios (a). The dynamic of the association of the BSA on ZnO NP surface (b). TEM images of protein corona formed on ZnO (c) and GaN (d) particles.
On the hydrophilic surfaces, it was found that molecules can be orientated parallel to the surface, which enables multiple electrostatic interactions. 52 On the other hand, on a hydrophobic surface, as it is the case of ZnO NPs, the methyl groups of BSA are oriented randomly and more molecules are adsorbed, as compared to the number on a hydrophilic surface. 52 The adsorption speed of BSA on the ZnO NP surface (1:5 ratio) was investigated every 12 min during 1 h (Figure 3(b)). Supernatant analyzed at each time-point shows a fast adsorption rate in the first 25 min of incubation, and then it slows down suggesting limiting sites for protein binding and a reduction of free proteins in the supernatant.
TEM images proved the formation of protein corona in case of ZnO-BSA complex, however for GaN-BSA complex no visible coating formed on the surface of NPs was observed (Figure 3(c) and (d)).
XPS analysis
The quantitative data extracted from XPS analysis of ZnO samples before and after immersion in a BSA solution are presented in Figure 4. The initial ZnO powder show the presence of a high amount of oxygen suggesting a deviation from the stoichiometric composition: ZnOx (x > 1). Some carbon (up to about 8 at%) is also evidenced. The amount of carbon increases strongly (up to 22 at%) in the ZnO suspension, whilst the Zn/O ratio decreases from 0.67 to 0.44. This is indicative of a large hydrocarbon contamination with possible presence of hydroxyls and carbonyl moieties. After immersion into the BSA suspension, N 1s peak is clearly observed (~15 at%) and the Zn signal is strongly reduced. Moreover, both carbon and oxygen contents increase. The quantitative analysis of ZnO powder, BSA suspension and the formed ZnO-BSA complex is presented in the Supplementary Information (Table S2). These results are indicative of the presence of a protein layer onto the ZnO NPs. Furthermore, the large difference in the shape of the spectra background is also an indication to the protein corona formation on the ZnO NPs. 56 The estimation of the BSA film thickness using the model proposed by Shard 57 and assuming a ZnO NP diameter of 13 nm, gave an average protein layer thickness of 4.77 ± 0.005 nm. However, this value should be taken only as an indication because the estimation is based on the particle size data obtained by TEM and under assumption of monodispersed suspension and NP sphericity.

XPS survey spectra of ZnO samples, with attribution of the principal emission lines, data in the inset illustrate the derived atomic abundances: (a) ZnO powder, (b) ZnO – BSA complex.
The XPS data of the GaN NPs are more complex to interpret. This is due to the superposition of the Ga Auger transitions with the N 1s and C 1s photoelectron peaks independently from the X-ray source (either MgKα or AlKα used (Figure 5(a))). In particular, the quantification is unreliable because of the impossibility to account for the content of both nitrogen and carbon. The analysis of the core level spectra can only partially help in solving this issue; in fact the position of the Ga 3d doublet (Figure 5(b)) is compatible with the GaN(O) type of bond indicating the presence of both Ga-N and Ga-O.58–61 However, no clear spin-orbit splitting is observed as in the case of pure GaN. This is supported by the O 1s spectrum (Figure 5(d)) showing two components attributable to GaOx bonds (531 eV) and carbon-oxygen moieties (about 532 eV). The C1s core level spectrum reveals a major component at about 285 eV related to hydrocarbon and minor ones at about 286.5 and 288 eV attributable to carboxyl (Figure 5(c)). In order to obtain more information, a slight Ar ion etching (2 keV, 5 min) was carried out. The Ga 3p, O 1s and N 1s spectra recorded after etching are illustrated in Figure S1 of Supplementary Information. The O 1s and N 1s core level spectra suggest the presence of Ga-N and Ga-O interconnected structures. Unfortunately, quantitative analysis of GaN samples after immersion in BSA suspension could not provide information about the protein overlayer because of the absence of a specific element in either the inorganic or the organic sample component.

XPS analysis of GaN pristine powder: (a) survey spectra collected with Al and Mg sources; and high-resolution spectra with resolved peak components and normalized residuals of the (b) Ga 3d, (c) C 1s, (d) O 1s, and (e) Ga 3p regions.
Structural change of BSA
In order to analyze the structural changes of the proteins after interaction with NPs, the CD spectra of the complex with the ratio 2:1 (NP:BSA) was compared to the spectra of the BSA alone (Figure 6). The results suggest a drastic modification in the secondary structure of the BSA when bound on the NP’s surface. According to Lynch and Dawson 62 “structural changes of the protein corona are biologically meaningful, as it may lead to destruction of physiological homeostasis and uncontrolled immune response.” The size of the NP, shape, surface area, charge, roughness are just few of the aspects that can influence the conformation of BSA bonded to the NP. 63
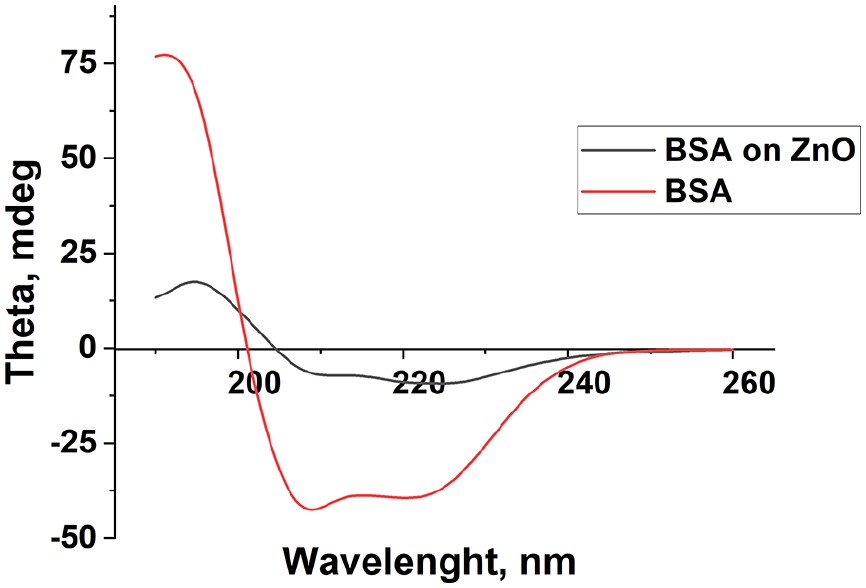
Secondary structure analysis of BSA alone and BSA adsorbed on ZnO NPs from CD spectra.
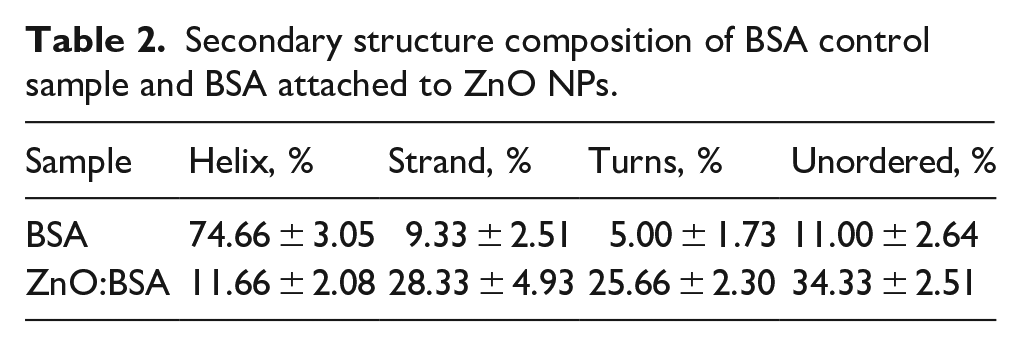
Table 2 presents the percentage of BSA and of ZnO-BSA complex secondary structures. The number of α-helixes decreased from about 75% to 12%, the other structures increased as follows: β-sheets (from about 9% to 28%), the turns (from 5% to 26%) and unordered structures (from 11% to 32%) showing a high rearrangement of BSA protein structure.
Secondary structure composition of BSA control sample and BSA attached to ZnO NPs.
Chemical stability of NPs in cell culture media and cytotoxicity tests
For the analysis of the NPs chemical stability in the DMEM culture medium, a series of samples with a concentration of 50 µg/mL was analyzed in terms of ions release. For this, the prepared suspensions were centrifuged every 24 h and the supernatant was analyzed by ICP-MS. Figure 7(a) shows an increasing trend of Zn2+ ions release in the supernatant during 3 days of incubation in DMEM, suggesting a dissolution of about 11.2%, 12.8%, and 14.4%, respectively (detailed dataset is shown in Table S3, Supplemental Information). A higher dissolution rate of ZnO was observed in the first 24 h, as observed previously by other groups, 64 and reached almost a plateau after 48 h. GaN NPs showed a better chemical stability in DMEM compared to ZnO, the dissolution being around 1.4%, 1.7%, and 1.7%, respectively, for the same incubation time. The ions release in as-prepared suspensions (ultrapure deionized water) is also presented for comparison in Figure S2 of the Supplemental Information. A higher dissociation rate of ZnO NPs in cell culture medium (compared with water) was also observed by other groups64–66 and could be attributed to interaction between NPs and amino acids or proteins creating a complex of high solubility.67,68 Zn2+ can bind to electron donors such as phosphate groups and carboxylate and possibly with amino groups present in the culture medium. Metallic ions release in the culture medium is an important aspect to be considered when studying NPs cytotoxicity. Zn2+ ions for example, could potentially disrupt cellular zinc homeostasis, 69 and lead to the generation of ROS and the subsequent oxidative stress, 70 lysosomal and mitochondrial damage and ultimately cell death.

Concentration of Zn2+ ions released from ZnO nanoparticles and Ga3+ ions released from GaN nanoparticles in DMEM solution measured by ICP-MS (a) and HaCaT cells viability after incubation with ZnO, (b) and GaN, (c) NPs for 48 h. Data analysis was performed by one-way ANOVA and expressed as CFE % of negative control (100% cell survived).
Our results confirm the chemical stability of GaN NPs similar to the one of epitaxial layers demonstrated to be highly biocompatible with very low amounts of Ga3+ ions released in the suspension, as reported by Jewett et al. 71 The XPS analysis of NPs shows large amount of O and C species on NP surface even after few minutes etching with the Ar+ ions (Supplemental Information); one can suggest that these species could be incorporated as interstitials or impurity phases into the material and influence the dissolution rate of NPs.
Hydrodynamic size distribution of ZnO and GaN NPs in DMEM culture medium by DLS was explored to determine NPs stability. Figure S3 shows an increasing size in the first hour after incubation of particles in DMEM, however, further size change after 24 or 48 h of incubation has not been observed. It should be mentioned that sedimentation occurs in time, but a gentle mixing helps in good redispersion of particles in the medium.
HaCaT cells viability was highly affected after 48 h of incubation with ZnO NPs in concentrations above 25 µg/mL (Figure 7(b)). The IC50 was estimated between 25 and 10 µg/mL. The toxicity of higher concentrations of ZnO NPs might be related to the release of Zn2+ ions in the medium, observed by ICP-MS. ICP-MS measurements showed the release of a higher amount of Zn2+ ions compared to Ga3+ ions (around eight times more) starting from the same concentration of NPs. HaCaT cells incubated with different concentrations of GaN NPs show no toxicity signs at concentrations as high as 50 µg/mL (see Figure 7(c)), nevertheless further increase in the GaN NPs concentration leads to gradual reduction in the proliferation of the cells. Although GaN is known to be chemically inert, 72 the high uptake ability of NPs by living cells could possibly affect cell metabolism 73 and therefore cell viability.
Conclusions
A comparative study of the protein-corona formation on ZnO and GaN NPs was performed. It was found that BSA has strong affinity to ZnO NPs as compared to GaN nanoparticles in the same size range. The binding of proteins to the ZnO nanoparticles surface is demonstrated using DLS and TEM measurements. The binding results in a size increase by about 14 nm in BSA:ZnO NPs (5:1 ratio), which correlates well with the thickness of a single layer of proteins on the surface of the NPs. On the other hand, GaN NPs size did not increase suggesting no corona formation. According to the CD analysis, the ZnO NPs drastically influence the secondary structure of the proteins attached to their surface, thus affecting protein function. Furthermore, proliferation of HaCaT cells was influenced more drastically by ZnO NPs as compared with GaN NPs in the same conditions of incubation. The fact that a comparable cytotoxicity is seen in cells exposed to ZnO NPs (at concentrations higher than 25 µg/mL) and cells exposed only to solvent can be explained assuming the toxicity to be caused by the release of toxic ions or by the combination of the release of ions and presence of the NPs. In contrast, GaN NPs were inert to the formation of BSA corona and showed good chemical stability in DMEM culture medium, demonstrating better biocompatibility in comparison to ZnO NPs under the same conditions and showing the cytotoxic effect only at concentrations above 70 µg/mL. These results are important for further development of NMs for biomedical applications implying NPs as active elements for sensors or platforms for drug delivery systems.
Supplemental Material
sj-docx-1-jbf-10.1177_22808000221131881 – Supplemental material for Protein-corona formation on aluminum doped zinc oxide and gallium nitride nanoparticles
Supplemental material, sj-docx-1-jbf-10.1177_22808000221131881 for Protein-corona formation on aluminum doped zinc oxide and gallium nitride nanoparticles by Vladimir Ciobanu, Francesco Roncari, Giacomo Ceccone, Tudor Braniste, Jessica Ponti, Alessia Bogni, Giuditta Guerrini, Domenico Cassano, Pascal Colpo and Ion Tiginyanu in Journal of Applied Biomaterials & Functional Materials
Footnotes
Acknowledgements
Authors would like to acknowledge Dr. Dora Mehn for technical support.
Declaration of conflicting interests
The author(s) declared no potential conflicts of interest with respect to the research, authorship, and/or publication of this article.
Funding
The author(s) disclosed receipt of the following financial support for the research, authorship, and/or publication of this article: This research was funded by the European Commission under the Grant #810652 “NanoMedTwin” and by the Ministry of Education and Research of the Republic of Moldova under the Grant #20.80009.5007.20.
Guarantor
VC
Supplemental material
Supplemental material for this article is available online.
References
Supplementary Material
Please find the following supplemental material available below.
For Open Access articles published under a Creative Commons License, all supplemental material carries the same license as the article it is associated with.
For non-Open Access articles published, all supplemental material carries a non-exclusive license, and permission requests for re-use of supplemental material or any part of supplemental material shall be sent directly to the copyright owner as specified in the copyright notice associated with the article.