
Abstract
The conventional micro-computed tomography (μCT) is a non-destructive imaging technique used for obtaining 2D and 3D information for scaffolds. The main composition and internal structure are important in mimicking and designing the characteristics of natural bone. This study was three-dimensional evaluating the external or internal structures and the hydration effects of bone graft materials by using the in-situ image technique. Synchrotron radiation micro-computed tomography (SR-μCT) was used to extract information on the geometry of two biphasic calcium phosphates (BCP) with identical chemicals and different micro-macro porosity, pore size distribution, and pore interconnection pathways. Volume analysis by hydration was used to measure the two bone graft materials at 0, 5, and 10-min intervals. The SR-μCT image was achieved with information regarding the internal pore structure and hydration effects evaluated under 3D visualization. Both types of bone graft materials showed structures suitable for tissue engineering applications. The SR-μCT in-situ techniques with 3D information provided a detailed view of the structures. Thus, SR-μCT could be an available, unbiased 3D alternative to in-situ analysis.
Introduction
Bone grafting is a surgical procedure that is performed in order to structurally and functionally recover periodontal tissue that has been damaged or lost due to periodontal disease. 1 Bone grafts are classified into four types autologous bone, allogeneic bone, xenogeneic bone, and synthetic bone. The autologous bone graft is used as a standard bone graft material for the regenerative treatments. 2 However, autogenous bone grafts require a secondary surgery, and large amounts of bone mass are not collected. Moreover, where the allogeneic bone originates is not clear, it is expensive, leading to theoretical risk of cross infection or immune response. 3 Xenograft bone uses bone obtained from an animal, it was suggested that the absorption rate is slow so that the particles of the bone graft can be separated from the bone tissue of the graft, and disease can result from the pathogenicity of the graft. 4
Conversely, synthetic bone graft material confers protection from disease metastasis, and this material is inexpensive and easy to obtain. 5 Therefore, research into making a more ideal synthetic bone graft material continues. Synthetic bone grafts are made by combining several materials, and clinical studies using various synthetic bone graft materials have gradually improved the results. 6 Synthetic bones must have the chemical, biological, and mechanical properties necessary to promote normal cell function. 7 Therefore, the main composition and internal structure are important in mimicking and designing the characteristics of natural bone. Specifically, a three-dimensional scaffold structure greatly influences tissue interaction according to the porous arrangement.8,9 This 3D structure is generally extremely complex, and the interaction between pore size and internal pores varies depending on cell movement, vascularization, fluid flow, and mechanical properties. The pore size reportedly exhibits the most efficacy in new bone formation at 100 to 300 µm. 10 However, the pore size is highly dependent on the results of the measurement method. The structure of synthetic bone graft material is generally evaluated in a dry state, which may not be accurate as this process involves hydration that can change the three-dimensional structure.
Several methods are used to analyze the scaffold structure. A conventional approach is the SEM image analysis, which measures various structural parameters. SEM image analysis provides precise visualization and is easily accessible. However, there are many limitations, such as it is limited to two-dimensional measurements based on sectioning, and the pretreatment method of destructive testing. Moreover, it is impossible to distinguish closed and open pores in the SEM images. Also, porosity can be assessed by using alternative methods (mercury intrusion porosimetry and gravimetry) measured by liquid displacement or mercury intrusion.11,12 However, in some of the bone graft materials, the application of these methods alters the structure due to swelling as the hydrophilic compound expands.
Thus, by avoiding the demerits of SEM image analysis, conventional micro-computed tomography (μCT) is a non-destructive imaging technique used for obtaining 2D and 3D information for scaffolds. The μCT provides two-dimensional analysis based on individual sections or independent three-dimensional model analysis. The basic parameters are volume, internal structure, open porosity, pore size, and three-dimensional structural evaluation to provide a detailed view. Most of the previous studies have generally evaluated these parameters in dry conditions.9,13–15 However, the importance of the hydration associated with structural changes precedes implantation in the body. For example, the bone graft material is exposed to saline solution to facilitate handling before implantation at the defective site. In addition, its exposure to patient’s blood at the defective site. To measure the change in the internal structure of the bone graft material in relation to its hydration, the change over time was measured using X-ray µCT.16–18 µCT is an easily accessible program that can be optimized to evaluate parameters. It is also advantageous for photographing large samples in bulk. However, a disadvantage of the tube source X-ray µCT is that it has a poor capacity at observing high-resolution phenomena that occur within 5 min. Because of its low beam intensity, it requires a lot of exposure time.
In particular, the measurement of volume change due to hydration occurs within a few minutes and requires a high X-ray intensity beam and fast scanning. The synchrotron radiation μCT (SR-μCT) provides a higher amount of light compared to the existing X-ray tube source and enables fast CT imaging. The high coherence of SR-μCT provides phase difference images that capture complex internal structures at a high resolution. Moreover, higher X-ray brightness is advantageous for fast scanning and the reduction of motion artifact.
In this study, two different types of bone graft materials were investigated, both kinds were composed of biphasic calcium phosphate (BCP) with identical chemical but different micro-macro porosity, pore size, and pore interconnection pathways. Then these materials were subjected to a 2D analysis technique based on SEM and a 3D analysis technique based on SR-μCT.
Materials and methods
Materials
This experiment used two types of bone graft materials. The Micro-macroporous biphasic calcium phosphate (MBCP™, Biomatlante, France) was purchased and used at a granule size of 0.5 to 1 mm. The MBCP™ particles were chemically composed of a 6:4 ratio of hydroxyapatite (HA) and β-Tricalcium Phosphate (β-TCP). The Ovisbone-BCPP (Ovis Bone BCP-modified pore size and porosity, Dentis, South Korea) used a granule size of 0.5 to 1 mm. The Ovisbone-BCPP particles were chemically composed of a 2:8 ratio of HA and β-TCP.
Morphological and porosity
Surface morphology for both scaffolds was observed using a scanning electron microscope (SEM) (AIS 2300C, Seron Tech., South Korea). The accelerating voltage was set at 20 kV.
The porosity analysis was performed via mercury intrusion porosimetry (MIP) (AutoPore IV 9520, Micromeritics, USA). The measurements were taken using 131.7 g of MBCP™ and 132.7 g of Ovisbone-BCPP. The total porosity per unit mass was calculated from the total intrusion volume. Mercury was applied with a pressure of 4.4500 psia for the measurements. The contact angle of the mercury was 130°.
Three-dimensional tomography using SR-uCT
Synchrotron radiation micro-computed tomography (SR-μCT) was used to analyze the 3D morphology, inner pore structure, and pore diameter of MBCP™ and Ovisbone-BCPP. SR-μCT scans were performed at the Biomedical Imaging (BMI) beamline of the Pohang Light Source (PLS-II). The samples were fixed on a microscope glass slide with X-ray energy 23 keV, a beam current 400 mA, and an attenuation graphite filter (thickness 3 mm). The sample was attached to a stage that rotated 0° to 180° with an exposure time of 100 ms, each at 0.25°. The sample to detector distance (SDD) of 10 cm, with images acquired by a charge-coupled device (CCD) camera (PCO edge, PCO AG, Germany) system, which consisted of a scintillation crystal of LuAg: Ce (thickness 50 μm) and an objective lens (×10). The field of view was 1.6 mm (horizontal) × 1.4 mm (vertical), with an effective pixel size of 0.65 μm. The beamline layout is shown in Figure 1. The bone graft material was fixed using a sponge tape on a glass slide. For the tomographic scan, 720 projection images were taken. First, the dried particulates were taken via CT, with a syringe to disperse the particulates such that they were sufficiently exposed to water (about 500 µL). Afterward, CT scans were performed at 5 and 10-min intervals to obtain the relevant data. Although the experimental hutch was kept at room temperature, the shape of water became hemispherical just after 10 min, suggesting that there was some evaporation of water.

The layout diagram of the SR-μCT experiment was performed using the 6C Biomedical imaging (BMI) beamline at PLS-II. A 23 keV monochromatic beam from a double crystal monochromator (DCM) was attenuated by a graphite attenuator, and the beam was propagated 10 cm from the bone graft materials to a scintillation crystal (LuAg: Ce, thickness 50 μm) that converted the monochromatic X-rays into the visible light on the objective lens (×10).
Analysis of pore size
The image data for the bone graft materials obtained using SR-μCT reconstruction was performed with the commercial software Octopus (Version 8.9; Inside Matters, Aalst, Belgium). The process was as follows the removal of white spot, normalization, ring filtration, and making sinograms. This implemented the ordinarily filtered back-projection algorithm. 19
The internal pore size was measured on an X-ray cross-sectional image. The pores in the form of circles were measured for each diameter, in other cases, the longest part, and the shortest diameter were measured. The pore size measured in each cross-sectional image was added to represent the average pore size.
Analysis of the 3D structure and hydration effects
In the in-situ experiment of the hydration effects, CT data were continuously acquired at intervals of 0, 5, and 10 min. The 3D image visualization, as well as processing and analysis, used another commercial software Amira (Version 6.2; FEI Co., Hillsboro, OR, USA). The noise reduction was median-filtered on the reconstruction images. The volume analysis was preceded by image segmentation. The individual pixels of the 3D images were classified into two categories external body and internal pore. The volume analysis was conducted by counting the number of pixels belonging to each category.
Results
Characterization of surface and porosity
The SEM images of the morphology microstructure clearly show two different surface structures (Figure 2(a) and (b)) and compared them to the corresponding X-ray 3D images obtained for MBCP™ and Ovisbone-BCPP (Figure 2(c) and (d)). The porosity of MBCP™ and Ovisbone-BCPP was found to be 58.4% and 76.5%, respectively, which was larger than that of MBCP™. Considering the comparable porosity of the human trabecular bone (average porosity 79.3%), 20 this result suggested that Ovisbone-BCPP was similar to the porosity of human bone. Three-dimensional cross-section images show a detailed view of the internal pore structure in Figure 2(e) and (f). The pore size obtained from the measured SR-uCT cross-sectional images for MBCP™ and Ovisbone-BCPP. The MBCP™ had a large fraction of the pore diameter in the 131 to 582 μm range and an average pore diameter of 294.25 ± 194.1 μm. While Ovisbone-BCPP showed a pore diameter in the 117 to 220 μm range and an average pore diameter of 163.92 ± 30.7 μm. Thus, the average pore diameter of Ovisbone-BCPP was different from that of MBCP™.
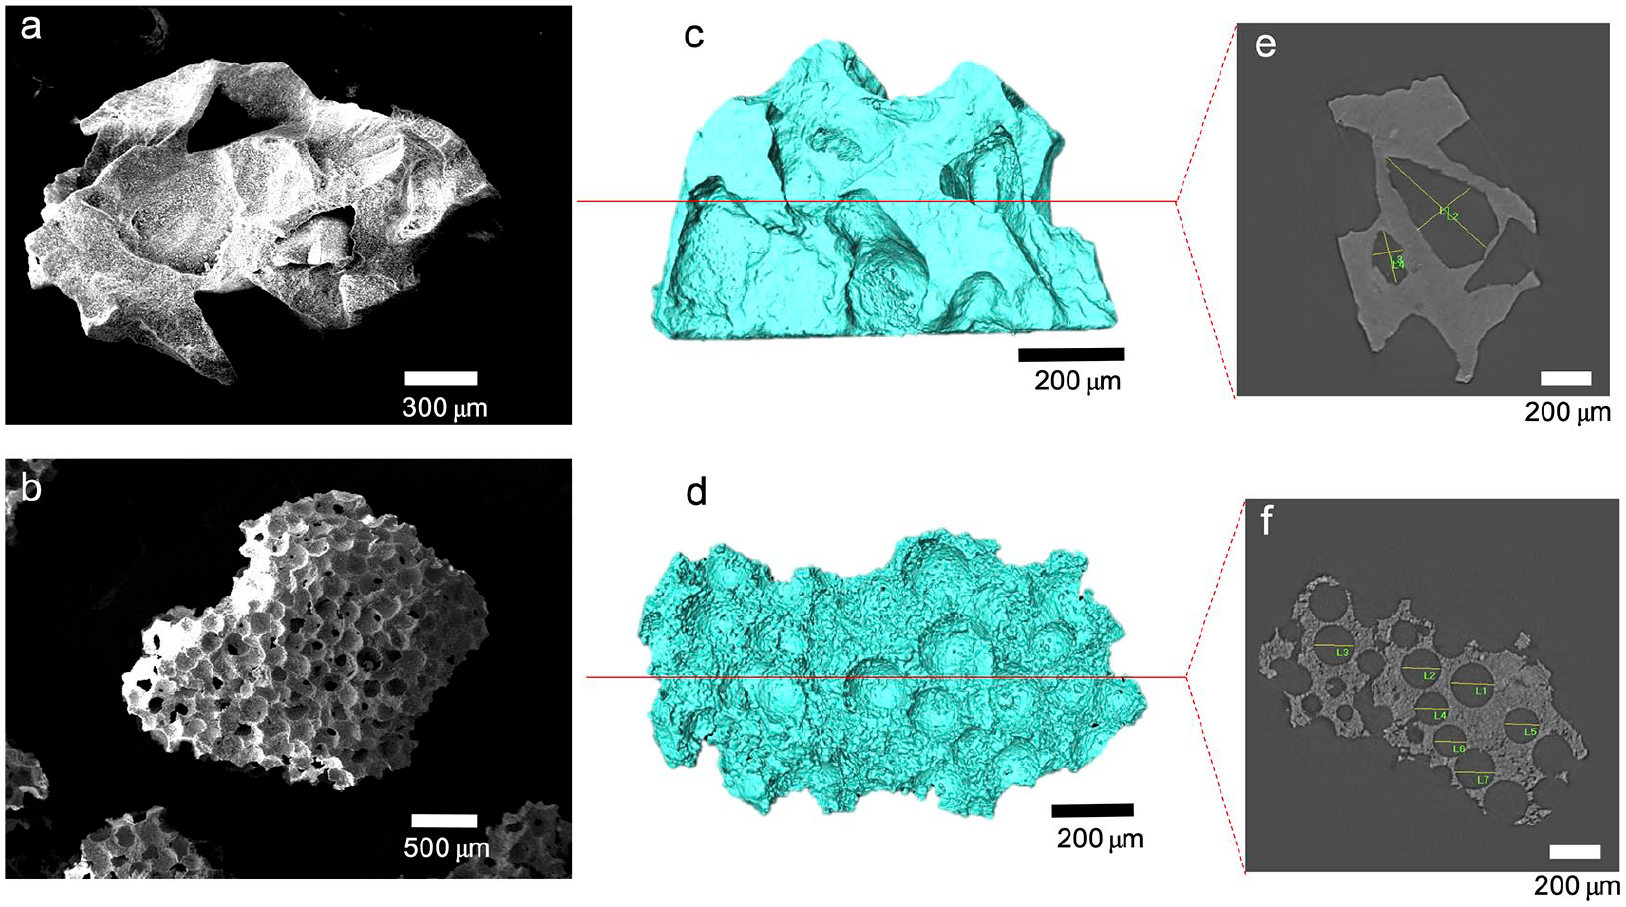
Bone graft material structure images for SEM and SR-μCT. SEM image of morphology (a) MBCP™ and (b) Ovisbone-BCPP; SR-μCT image of the volume rendering (c) MBCP™ and (d) Ovisbone-BCPP; in the red line of the cross-sectional view (e) MBCP™ and (f) Ovisbone-BCPP.
Three-dimensional structure and internal pores of MBCP™
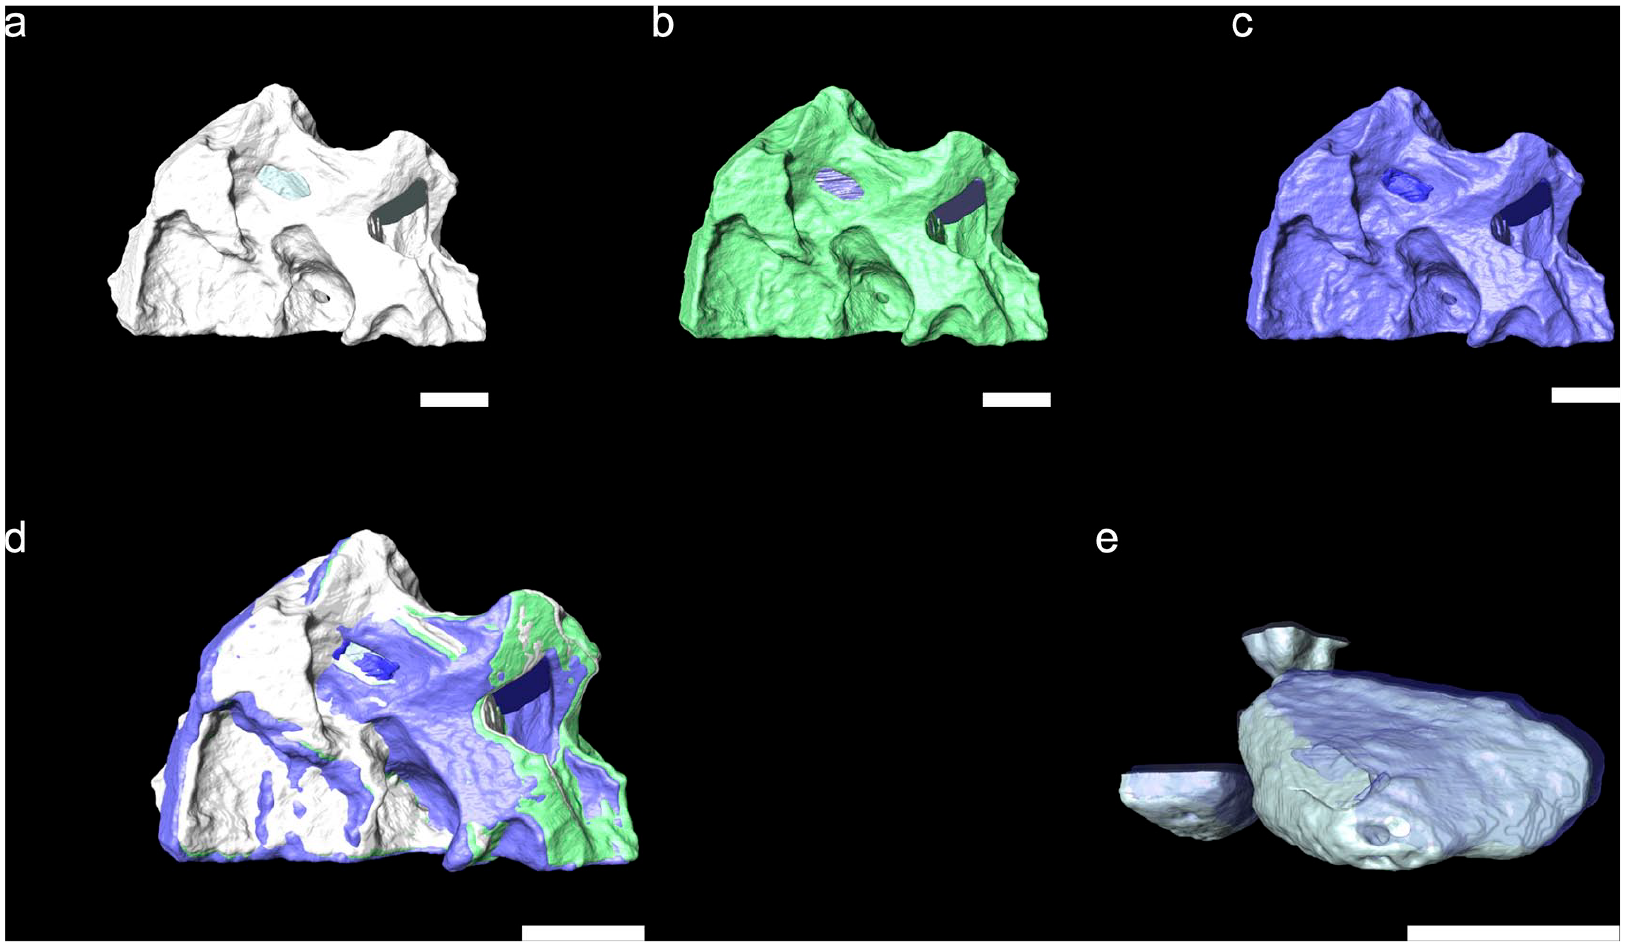
Three-dimensional visualization imaging was used for the most important parameters, including bone graft structure, internal pore structure, and the pore interconnection pathway in Figure 3. The details visualized for the various bone graft structures included an internal pore structure (Figure 3(a)), performed using segmentation software, which showed that the pores present inside were confirmed (Figure 3(b)). Analysis of the various node connections of the internal pores shows the pore interconnection three-node point depicted in Figure 3(c). Thus, the large pores (about ~400 μm) in the center position and small pores (about ~100 to 200 μm) around them are connected. The inner pore shape exhibits a long oval shape, and the four pores were arranged irregularly.

Three-dimensional structure of MBCP™ using SR-μCT with 0.65 μm pixel size. (a) External body with an internal pore, (b) internal pore without external body, (c) pore interconnection pathway (yellow line). The yellow dot points indicate a connected pore (scale bar = 200 μm).
Three-dimensional structure and internal pores for Ovisbone-BCPP
The 3D visualization images show that all of the surfaces are porous, and the internal pore has the node connection in Figure 4. The detailed visual of the various internal structures included the pore structure (Figure 4(a)), performed using segmentation software by removing the surface structure; only the internal pores are depicted (Figure 4(b)). The inner pore shape is round and irregularly arranged. Analysis of the various node connections for the inner pores showed the pore interconnection nine-node points depicted in Figure 4(c). The internal pores are connected to the outside and showed a lot of directionality; this result suggested that the internal pores have greater continuity compared to the MBCP™.

Three-dimensional structure of the Ovisbone-BCPP using SR-μCT with 0.65 μm pixel size. (a) External body with internal pore, (b) internal pore without external body, (c) pore interconnection pathway (yellow line). The yellow dot points indicate the connected pores (scale bar = 200 μm).
Analysis of the hydration effects for MBCP™ and Ovisbone-BCPP
The hydration effect of MBCP™ can be divided into three phases during the in vitro degradation process 0, 5, and 10 min (Figure 5(a)–(c), the MBCP™ volume had changed less and increased significantly as depicted in Figure 5(d)). The volume measurement of 0 min, plus exposure to water after 5 and 10 min were 0.3059, 0.3075, and 0.3076 mm3, respectively. Also, the internal pore diameter measurements of 318.05 ± 141.5 μm, 318.80 ± 141.5 μm, and 319.09 ± 141.6 μm, respectively, are shown in Figure 5(e).
The hydration effect of 3D segmentation divided into three phases images for MBCP™. (a) 0 min, (b) 5 min, (c) 10 min, (d) overlay image of external bone graft and (e) overlay image of internal pore (scale bar = 200 μm).
The hydration effect of Ovisbone-BCPP can be divided into three phases during the in vitro degradation process: 0, 5, and 10 min (Figure 6(a)–(c), the MBCP™ volume increased significantly as depicted in Figure 6(d)). The volume measurement of 0 min, then exposure of water after 5 and 10 min were 0.209, 0.22, and 0.228 mm3, respectively. Also, the intra-pore diameter measurement of 174.72 ± 22.9 μm, 180.02 ± 25.08 μm, and 180.32 ± 25 μm, respectively, as depicted in Figure 6(e). The results of the volume analysis are summarised in Table 1.

The hydration effect of 3D segmentation divided into three phases includes images for Ovisbone-BCPP. (a) 0 min, (b) 5 min, (c) 10 min, (d) the overlay image of the external bone graft, and (e) overlay image of the internal pore (scale bar = 200 μm).
Results obtained from the volume analysis of MBCP™ and Ovisbone-BCPP.

Discussion
This study reported visualization of MBCP™ and the Ovisbone-BCPP structure for the hydration effect information using SR-μCT. Furthermore, we presented a 3D image with hydration and the changes in volume plus an inner pore structure analysis. Qualitative and quantitative results were also obtained in regard to the morphology of the 3D structure, porosity, pore diameter, and the structural volume changes related to hydration.
The results suggested that the SR-μCT provided superior visualization of the in-site analysis over the SEM image. During bone graft surgery, synthetic bone grafts, such as bio ceramics, were used to repair the defects. Synthetic bone graft materials were already showing clinically useful results. Success in treating a wide range of defects depended on bone conduction and the ability to support bone formation with bone-forming cells. Therefore, analysis of the microstructure and macrostructure of the synthetic bone graft material has become increasingly important in determining the properties of the scaffold to be used for bone regeneration. The choice of technology for qualitative and quantitative analysis was important.
In the SEM image, both the external structure and the microstructure of the sample could be visualized via conventional two-dimensional analysis. SEM images primarily provided quantitative information regarding the distribution of the total diameter and pore size. The results obtained by this method could define the porosity of the material. However, the SEM image could not be relied upon to provide information about the connectivity of the pores and their internal structure. In particular, it was not possible to obtain information about the volume changes caused by the hydration effects that had already been performed in vivo or convenience in operation, and this property was important for tissue engineering applications. Conversely, SR-μCT allowed for a more accurate investigation of the scaffold structures due to the availability of 3D data.
Most of the previous studies were conducted in a dry state when examining the scaffold characteristics.9,13–15 However, hydration occurs during bone grafting surgery because once it is implanted into the defect, contact with the blood occurs. Volume changes in hydration depend on the micropore and particle density. 10
The MBCP™ of SR-μCT cross-sectional images showed that the internal particle density was very dense. When in the hydration state, the rate of volume change for the hydration effects was about 0.5%, and the change in internal pores was 0.32%. Furthermore, in the SR-μCT cross-sectional image of the Ovisbone-BCPP, micropores were observed. In the hydration state, the rate of volume change in the hydration effect was about 9%, and the change in internal pores was 3.2%. Thus, the results appear to be dependent on material density. Previous studies have reported that the water absorption of granules depends on the capillary action of pores in the granules and the space between the granules. 21 It has been reported that the highly hydratable granules could absorb blood more rapidly when implanted in the defect area. 22 Because the blood contained factors and components beneficial for bone formation, it could help the bones regenerate at the site of the defect. The hydration measurement was derived mathematically using differential equations, and the micropores present inside were not considered. 23 The results obtained showed that scaffolds with different internal structures showed differences in volume due to hydration in terms of their structural properties. Therefore, SR-μCT could quantify the difference in volume change, according to hydration. The ideal scaffold for bone regeneration required microporosity and allowed for a structure characterized by porosity that enabled good vascularization of the implants and bone deposition via cell adhesion and porosity.
In this study, a high-resolution image was analyzed with a resolution of 1 μm or less, and a small field of view (1.6 (H) × 1.4 (V) mm) that had a limitation that only one particle could be observed. SR-uCT was non-destructive and allowed us to directly analyze the 3D model and measure the volume change according to hydration. However, it was highly dependent on processing non-standardized image data. To obtain a more accurate analysis, it is necessary to use a lot of particulates. For example, a phantom experiment that resembles a defective site in the body should be performed to check for hydration-associated changes in the shape of the internal and external pores.
Conclusion
The SR-μCT is an important preclinical imaging method for structural analysis and visualization. In the field of tissue engineering, we are constantly researching new approaches. A promising treatment for bone defects involves a tissue engineering scaffold. It is important to measure the 3D structure and phenomena occurring in vivo. SR-μCT could be used as an in-situ evaluation method.
Footnotes
Acknowledgements
The authors thank J-H Lim of the 6C beamline at PAL (Pohang, Republic of Korea) for his help during the experiments.
Declaration of conflicting interests
The author(s) declared no potential conflicts of interest with respect to the research, authorship, and/or publication of this article.
Funding
The author(s) disclosed receipt of the following financial support for the research, authorship, and/or publication of this article: This research was financially supported by the Ministry of Small and Medium-sized Enterprises (SMEs) and Startups (MSS), Korea, under the “Regional Specialized Industry Development Program (R&D, P0004845)” supervised by the Korea Institute for Advancement of Technology (KIAT). This work was supported by the National Research Foundation of Korea (NRF) with a grant funded by the Korean government (MSIT) (2020R1A2C1013306) (2019R1I1A1A01041675).